|
|
市場調査レポート
商品コード
1179619
アウトバウンドMICE市場:イベントタイプ別(会議、報奨、コンベンション、展示会):世界の機会分析および産業予測、2021-2031年Outbound MICE Market By Event Type (Meetings, Incentives, Conventions, Exhibitions): Global Opportunity Analysis and Industry Forecast, 2021-2031 |
||||||
|
|
|||||||


| アウトバウンドMICE市場:イベントタイプ別(会議、報奨、コンベンション、展示会):世界の機会分析および産業予測、2021-2031年 |
|
出版日: 2022年09月01日
発行: Allied Market Research
ページ情報: 英文 206 Pages
納期: 2~3営業日
|
- 全表示
- 概要
- 図表
- 目次
世界のアウトバウンドMICE市場規模は、2021年に2259億米ドル、2031年には1兆2722億米ドルに達すると推定され、2022年から2031年までのCAGRは13.3%を記録しています。
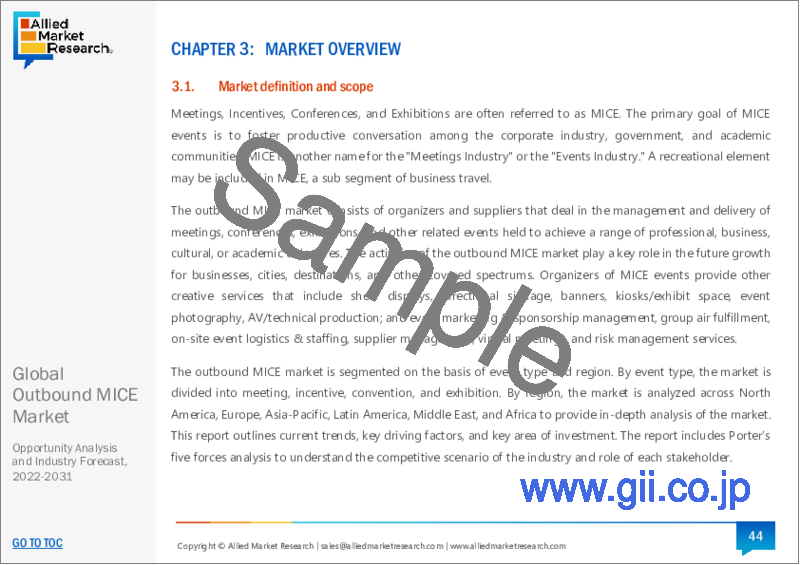
レジャー、社会、宗教、教育、医療、小売など、その他の多くの旅行関連活動の中で、ビジネストラベルは世界的に増加傾向にあります。これは、会議、カンファレンス、セミナー、ワークショップなどに参加するための訪問者数が増加していることが主な原因です。このような旅行者をMICE旅行者と呼ぶことが多いです。ミーティング、インセンティブ、コンファレンス、展示会などをMICEと略称で呼ぶ。ミーティング産業は、観光ビジネスのMICE分野の別称です。
目次
第1章 イントロダクション
第2章 エグゼクティブサマリー
第3章 市場の概要
- 市場の定義と範囲
- 主な調査結果
- 主な投資ポケット
- ポーターのファイブフォース分析
- 主要企業のポジショニング
- 市場力学
- 促進要因
- 抑制要因
- 機会
- COVID-19 影響分析
第4章 アウトバウンドMICE市場:イベントタイプ別
- 概要
- 市場規模・予測
- ミーティング
- 主な市場動向、成長要因、機会
- 市場規模・予測:地域別
- 市場分析:国別
- インセンティブ
- 主な市場動向、成長要因、機会
- 市場規模・予測:地域別
- 市場分析:国別
- コンベンション
- 主な市場動向、成長要因、機会
- 市場規模・予測:地域別
- 市場分析:国別
- 展示会
- 主な市場動向、成長要因、機会
- 市場規模・予測:地域別
- 市場分析:国別
第5章 アウトバウンドMICE市場:地域別
- 概要
- 市場規模・予測
- 北米
- 主な動向と機会
- 北米市場規模推移・予測:イベントタイプ別
- 北米の市場規模・予測:国別
- 米国
- カナダ
- メキシコ
- 欧州
- 主な動向と機会
- 欧州市場規模・予測:イベントタイプ別
- 欧州市場規模・予測:国別
- ドイツ
- 英国
- スペイン
- フランス
- イタリア
- その他欧州
- アジア太平洋地域
- 主な動向と機会
- アジア太平洋地域の市場規模・予測:イベントタイプ別
- アジア太平洋地域の市場規模・予測:国別
- 中国
- インド
- シンガポール
- オーストラリア
- 日本
- マレーシア
- 韓国
- 香港
- その他アジア太平洋地域
- LAMEA
- 主な動向と機会
- LAMEAの市場規模・予測:イベントタイプ別
- LAMEAの市場規模・予測:国別
- ラテンアメリカ
- 中東
- アフリカ
第6章 企業情勢
- イントロダクション
- 主要成功戦略
- 主要10社の製品マッピング
- 競合ダッシュボード
- 競合のヒートマップ
- 主な発展
第7章 企業プロファイル
- 360 Destination Group
- Access Destination Services
- ATPI LTD.
- BCD GROUP(BCD MEETINGS & EVENTS)
- BI Worldwide
- Carlson Wagonlit Travel(CWT Meetings & Events)
- CIEVENTS
- Conference Care Ltd.
- Creative Group, Inc.
- CSI DMC
- IBTM
- ITA Group
- MARITZ
- Meetings & Incentives Worldwide, Inc.
- ONE10, LLC
- The Freeman Company
- The Interpublic Group of Companies, Inc.
LIST OF TABLES
- TABLE 1. GLOBAL OUTBOUND MICE MARKET, BY EVENT TYPE, 2021-2031 ($BILLION)
- TABLE 2. OUTBOUND MICE MARKET, FOR MEETINGS, BY REGION, 2021-2031 ($BILLION)
- TABLE 3. OUTBOUND MICE MARKET FOR MEETINGS, BY COUNTRY, 2021-2031 ($BILLION)
- TABLE 4. OUTBOUND MICE MARKET, FOR INCENTIVES, BY REGION, 2021-2031 ($BILLION)
- TABLE 5. OUTBOUND MICE MARKET FOR INCENTIVES, BY COUNTRY, 2021-2031 ($BILLION)
- TABLE 6. OUTBOUND MICE MARKET, FOR CONVENTIONS, BY REGION, 2021-2031 ($BILLION)
- TABLE 7. OUTBOUND MICE MARKET FOR CONVENTIONS, BY COUNTRY, 2021-2031 ($BILLION)
- TABLE 8. OUTBOUND MICE MARKET, FOR EXHIBITIONS, BY REGION, 2021-2031 ($BILLION)
- TABLE 9. OUTBOUND MICE MARKET FOR EXHIBITIONS, BY COUNTRY, 2021-2031 ($BILLION)
- TABLE 10. OUTBOUND MICE MARKET, BY REGION, 2021-2031 ($BILLION)
- TABLE 11. NORTH AMERICA OUTBOUND MICE MARKET, BY EVENT TYPE, 2021-2031 ($BILLION)
- TABLE 12. NORTH AMERICA OUTBOUND MICE MARKET, BY COUNTRY, 2021-2031 ($BILLION)
- TABLE 13. U.S. OUTBOUND MICE MARKET, BY EVENT TYPE, 2021-2031 ($BILLION)
- TABLE 14. CANADA OUTBOUND MICE MARKET, BY EVENT TYPE, 2021-2031 ($BILLION)
- TABLE 15. MEXICO OUTBOUND MICE MARKET, BY EVENT TYPE, 2021-2031 ($BILLION)
- TABLE 16. EUROPE OUTBOUND MICE MARKET, BY EVENT TYPE, 2021-2031 ($BILLION)
- TABLE 17. EUROPE OUTBOUND MICE MARKET, BY COUNTRY, 2021-2031 ($BILLION)
- TABLE 18. GERMANY OUTBOUND MICE MARKET, BY EVENT TYPE, 2021-2031 ($BILLION)
- TABLE 19. UK OUTBOUND MICE MARKET, BY EVENT TYPE, 2021-2031 ($BILLION)
- TABLE 20. SPAIN OUTBOUND MICE MARKET, BY EVENT TYPE, 2021-2031 ($BILLION)
- TABLE 21. FRANCE OUTBOUND MICE MARKET, BY EVENT TYPE, 2021-2031 ($BILLION)
- TABLE 22. ITALY OUTBOUND MICE MARKET, BY EVENT TYPE, 2021-2031 ($BILLION)
- TABLE 23. REST OF EUROPE OUTBOUND MICE MARKET, BY EVENT TYPE, 2021-2031 ($BILLION)
- TABLE 24. ASIA-PACIFIC OUTBOUND MICE MARKET, BY EVENT TYPE, 2021-2031 ($BILLION)
- TABLE 25. ASIA-PACIFIC OUTBOUND MICE MARKET, BY COUNTRY, 2021-2031 ($BILLION)
- TABLE 26. CHINA OUTBOUND MICE MARKET, BY EVENT TYPE, 2021-2031 ($BILLION)
- TABLE 27. INDIA OUTBOUND MICE MARKET, BY EVENT TYPE, 2021-2031 ($BILLION)
- TABLE 28. SINGAPORE OUTBOUND MICE MARKET, BY EVENT TYPE, 2021-2031 ($BILLION)
- TABLE 29. AUSTRALIA OUTBOUND MICE MARKET, BY EVENT TYPE, 2021-2031 ($BILLION)
- TABLE 30. JAPAN OUTBOUND MICE MARKET, BY EVENT TYPE, 2021-2031 ($BILLION)
- TABLE 31. MALAYSIA OUTBOUND MICE MARKET, BY EVENT TYPE, 2021-2031 ($BILLION)
- TABLE 32. SOUTH KOREA OUTBOUND MICE MARKET, BY EVENT TYPE, 2021-2031 ($BILLION)
- TABLE 33. HONG KONG OUTBOUND MICE MARKET, BY EVENT TYPE, 2021-2031 ($BILLION)
- TABLE 34. REST OF ASIA-PACIFIC OUTBOUND MICE MARKET, BY EVENT TYPE, 2021-2031 ($BILLION)
- TABLE 35. LAMEA OUTBOUND MICE MARKET, BY EVENT TYPE, 2021-2031 ($BILLION)
- TABLE 36. LAMEA OUTBOUND MICE MARKET, BY COUNTRY, 2021-2031 ($BILLION)
- TABLE 37. LATIN AMERICA OUTBOUND MICE MARKET, BY EVENT TYPE, 2021-2031 ($BILLION)
- TABLE 38. MIDDLE EAST OUTBOUND MICE MARKET, BY EVENT TYPE, 2021-2031 ($BILLION)
- TABLE 39. AFRICA OUTBOUND MICE MARKET, BY EVENT TYPE, 2021-2031 ($BILLION)
- TABLE 40.360 DESTINATION GROUP: COMPANY SNAPSHOT
- TABLE 41.360 DESTINATION GROUP: OPERATING SEGMENTS
- TABLE 42.360 DESTINATION GROUP: PRODUCT PORTFOLIO
- TABLE 43.360 DESTINATION GROUP: NET SALES,
- TABLE 44.360 DESTINATION GROUP: KEY STRATERGIES
- TABLE 45.ACCESS DESTINATION SERVICES: COMPANY SNAPSHOT
- TABLE 46.ACCESS DESTINATION SERVICES: OPERATING SEGMENTS
- TABLE 47.ACCESS DESTINATION SERVICES: PRODUCT PORTFOLIO
- TABLE 48.ACCESS DESTINATION SERVICES: NET SALES,
- TABLE 49.ACCESS DESTINATION SERVICES: KEY STRATERGIES
- TABLE 50.ATPI LTD.: COMPANY SNAPSHOT
- TABLE 51.ATPI LTD.: OPERATING SEGMENTS
- TABLE 52.ATPI LTD.: PRODUCT PORTFOLIO
- TABLE 53.ATPI LTD.: NET SALES,
- TABLE 54.ATPI LTD.: KEY STRATERGIES
- TABLE 55.BCD GROUP (BCD MEETINGS & EVENTS): COMPANY SNAPSHOT
- TABLE 56.BCD GROUP (BCD MEETINGS & EVENTS): OPERATING SEGMENTS
- TABLE 57.BCD GROUP (BCD MEETINGS & EVENTS): PRODUCT PORTFOLIO
- TABLE 58.BCD GROUP (BCD MEETINGS & EVENTS): NET SALES,
- TABLE 59.BCD GROUP (BCD MEETINGS & EVENTS): KEY STRATERGIES
- TABLE 60.BI WORLDWIDE: COMPANY SNAPSHOT
- TABLE 61.BI WORLDWIDE: OPERATING SEGMENTS
- TABLE 62.BI WORLDWIDE: PRODUCT PORTFOLIO
- TABLE 63.BI WORLDWIDE: NET SALES,
- TABLE 64.BI WORLDWIDE: KEY STRATERGIES
- TABLE 65.CARLSON WAGONLIT TRAVEL (CWT MEETINGS & EVENTS): COMPANY SNAPSHOT
- TABLE 66.CARLSON WAGONLIT TRAVEL (CWT MEETINGS & EVENTS): OPERATING SEGMENTS
- TABLE 67.CARLSON WAGONLIT TRAVEL (CWT MEETINGS & EVENTS): PRODUCT PORTFOLIO
- TABLE 68.CARLSON WAGONLIT TRAVEL (CWT MEETINGS & EVENTS): NET SALES,
- TABLE 69.CARLSON WAGONLIT TRAVEL (CWT MEETINGS & EVENTS): KEY STRATERGIES
- TABLE 70.CIEVENTS: COMPANY SNAPSHOT
- TABLE 71.CIEVENTS: OPERATING SEGMENTS
- TABLE 72.CIEVENTS: PRODUCT PORTFOLIO
- TABLE 73.CIEVENTS: NET SALES,
- TABLE 74.CIEVENTS: KEY STRATERGIES
- TABLE 75.CONFERENCE CARE LTD.: COMPANY SNAPSHOT
- TABLE 76.CONFERENCE CARE LTD.: OPERATING SEGMENTS
- TABLE 77.CONFERENCE CARE LTD.: PRODUCT PORTFOLIO
- TABLE 78.CONFERENCE CARE LTD.: NET SALES,
- TABLE 79.CONFERENCE CARE LTD.: KEY STRATERGIES
- TABLE 80.CREATIVE GROUP, INC.: COMPANY SNAPSHOT
- TABLE 81.CREATIVE GROUP, INC.: OPERATING SEGMENTS
- TABLE 82.CREATIVE GROUP, INC.: PRODUCT PORTFOLIO
- TABLE 83.CREATIVE GROUP, INC.: NET SALES,
- TABLE 84.CREATIVE GROUP, INC.: KEY STRATERGIES
- TABLE 85.CSI DMC: COMPANY SNAPSHOT
- TABLE 86.CSI DMC: OPERATING SEGMENTS
- TABLE 87.CSI DMC: PRODUCT PORTFOLIO
- TABLE 88.CSI DMC: NET SALES,
- TABLE 89.CSI DMC: KEY STRATERGIES
- TABLE 90.IBTM: COMPANY SNAPSHOT
- TABLE 91.IBTM: OPERATING SEGMENTS
- TABLE 92.IBTM: PRODUCT PORTFOLIO
- TABLE 93.IBTM: NET SALES,
- TABLE 94.IBTM: KEY STRATERGIES
- TABLE 95.ITA GROUP: COMPANY SNAPSHOT
- TABLE 96.ITA GROUP: OPERATING SEGMENTS
- TABLE 97.ITA GROUP: PRODUCT PORTFOLIO
- TABLE 98.ITA GROUP: NET SALES,
- TABLE 99.ITA GROUP: KEY STRATERGIES
- TABLE 100.MARITZ: COMPANY SNAPSHOT
- TABLE 101.MARITZ: OPERATING SEGMENTS
- TABLE 102.MARITZ: PRODUCT PORTFOLIO
- TABLE 103.MARITZ: NET SALES,
- TABLE 104.MARITZ: KEY STRATERGIES
- TABLE 105.MEETINGS & INCENTIVES WORLDWIDE, INC.: COMPANY SNAPSHOT
- TABLE 106.MEETINGS & INCENTIVES WORLDWIDE, INC.: OPERATING SEGMENTS
- TABLE 107.MEETINGS & INCENTIVES WORLDWIDE, INC.: PRODUCT PORTFOLIO
- TABLE 108.MEETINGS & INCENTIVES WORLDWIDE, INC.: NET SALES,
- TABLE 109.MEETINGS & INCENTIVES WORLDWIDE, INC.: KEY STRATERGIES
- TABLE 110.ONE10, LLC: COMPANY SNAPSHOT
- TABLE 111.ONE10, LLC: OPERATING SEGMENTS
- TABLE 112.ONE10, LLC: PRODUCT PORTFOLIO
- TABLE 113.ONE10, LLC: NET SALES,
- TABLE 114.ONE10, LLC: KEY STRATERGIES
- TABLE 115.THE FREEMAN COMPANY: COMPANY SNAPSHOT
- TABLE 116.THE FREEMAN COMPANY: OPERATING SEGMENTS
- TABLE 117.THE FREEMAN COMPANY: PRODUCT PORTFOLIO
- TABLE 118.THE FREEMAN COMPANY: NET SALES,
- TABLE 119.THE FREEMAN COMPANY: KEY STRATERGIES
- TABLE 120.THE INTERPUBLIC GROUP OF COMPANIES, INC.: COMPANY SNAPSHOT
- TABLE 121.THE INTERPUBLIC GROUP OF COMPANIES, INC.: OPERATING SEGMENTS
- TABLE 122.THE INTERPUBLIC GROUP OF COMPANIES, INC.: PRODUCT PORTFOLIO
- TABLE 123.THE INTERPUBLIC GROUP OF COMPANIES, INC.: NET SALES,
- TABLE 124.THE INTERPUBLIC GROUP OF COMPANIES, INC.: KEY STRATERGIES
LIST OF FIGURES
- FIGURE 1.OUTBOUND MICE MARKET SEGMENTATION
- FIGURE 2.OUTBOUND MICE MARKET,2021-2031
- FIGURE 3.OUTBOUND MICE MARKET,2021-2031
- FIGURE 4. TOP INVESTMENT POCKETS, BY REGION
- FIGURE 5.PORTER FIVE-1
- FIGURE 6.PORTER FIVE-2
- FIGURE 7.PORTER FIVE-3
- FIGURE 8.PORTER FIVE-4
- FIGURE 9.PORTER FIVE-5
- FIGURE 10.TOP PLAYER POSITIONING
- FIGURE 11.OUTBOUND MICE MARKET:DRIVERS, RESTRAINTS AND OPPORTUNITIES
- FIGURE 12.OUTBOUND MICE MARKET,BY EVENT TYPE,2021(%)
- FIGURE 13.COMPARATIVE SHARE ANALYSIS OF MEETINGS OUTBOUND MICE MARKET,2021-2031(%)
- FIGURE 14.COMPARATIVE SHARE ANALYSIS OF INCENTIVES OUTBOUND MICE MARKET,2021-2031(%)
- FIGURE 15.COMPARATIVE SHARE ANALYSIS OF CONVENTIONS OUTBOUND MICE MARKET,2021-2031(%)
- FIGURE 16.COMPARATIVE SHARE ANALYSIS OF EXHIBITIONS OUTBOUND MICE MARKET,2021-2031(%)
- FIGURE 17.OUTBOUND MICE MARKET BY REGION,2021
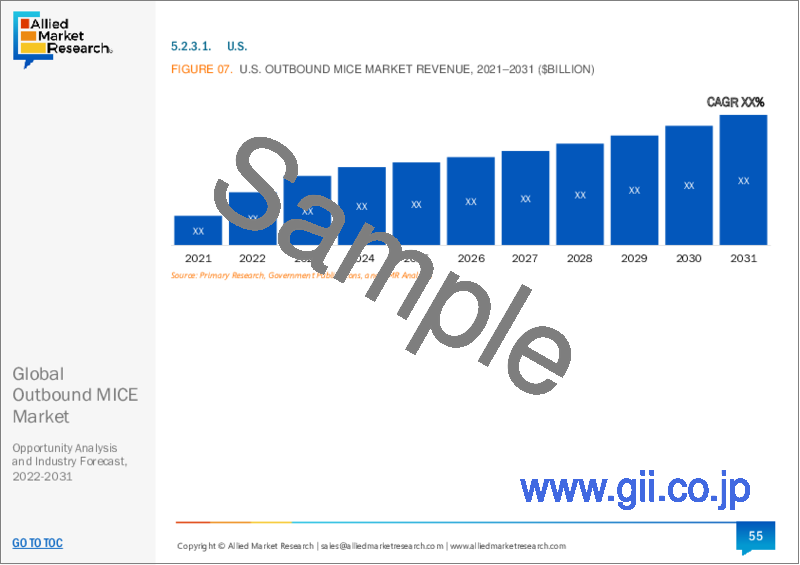
- FIGURE 18.U.S. OUTBOUND MICE MARKET,2021-2031($BILLION)
- FIGURE 19.CANADA OUTBOUND MICE MARKET,2021-2031($BILLION)
- FIGURE 20.MEXICO OUTBOUND MICE MARKET,2021-2031($BILLION)
- FIGURE 21.GERMANY OUTBOUND MICE MARKET,2021-2031($BILLION)
- FIGURE 22.UK OUTBOUND MICE MARKET,2021-2031($BILLION)
- FIGURE 23.SPAIN OUTBOUND MICE MARKET,2021-2031($BILLION)
- FIGURE 24.FRANCE OUTBOUND MICE MARKET,2021-2031($BILLION)
- FIGURE 25.ITALY OUTBOUND MICE MARKET,2021-2031($BILLION)
- FIGURE 26.REST OF EUROPE OUTBOUND MICE MARKET,2021-2031($BILLION)
- FIGURE 27.CHINA OUTBOUND MICE MARKET,2021-2031($BILLION)
- FIGURE 28.INDIA OUTBOUND MICE MARKET,2021-2031($BILLION)
- FIGURE 29.SINGAPORE OUTBOUND MICE MARKET,2021-2031($BILLION)
- FIGURE 30.AUSTRALIA OUTBOUND MICE MARKET,2021-2031($BILLION)
- FIGURE 31.JAPAN OUTBOUND MICE MARKET,2021-2031($BILLION)
- FIGURE 32.MALAYSIA OUTBOUND MICE MARKET,2021-2031($BILLION)
- FIGURE 33.SOUTH KOREA OUTBOUND MICE MARKET,2021-2031($BILLION)
- FIGURE 34.HONG KONG OUTBOUND MICE MARKET,2021-2031($BILLION)
- FIGURE 35.REST OF ASIA-PACIFIC OUTBOUND MICE MARKET,2021-2031($BILLION)
- FIGURE 36.LATIN AMERICA OUTBOUND MICE MARKET,2021-2031($BILLION)
- FIGURE 37.MIDDLE EAST OUTBOUND MICE MARKET,2021-2031($BILLION)
- FIGURE 38.AFRICA OUTBOUND MICE MARKET,2021-2031($BILLION)
- FIGURE 39. TOP WINNING STRATEGIES, BY YEAR
- FIGURE 40. TOP WINNING STRATEGIES, BY DEVELOPMENT
- FIGURE 41. TOP WINNING STRATEGIES, BY COMPANY
- FIGURE 42.PRODUCT MAPPING OF TOP 10 PLAYERS
- FIGURE 43.COMPETITIVE DASHBOARD
- FIGURE 44.COMPETITIVE HEATMAP OF TOP 10 KEY PLAYERS
- FIGURE 45.360 DESTINATION GROUP.: NET SALES ,($BILLION)
- FIGURE 46.ACCESS DESTINATION SERVICES.: NET SALES ,($BILLION)
- FIGURE 47.ATPI LTD..: NET SALES ,($BILLION)
- FIGURE 48.BCD GROUP (BCD MEETINGS & EVENTS).: NET SALES ,($BILLION)
- FIGURE 49.BI WORLDWIDE.: NET SALES ,($BILLION)
- FIGURE 50.CARLSON WAGONLIT TRAVEL (CWT MEETINGS & EVENTS).: NET SALES ,($BILLION)
- FIGURE 51.CIEVENTS.: NET SALES ,($BILLION)
- FIGURE 52.CONFERENCE CARE LTD..: NET SALES ,($BILLION)
- FIGURE 53.CREATIVE GROUP, INC..: NET SALES ,($BILLION)
- FIGURE 54.CSI DMC.: NET SALES ,($BILLION)
- FIGURE 55.IBTM.: NET SALES ,($BILLION)
- FIGURE 56.ITA GROUP.: NET SALES ,($BILLION)
- FIGURE 57.MARITZ.: NET SALES ,($BILLION)
- FIGURE 58.MEETINGS & INCENTIVES WORLDWIDE, INC..: NET SALES ,($BILLION)
- FIGURE 59.ONE10, LLC.: NET SALES ,($BILLION)
- FIGURE 60.THE FREEMAN COMPANY.: NET SALES ,($BILLION)
- FIGURE 61.THE INTERPUBLIC GROUP OF COMPANIES, INC..: NET SALES ,($BILLION)
The global outbound MICE market size was valued at $225.9 billion in 2021 and is estimated to reach $1,272.2 billion by 2031, registering a CAGR of 13.3% from 2022 to 2031. Business travel is on the rise globally, among the many other travel-related activities including leisure, social, religious, educational, medical, retail, and so forth. This is largely attributable to an increase in the number of visits made to attend or take part in meetings, conferences, seminars, workshops and others. These travelers are frequently referred to as MICE travelers. Meetings, incentives, conferences, and exhibits are referred to by the abbreviation MICE. Meetings industry is another name for the MICE sector of the tourist business.
For the market analysis, the outbound MICE market is segmented into event type and region. By event type, it is segregated into meeting, incentive, convention, and exhibition. On the basis of region, it is analyzed across North America (the U.S., Canada, and Mexico), Europe (Germany, UK, Spain, France, Italy, and Rest of Europe), Asia-Pacific (China, India, Singapore, Australia, Japan, Malaysia, South Korea, Hong Kong, and Rest of AsiaPacific), and LAMEA (Latin America, Middle East, and Africa).
Region wise, LAMEA has gained considerable share in outbound MICE market and is expected grow at highest CAGR. New MICE locations are emerging, and they might even become more prominent than before as the MICE market looks more and more for distinctive and unforgettable experiences. Outbound MICE tourism is becoming more and more important to nations in Latin America and Africa. A nation like Egypt has been developing its infrastructure and is experiencing an increase in MICE tourism. Thereby growth in infrastructural development, better airline connections, decreasing rate of terror attacks, and surge in foreign direct investment in emerging countries of Latin America and Africa are likely to supplement the growth for the outbound MICE market during the forecast period.
The major players operating in the market are: 360 Destination Group, Access Destination Services, ATPI LTD., BCD GROUP (BCD MEETINGS & EVENTS), BI Worldwide, Carlson Wagonlit Travel (CWT Meetings & Events), CIEVENTS, Conference Care Ltd., Creative Group, Inc., CSI DMC, IBTM, ITA Group, MARITZ, Meetings & Incentives Worldwide, Inc., ONE10, LLC, The Freeman Company, and The Interpublic Group of Companies, Inc.
Key Benefits For Stakeholders
This report provides a quantitative analysis of the market segments, current trends, estimations, and dynamics of the outbound mice market analysis from 2021 to 2031 to identify the prevailing outbound mice market opportunities.
- The market research is offered along with information related to key drivers, restraints, and opportunities.
- Porter's five forces analysis highlights the potency of buyers and suppliers to enable stakeholders make profit-oriented business decisions and strengthen their supplier-buyer network.
- In-depth analysis of the outbound mice market segmentation assists to determine the prevailing market opportunities.
- Major countries in each region are mapped according to their revenue contribution to the global market.
- Market player positioning facilitates benchmarking and provides a clear understanding of the present position of the market players.
- The report includes the analysis of the regional as well as global outbound mice market trends, key players, market segments, application areas, and market growth strategies.
Key Market Segments
By Event Type
- Meetings
- Incentives
- Conventions
- Exhibitions
By Region
- North America
- U.S.
- Canada
- Mexico
- Europe
- Germany
- UK
- Spain
- France
- Italy
- Rest Of Europe
- Asia-Pacific
- China
- India
- Singapore
- Australia
- Japan
- Malaysia
- South Korea
- Hong Kong
- Rest Of Asia-Pacific
- LAMEA
- Latin America
- Middle East
- Africa
Key Market Players
- 360 Destination Group
- Access Destination Services
- ATPI LTD.
- BCD GROUP (BCD MEETINGS & EVENTS)
- BI Worldwide
- Carlson Wagonlit Travel (CWT Meetings & Events)
- CIEVENTS
- Conference Care Ltd.
- Creative Group, Inc.
- CSI DMC
- IBTM
- ITA Group
- MARITZ
- Meetings & Incentives Worldwide, Inc.
- ONE10, LLC
- The Freeman Company
- The Interpublic Group of Companies, Inc.
TABLE OF CONTENTS
CHAPTER 1:INTRODUCTION
- 1.1.Report description
- 1.2.Key market segments
- 1.3.Key benefits to the stakeholders
- 1.4.Research Methodology
- 1.4.1.Secondary research
- 1.4.2.Primary research
- 1.4.3.Analyst tools and models
CHAPTER 2:EXECUTIVE SUMMARY
- 2.1.Key findings of the study
- 2.2.CXO Perspective
CHAPTER 3:MARKET OVERVIEW
- 3.1.Market definition and scope
- 3.2.Key findings
- 3.2.1.Top investment pockets
- 3.3.Porter's five forces analysis
- 3.4.Top player positioning
- 3.5.Market dynamics
- 3.5.1.Drivers
- 3.5.2.Restraints
- 3.5.3.Opportunities
- 3.6.COVID-19 Impact Analysis on the market
CHAPTER 4: OUTBOUND MICE MARKET, BY EVENT TYPE
- 4.1 Overview
- 4.1.1 Market size and forecast
- 4.2 Meetings
- 4.2.1 Key market trends, growth factors and opportunities
- 4.2.2 Market size and forecast, by region
- 4.2.3 Market analysis by country
- 4.3 Incentives
- 4.3.1 Key market trends, growth factors and opportunities
- 4.3.2 Market size and forecast, by region
- 4.3.3 Market analysis by country
- 4.4 Conventions
- 4.4.1 Key market trends, growth factors and opportunities
- 4.4.2 Market size and forecast, by region
- 4.4.3 Market analysis by country
- 4.5 Exhibitions
- 4.5.1 Key market trends, growth factors and opportunities
- 4.5.2 Market size and forecast, by region
- 4.5.3 Market analysis by country
CHAPTER 5: OUTBOUND MICE MARKET, BY REGION
- 5.1 Overview
- 5.1.1 Market size and forecast
- 5.2 North America
- 5.2.1 Key trends and opportunities
- 5.2.2 North America Market size and forecast, by Event Type
- 5.2.3 North America Market size and forecast, by country
- 5.2.3.1 U.S.
- 5.2.3.1.1 Market size and forecast, by Event Type
- 5.2.3.2 Canada
- 5.2.3.2.1 Market size and forecast, by Event Type
- 5.2.3.3 Mexico
- 5.2.3.3.1 Market size and forecast, by Event Type
- 5.3 Europe
- 5.3.1 Key trends and opportunities
- 5.3.2 Europe Market size and forecast, by Event Type
- 5.3.3 Europe Market size and forecast, by country
- 5.3.3.1 Germany
- 5.3.3.1.1 Market size and forecast, by Event Type
- 5.3.3.2 UK
- 5.3.3.2.1 Market size and forecast, by Event Type
- 5.3.3.3 Spain
- 5.3.3.3.1 Market size and forecast, by Event Type
- 5.3.3.4 France
- 5.3.3.4.1 Market size and forecast, by Event Type
- 5.3.3.5 Italy
- 5.3.3.5.1 Market size and forecast, by Event Type
- 5.3.3.6 Rest of Europe
- 5.3.3.6.1 Market size and forecast, by Event Type
- 5.4 Asia-Pacific
- 5.4.1 Key trends and opportunities
- 5.4.2 Asia-Pacific Market size and forecast, by Event Type
- 5.4.3 Asia-Pacific Market size and forecast, by country
- 5.4.3.1 China
- 5.4.3.1.1 Market size and forecast, by Event Type
- 5.4.3.2 India
- 5.4.3.2.1 Market size and forecast, by Event Type
- 5.4.3.3 Singapore
- 5.4.3.3.1 Market size and forecast, by Event Type
- 5.4.3.4 Australia
- 5.4.3.4.1 Market size and forecast, by Event Type
- 5.4.3.5 Japan
- 5.4.3.5.1 Market size and forecast, by Event Type
- 5.4.3.6 Malaysia
- 5.4.3.6.1 Market size and forecast, by Event Type
- 5.4.3.7 South Korea
- 5.4.3.7.1 Market size and forecast, by Event Type
- 5.4.3.8 Hong Kong
- 5.4.3.8.1 Market size and forecast, by Event Type
- 5.4.3.9 Rest of Asia-Pacific
- 5.4.3.9.1 Market size and forecast, by Event Type
- 5.5 LAMEA
- 5.5.1 Key trends and opportunities
- 5.5.2 LAMEA Market size and forecast, by Event Type
- 5.5.3 LAMEA Market size and forecast, by country
- 5.5.3.1 Latin America
- 5.5.3.1.1 Market size and forecast, by Event Type
- 5.5.3.2 Middle East
- 5.5.3.2.1 Market size and forecast, by Event Type
- 5.5.3.3 Africa
- 5.5.3.3.1 Market size and forecast, by Event Type
CHAPTER 6: COMPANY LANDSCAPE
- 6.1. Introduction
- 6.2. Top winning strategies
- 6.3. Product Mapping of Top 10 Player
- 6.4. Competitive Dashboard
- 6.5. Competitive Heatmap
- 6.6. Key developments
CHAPTER 7: COMPANY PROFILES
- 7.1 360 Destination Group
- 7.1.1 Company overview
- 7.1.2 Company snapshot
- 7.1.3 Operating business segments
- 7.1.4 Product portfolio
- 7.1.5 Business performance
- 7.1.6 Key strategic moves and developments
- 7.2 Access Destination Services
- 7.2.1 Company overview
- 7.2.2 Company snapshot
- 7.2.3 Operating business segments
- 7.2.4 Product portfolio
- 7.2.5 Business performance
- 7.2.6 Key strategic moves and developments
- 7.3 ATPI LTD.
- 7.3.1 Company overview
- 7.3.2 Company snapshot
- 7.3.3 Operating business segments
- 7.3.4 Product portfolio
- 7.3.5 Business performance
- 7.3.6 Key strategic moves and developments
- 7.4 BCD GROUP (BCD MEETINGS & EVENTS)
- 7.4.1 Company overview
- 7.4.2 Company snapshot
- 7.4.3 Operating business segments
- 7.4.4 Product portfolio
- 7.4.5 Business performance
- 7.4.6 Key strategic moves and developments
- 7.5 BI Worldwide
- 7.5.1 Company overview
- 7.5.2 Company snapshot
- 7.5.3 Operating business segments
- 7.5.4 Product portfolio
- 7.5.5 Business performance
- 7.5.6 Key strategic moves and developments
- 7.6 Carlson Wagonlit Travel (CWT Meetings & Events)
- 7.6.1 Company overview
- 7.6.2 Company snapshot
- 7.6.3 Operating business segments
- 7.6.4 Product portfolio
- 7.6.5 Business performance
- 7.6.6 Key strategic moves and developments
- 7.7 CIEVENTS
- 7.7.1 Company overview
- 7.7.2 Company snapshot
- 7.7.3 Operating business segments
- 7.7.4 Product portfolio
- 7.7.5 Business performance
- 7.7.6 Key strategic moves and developments
- 7.8 Conference Care Ltd.
- 7.8.1 Company overview
- 7.8.2 Company snapshot
- 7.8.3 Operating business segments
- 7.8.4 Product portfolio
- 7.8.5 Business performance
- 7.8.6 Key strategic moves and developments
- 7.9 Creative Group, Inc.
- 7.9.1 Company overview
- 7.9.2 Company snapshot
- 7.9.3 Operating business segments
- 7.9.4 Product portfolio
- 7.9.5 Business performance
- 7.9.6 Key strategic moves and developments
- 7.10 CSI DMC
- 7.10.1 Company overview
- 7.10.2 Company snapshot
- 7.10.3 Operating business segments
- 7.10.4 Product portfolio
- 7.10.5 Business performance
- 7.10.6 Key strategic moves and developments
- 7.11 IBTM
- 7.11.1 Company overview
- 7.11.2 Company snapshot
- 7.11.3 Operating business segments
- 7.11.4 Product portfolio
- 7.11.5 Business performance
- 7.11.6 Key strategic moves and developments
- 7.12 ITA Group
- 7.12.1 Company overview
- 7.12.2 Company snapshot
- 7.12.3 Operating business segments
- 7.12.4 Product portfolio
- 7.12.5 Business performance
- 7.12.6 Key strategic moves and developments
- 7.13 MARITZ
- 7.13.1 Company overview
- 7.13.2 Company snapshot
- 7.13.3 Operating business segments
- 7.13.4 Product portfolio
- 7.13.5 Business performance
- 7.13.6 Key strategic moves and developments
- 7.14 Meetings & Incentives Worldwide, Inc.
- 7.14.1 Company overview
- 7.14.2 Company snapshot
- 7.14.3 Operating business segments
- 7.14.4 Product portfolio
- 7.14.5 Business performance
- 7.14.6 Key strategic moves and developments
- 7.15 ONE10, LLC
- 7.15.1 Company overview
- 7.15.2 Company snapshot
- 7.15.3 Operating business segments
- 7.15.4 Product portfolio
- 7.15.5 Business performance
- 7.15.6 Key strategic moves and developments
- 7.16 The Freeman Company
- 7.16.1 Company overview
- 7.16.2 Company snapshot
- 7.16.3 Operating business segments
- 7.16.4 Product portfolio
- 7.16.5 Business performance
- 7.16.6 Key strategic moves and developments
- 7.17 The Interpublic Group of Companies, Inc.
- 7.17.1 Company overview
- 7.17.2 Company snapshot
- 7.17.3 Operating business segments
- 7.17.4 Product portfolio
- 7.17.5 Business performance
- 7.17.6 Key strategic moves and developments