|
|
市場調査レポート
商品コード
1157855
B2B Eコマースの世界市場、マーケットプレース、決済(2022年)Global B2B E-Commerce Market, Marketplaces and Payments 2022 |
||||||
| B2B Eコマースの世界市場、マーケットプレース、決済(2022年) |
|
出版日: 2022年11月15日
発行: yStats.com
ページ情報: 英文 143 Pages
納期: 即日から翌営業日
|
- 全表示
- 概要
- 目次
B2Bのeコマースプラットフォームの拡大が、2020年から2025年にかけてB2Bマーケットプレースと決済市場の成長を促進すると予測されています。
B2B eコマース市場は、2027年まで顕著な成長を遂げる見通しです。パンデミックに刺激され、B2Bバイヤーの間でオンライン購入の割合が世界で増加しています。この拡大に伴い、企業は新しい形態のB2B決済を受け入れるようになっています。金融機関や銀行、B2Bバイヤーとセラーは、バーチャルカード、電信送金、BNPL、暗号通貨など、より技術的に進んだ決済方法に徐々に傾斜しています。
当レポートでは、世界のB2B eコマース市場について調査し、マーケットプレース、決済に焦点を当て、市場の課題や動向、国別の市場分析などの情報を提供しています。
目次
第1章 マネジメントの概要
第2章 世界における展開
- B2B eコマース市場、マーケットプレイス、決済の概要と動向(2022年8月)
- オンラインとオフラインのB2B購入シェアの比較:パンデミック前・パンデミック後別、B2Bバイヤーの割合(2021年8月)
- オンラインとオフラインのチャネル介したB2Bバイヤーシェアの比較:購入タイプ別、B2Bバイヤーの割合(2021年8月)
- 注文に最も頻繁に使用されたチャネル、B2Bバイヤーの割合(2021年8月)
- 購入前に調査を行うことが好まれるチャネルの内訳、B2Bバイヤーの割合(2021年2月)
- B2Bバイヤーが実店舗に行く前にオンラインで検索する最も重要な情報、B2Bバイヤーの割合(2021年2月)
- B2B eコマースサイトを選択する際に考慮すべき要因、B2Bバイヤーの割合(2021年)
- B2Bウェブサイトトラフィックの内訳:デスクトップ・モバイル別の割合(2021年12月)
- バイヤーと販売者の間のB2Bインタラクションのシェア:チャネル別の割合(2025年)
- 過去にサプライヤーを切り替えたB2Bバイヤーシェアの割合(2021年)
- 購入プロセス中にB2Bバイヤーが直面する課題、B2Bバイヤーの割合(2021年8月)
- B2Bバイヤーが購入を調査する際に直面する主な課題5つ、B2Bバイヤーの割合(2020年、2021年)
- B2B eコマーステクノロジーへの投資の優先順位、B2Bバイヤーの割合(2021年)
- 2022年のB2B eコマースの上位動向:B2B専門家別、回答者の割合(2021年12月)
- 2022年のB2B eコマーステクノロジーへの主な投資:B2B専門家別、回答者の割合(2022年)
- 購入に優先するオンラインチャネル、B2Bバイヤーの割合(2021年2月)
- マーケットプレイスを介したB2B eコマースの販売高(2020年、2025年)
- マーケットプレイスを介したB2B eコマース販売シェアの割合
- 独自のマーケットプレイスを構築したB2B企業と構築を検討しないB2B企業シェアの比較、B2B企業の割合(2021年12月)
- Amazonビジネス B2B eコマースマーケットプレースプロファイル(2022年8月)
- Alibaba B2B eコマースマーケットプレースプロファイル(2022年8月)
- Mercateo B2B eコマースマーケットプレースプロファイル(2022年8月)
- B2Bバイヤーが要求する上位の決済オプション、B2Bバイヤーの割合(2021年)
- 総決済収益:タイプ別(2020、2025年、2030年)
- ホールセール決済の収益:プライマリー・セカンダリー別の内訳の割合(2020年、2025年、2030年)
- 越境決済取引額:B2B、B2C、C2B、C2C別(2020年~2022年)
- 越境B2B決済の取引額(2021年、2026年)、など
第3章 アジア太平洋
- 地域
- 中国
- 日本
- インド
- インドネシア
- タイ
第4章 北米
- 地域
- 米国
第5章 欧州
- 地域
- 英国
- ドイツ
- イタリア
第6章 ラテンアメリカ
- 地域
- ブラジル
第7章 中東とアフリカ
- 地域
"The expansion of B2B E-Commerce platforms is projected to drive the growth of B2B marketplaces and payments market between 2020 and 2025"": new yStats.com report.
The growth of third-party marketplaces such as Amazon Business along with new payment methods such as wire transfers, and virtual cards is changing the landscape of the B2B E-Commerce market
The B2B E-Commerce market is forecasted to see notable growth through 2027. Spurred by the pandemic, the share of online purchases among B2B buyers is increasing worldwide. With this expansion taking place, companies are accepting new forms of B2B payments. Financial institutions and banks, as well as B2B buyers and sellers are slowly inclining towards more technologically advanced payment methods such as virtual cards, wire transfers, buy now pay later as well as cryptocurrencies, as highlighted in the latest yStats.com report. The transaction value of virtual cards is forecasted to witness a significant CAGR between 2021 and 2026, thereby becoming a popular B2B payment method. Commercial cards such as virtual cards, corporate cards, and plastic purchasing cards are also anticipated to maintain a continuous growth in Latin America between 2021 and 2026. Not only is the B2B payment ecosystem undergoing a change but also the B2B E-Commerce marketplaces across various regions have started gaining momentum, with Amazon.com extending its capabilities to the B2B market after launching its subsidiary- Amazon Business in 2015, which focusses on the needs of the B2B market. With an increasing adoption of third-party marketplaces in the U.S. in 2021, Amazon business was the most preferred marketplace amongst B2B sellers to sell goods and services on, followed by eBay, Walmart, and Alibaba. Additionally, Amazon business is among the most utilized digital marketplaces by small and medium enterprises worldwide. The share of B2B E-Commerce sales coming via marketplaces is forecasted to rise worldwide, with Amazon Business also holding a notable amount of share in the U.S. market by 2025, as mentioned in the newyStats.com report.
Various other B2B E-Commerce marketplaces are seen mushrooming worldwide
With the share of B2B E-Commerce sales coming via marketplaces set to increase between 2020 and 2025, several other B2B E-Commerce marketplaces are seen connecting the B2B buyers and sellers worldwide. Globally, almost a quarter of B2B buyers used marketplaces to place an order as of August 2021. Although Amazon Business happens to hold a strong position as a digital B2B marketplace in several regions of the world, it is still yet to make its presence felt in the Asia-Pacific region, where China-based Alibaba dominates B2B E-Commerce marketplace sales, followed by DHGate.com and TradeIndia. Other regions, such as Latin America and MENA, witnessed a growth of several startups within the B2B E-Commerce market.
Table of Contents
1. Management Summary
2. Global Developments
- B2B E-Commerce Market, Marketplaces, and Payments Overview and Trends, August 2022
- Share of B2B Purchases Made Online vs. Offline, by Before the Pandemic and After the Pandemic, in % of B2B Buyers, August 2021
- Share of B2B Buyers Using Online vs. Offline Channels, by Type of Purchase, in % of B2B Buyers, August 2021
- Channels Used Most Frequently to Place an Order, in % of B2B Buyers, August 2021
- Breakdown of Channels Preferred to Conduct Research Before Buying, in % of B2B Buyers, February 2021
- Use of Online Channels for Research During Different Stages of the Purchasing Process, in % of B2B Buyers, August 2021
- Most Important Information that B2B Buyers Search Online Before Going to a Physical Store, in % of B2B Buyers, February 2021
- Factors Considered When Choosing a B2B E-Commerce Site, in % of B2B Buyers, 2021
- Breakdown of B2B Website Traffic, by Desktop and Mobile, in %, December 2021
- Share of B2B Interactions Between Buyers and Sellers, by Channels, in %, 2025f
- Share of B2B Buyers Who Switched Suppliers in the Past, in %, 2021e
- Top 3 Aspects to Improve Buyer Experience, in % of B2B Buyers, February 2021
- Share of B2B Buyers Who Faced Customer Experience Challenge During the Buying Process, in %, August 2021
- Challenges Faced by B2B Buyers During the Buying Process, in % of B2B Buyers, August 2021
- Top 5 Challenges That B2B Buyers Face During Researching Purchases, in % of B2B Buyers, 2020 & 2021
- Priorities for B2B E-Commerce Technology Investment, in % of B2B Sellers, 2021e
- Top B2B E-Commerce Trends for 2022 According to B2B Specialists, in % of Respondents, December 2021
- Top B2B E-Commerce Technology Investments for 2022 According to B2B Specialists, in % of Respondents, 2022e
- Preferred Online Channels for Purchase, in % of B2B buyers, February 2021
- B2B E-Commerce Sales via Marketplaces, in USD trillion, 2020 & 2025f
- Share of B2B E-Commerce Sales Made via Marketplaces, in %, 2020 & 2025f
- Share of B2B Companies That Have Built Their Own Marketplace vs Share of B2B Companies That Will Never Consider Building Their Own Marketplace, in % of B2B Companies, December 2021
- Amazon Business B2B E-Commerce Marketplace Profile, August 2022
- Alibaba B2B E-Commerce Marketplace Profile, August 2022
- Mercateo B2B E-Commerce Marketplace Profile, August 2022
- Top Payment Options Demanded by B2B Buyers, in % of B2B Buyers, 2021
- Total Payment Revenue, by Type, in USD trillion, 2020, 2025f, & 2030f
- Wholesale Payments Revenue, in USD billion, and Breakdown by Primary and Secondary, in %, 2020, 2025f, & 2030f
- Cross-Border Payment Transaction Value, by B2B, B2C, C2B and C2C, in USD trillion, 2020-2022f
- Transaction Value of Cross-Border B2B Payments, in USD trillion, 2021 & 2026f
- Share of Wire Transfer Payments, in % of Cross-Border B2B E-Commerce Transaction Value, 2021 & 2026f
- Top Payment Options That Corporates Would Plan to Increase Using in the Next 12 Months, in % of Firms, July 2021
- Top Digital Solutions That Financial Institutions Offer to Their Corporate Clients, in % of Financial Institutions, 2021
- Top Problem Areas for B2B Clients When Making Payments to Their Suppliers According to Financial Institutions, in % of Financial Institutions, 2021
- Top Accounts Payable Challenges Experienced When Paying Vendors, in % Business Respondents, July 2021
- Top Accounts Receivable Challenges Experienced When Receiving Payments From Vendors, in % of Business Respondents, July 2021
- Share of Firms Having a High Percentage of Overdue B2B Receivables, by Firm Size, in % of B2B Receivables, 2021e
- Share of Corporate Treasury Respondents for Whom Lack of Technology is a Major Challenge, in %, May 2021
- Top Challenges for Corporate Treasury Respondents Related to Implementing New Technology, in % of Respondents, May 2021
- Share of B2B Firms That Reported Serious Payment Fraud, in %, July 2021
- Share of Corporates That Indicate B2B Payment Solutions Are Very Important for Bank Selection, in %, 2021
- Share of Financial Institutions That Allow Their B2B Customers to Use Selected Digital Currencies, in %, 2021e
- Share of Financial Institutions That Plan to Expand And Provide Access to Cryptocurrency, in %, 2022e
3. Asia-Pacific
- 3.1. Regional
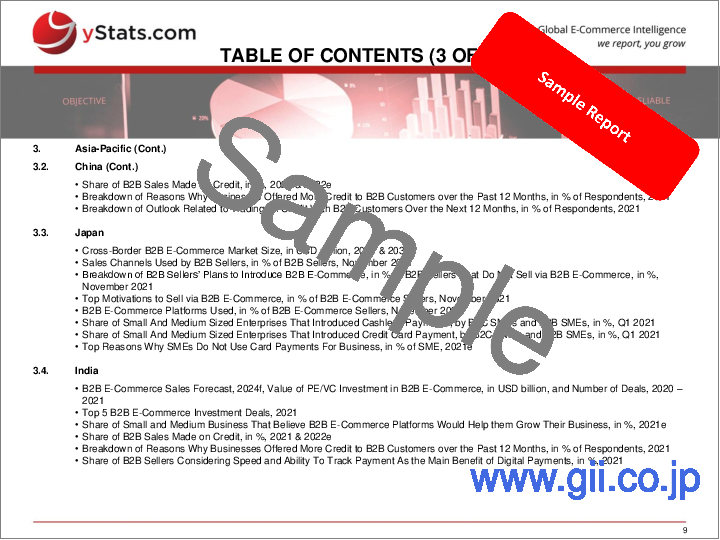
- Overview of Selected B2B E-Commerce Marketplaces, July 2022
- 3.2. China
- Cross-Border B2B E-Commerce Market Size, in CNY trillion & Y-O-Y in %, 2020-2025f
- Breakdown of Cross-Border E-Commerce Transactions by B2B and B2C, in %,
- Share of B2B Sales Made on Credit, in %, 2021 & 2022e
- Breakdown of Reasons Why Businesses Offered More Credit to B2B Customers over the Past 12 Months, in % of Respondents, 2021
- Breakdown of Outlook Related to Trading on Credit With B2B Customers Over the Next 12 Months, in % of Respondents, 2021
- 3.3. Japan
- Cross-Border B2B E-Commerce Market Size, in USD million, 2020 & 2030f
- Sales Channels Used by B2B Sellers, in % of B2B Sellers, November 2021
- Breakdown of B2B Sellers' Plans to Introduce B2B E-Commerce, in % of B2B Sellers That Do Not Sell via B2B E-Commerce, in %, November 2021
- Top Motivations to Sell via B2B E-Commerce, in % of B2B E-Commerce Sellers, November 2021
- B2B E-Commerce Platforms Used, in % of B2B E-Commerce Sellers, November 2021
- Share of Small And Medium Sized Enterprises That Introduced Cashless Payments, by B2C SMEs and B2B SMEs, in %, Q1 2021
- Share of Small And Medium Sized Enterprises That Introduced Credit Card Payment, by B2C SMEs and B2B SMEs, in %, Q1 2021
- Top Reasons Why SMEs Do Not Use Card Payments For Business, in % of SME, 2021e
- 3.4. India
- B2B E-Commerce Sales Forecast, 2024f, Value of PE/VC Investment in B2B E-Commerce, in USD billion, and Number of Deals, 2020 - 2021
- Top 5 B2B E-Commerce Investment Deals, 2021
- Share of Small and Medium Business That Believe B2B E-Commerce Platforms Would Help them Grow Their Business, in %, 2021e
- Share of B2B Sales Made on Credit, in %, 2021 & 2022e
- Breakdown of Reasons Why Businesses Offered More Credit to B2B Customers over the Past 12 Months, in % of Respondents, 2021
- Share of B2B Sellers Considering Speed and Ability To Track Payment As the Main Benefit of Digital Payments, in %, 2021
- 3.5. Indonesia
- Share of B2B E-Commerce, in % of Overall E-Commerce, 2022e
- 3.6. Thailand
- E-Commerce Sales, by B2B, B2C and B2G, in USD billion, 2020 & 2021e
4. North America
- 4.1. Regional
- Overview of Selected B2B E-Commerce Marketplaces, July 2022
- 4.2. USA
- B2B E-Commerce Sales, in USD trillion, 2020 & 2021
- Total B2B E-Commerce Sales and EDI Sales, in USD trillion, 2019-2021
- B2B E-Commerce Sales, in USD billion, and Y-O-Y Change, in %, 2021-2025f
- Breakdown of Total B2B Sales by B2B E-Commerce, EDI and Offline, in %, 2022e & 2027f
- Share of Business Buyers Attracted to B2B E-Commerce Sites Due to Excellent User Experience, in %, 2021
- Breakdown of Maximum Order Value Brought Through Digital Self-Service and Remote Human Interactions for a New Product or Service, in % B2B Customers, November 2021
- Top Marketplaces That B2B Sellers Use to Sell Their Products, in % of B2B Decision Makers, June 2021
- B2B E-Commerce Marketplace Sales, in USD billion, 2020 & 2021
- Marketplaces Share of Total B2B E-Commerce Sales, in %, 2022e
- Top Payment Methods Accepted by B2B Companies, in % of B2B Companies, August 2021
- B2B Payment Transaction Value, by Payment Method, in USD billion, 2019-2022f
- B2B Payments Value, in USD trillion, and Year-on-Year Change, in %, 2019-2022e
- Share of B2B Payments Made via Checks, in %, 2021
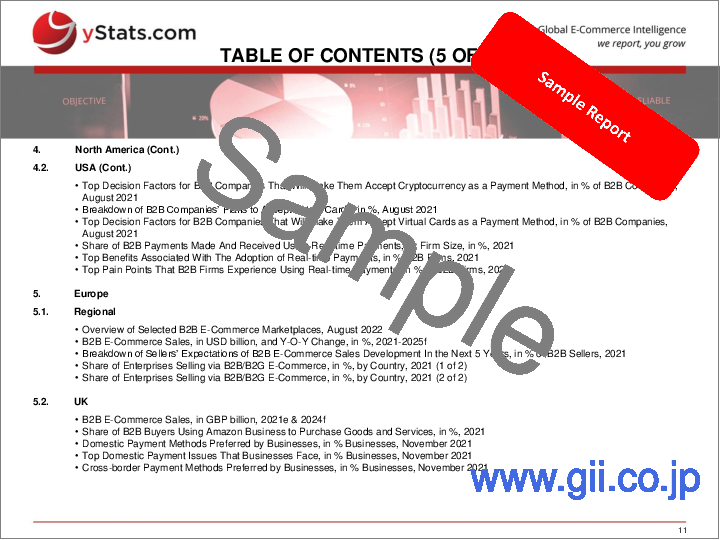
- Breakdown of B2B Companies' Plans Relating to Their Acceptance of Cryptocurrency as a Payment Method, in %, August 2021
- Breakdown of B2B Companies' Interest in Accepting Cryptocurrency as a Payment Method, in %, August 2021
- Top Decision Factors for B2B Companies That Will Make Them Accept Cryptocurrency as a Payment Method, in % of B2B Companies, August 2021
- Breakdown of B2B Companies' Plans to Accept Virtual Cards, in %, August 2021
- Top Decision Factors for B2B Companies That Will Make Them Accept Virtual Cards as a Payment Method, in % of B2B Companies, August 2021
- Share of B2B Payments Made And Received Using Real-time Payments, by Firm Size, in %, 2021
- Top Benefits Associated With The Adoption of Real-time Payments, in % B2B Firms, 2021
- Top Pain Points That B2B Firms Experience Using Real-time Payments, in % of B2B Firms, 2021
5. Europe
- 5.1. Regional
- Overview of Selected B2B E-Commerce Marketplaces, August 2022
- B2B E-Commerce Sales, in USD billion, and Y-O-Y Change, in %, 2021-2025f
- Breakdown of Sellers' Expectations of B2B E-Commerce Sales Development In the Next 5 Years, in % of B2B Sellers, 2021
- Share of Enterprises Selling via B2B/B2G E-Commerce, in %, by Country, 2021 (1 of 2)
- Share of Enterprises Selling via B2B/B2G E-Commerce, in %, by Country, 2021 (2 of 2)
- 5.2. UK
- B2B E-Commerce Sales, in GBP billion, 2021e & 2024f
- Share of B2B Buyers Using Amazon Business to Purchase Goods and Services, in %, 2021
- Domestic Payment Methods Preferred by Businesses, in % Businesses, November 2021
- Top Domestic Payment Issues That Businesses Face, in % Businesses, November 2021
- Cross-border Payment Methods Preferred by Businesses, in % Businesses, November 2021
- Top Cross-border Payment Issues That Businesses Face, in % Businesses, November 2021
- Traditional B2B Payment Options Used by Businesses, in %, November 2021
- Share of Businesses Using Modern B2B Payment Options, in %, November 2021
- 5.3. Germany
- B2B Sales Channels Used, in % of B2B Sellers, July 2021
- Top 5 Payment Methods in B2B vs. B2C E-Commerce, September 2021
- 5.4. Italy
- B2B E-Commerce Sales, in EUR billion, 2020 & 2021
- B2B E-Commerce Exports, in EUR billion, 2020 & 2021
- Payment Methods Used in B2B Payments, in % of Large Businesses and SMEs, 2021
- Share of B2B Companies Thinking of Adopting Innovative Payment Methods, by Large Businesses and SMEs, in %, 2021
- Share of B2B Companies That Activated Digital Channels to Manage Orders and Transactions, in % of Companies, 2021
6. Latin America
- 6.1. Regional
- Commercial Credit Card Spending, in USD billion, by Card Type, 2021-2026f
- 6.2. Brazil
- Overview of Selected B2B E-Commerce Marketplaces in Latin America, July 2022
- Interactions B2B Buyers with Digital Platforms, in %, April 2022
- Top 3 Most Used B2B Purchasing Channels, in % of B2B Buyers, April 2022
- Share of B2B Buyers Whose Expectations Are Not Met by B2B E-Commerce Sellers, in %, April 2022
- Top Reasons for Dissatisfaction of B2B Buyers, in % of B2B Buyers, April 2022
7. Middle East and Africa
- 7.1. Regional
- Overview of Selected B2B E-Commerce Marketplaces in MENA, July 2022
- Selected B2B E-Commerce Marketplaces, incl. Country, Total Funding, in USD million, Number of Products, Retailers and Suppliers, October 2021
- Share of Orders Placed Via B2B E-Commerce Marketplaces, in % of B2B Buyers, January 2021
- Share of Business Executives Who Believed That Businesses Would Use B2B E-Commerce More Often in the Future, in %, January 2021
- Overview of Selected B2B E-Commerce Marketplaces in Africa, July 2022


