|
|
市場調査レポート
商品コード
1535279
ホウ素市場:市場規模・予測、世界・地域シェア、動向、成長機会分析レポート対象:誘導体別、最終用途産業別、地域別Boron Market Size and Forecast, Global and Regional Share, Trend, and Growth Opportunity Analysis Report Coverage: By Derivative, End-Use Industry, and Geography |
||||||
|
|||||||
|
|||||||

| ホウ素市場:市場規模・予測、世界・地域シェア、動向、成長機会分析レポート対象:誘導体別、最終用途産業別、地域別 |
|
出版日: 2024年07月26日
発行: The Insight Partners
ページ情報: 英文 198 Pages
納期: 即納可能
|

全表示
- 概要
- 図表
- 目次
ホウ素の市場規模は2023年に56億4,000万米ドルと評価され、2031年には76億5,000万米ドルに達すると予想され、2023年から2031年までのCAGRは3.9%と推定されます。
万能元素であるホウ素は、ガラスやセラミック、農業、洗剤、断熱材、ハイテク電子機器の製造に不可欠です。アジア太平洋地域は、中国、インド、日本などの主要国における急速な工業化と堅調な経済拡大に後押しされ、主要消費国として際立っています。農業では、ホウ素は植物の発育に不可欠で、作物の収量と品質を大幅に向上させるため、肥料に広く使用されています。建設分野、特に新興経済国では、ホウケイ酸ガラスとセラミック・タイルが、その耐久性と耐熱性により不可欠な材料となっています。
誘導体別では、ホウ素市場はホウ砂、ホウ酸、窒化ホウ素、炭化ホウ素、酸化ホウ素、その他に区分されます。酸化ホウ素セグメントは、2023年から2031年にかけてホウ素市場で最も高いCAGRを記録すると予想されます。酸化ホウ素(三酸化二ホウ素)は、溶融炉でホウ砂を硫酸で処理することによって作られます。酸化ホウ素セグメントは、研磨剤、耐火物、セラミックス、その他の高性能用途での使用により、著しい成長を遂げています。酸化ホウ素は、殺虫剤、ホウ素化合物製造の前駆体、ガラスのフラックス剤、窒化ホウ素セラミックスの熱間静水圧プレスにおける接合剤として使用されます。電子機器需要の増加と再生可能エネルギー分野の進歩も、酸化ホウ素セグメントの成長に寄与しています。酸化ホウ素は、半導体や太陽電池のドーパントの製造に使用されます。
市場は最終用途産業別に、農薬、ガラス、セラミックス、洗剤、医薬品、電気・電子機器、その他に区分されます。2023年のホウ素市場では、ガラスセグメントが最大のシェアを占めています。ホウ素は、高い耐久性、耐熱性、化学的安定性で知られるホウケイ酸ガラスの製造に使用されます。ガラスメーカーは、熱膨張を制御し、溶融温度と粘度を下げ、ガラスの結晶化と脱硝を抑制するために、シリカベースに5~20%のホウ酸塩を組み込んでいます。ホウ酸塩は、ホウケイ酸ガラス、断熱ガラス繊維、超極細ガラス繊維、繊維ガラス、ディスプレイ用ガラス、特殊ガラスなど様々なガラス製品に使用されています。断熱ガラス繊維材料は、建設産業で使用される主要な材料です。
ホウ素市場では、アジア太平洋地域が2023年から2031年にかけて最も高いCAGRを記録すると予想されています。この地域には、インド、中国、日本などの主要な農薬生産者が存在します。アジア太平洋地域には、ガラス産業において少数の大手企業と多くの小規模企業が存在します。2022年4月、日本のガラスメーカーAGCは、さまざまな建築要件に対応する建築物一体型PVパネルを開発しました。通常のガラスが設置できるファサード、カーテンウォール、キャノピーに設置できます。ホウ素で作られたホウケイ酸ガラスは、他の種類のガラスよりも透明度が高く、太陽光の透過率が高いため、ソーラーパネルメーカーにとって好ましい選択肢となっています。このような市場開拓は、アジア太平洋におけるホウ素市場の成長を後押ししています。
アジア太平洋地域のホウ素市場は、農家の間で作物保護化学物質に対する意識が高まっていること、政府の補助金、人口の増加、食糧需要の高まりによって突出しています。農業では、ホウ素を他の肥料と混ぜたり、水に溶かしたり、作物や土壌に直接散布したり、灌漑用水を通して使用します。優れた農産物に対する需要の急増と、高い生産性と収量に対するニーズの高まりが、アジア太平洋、特に中国、日本、インドでのホウ素の使用を後押しすると予想されます。
ホウ素は、ガラス・セラミックス、洗剤、農薬、電子機器、医薬品など、さまざまな最終用途産業で使用されています。これらの産業はホウ素の最大の消費者であり、ガラスやセラミックの耐久性、耐熱性、透明性を高めるという特性から使用されています。肥料メーカーは、作物の収量を向上させるためにホウ素を製品に組み込んでいます。ホウ素化合物は、その美白および染み抜き特性により、家庭用および工業用クリーニング製品の製造に使用されます。高純度のホウ素は、半導体やその他の電子部品の製造に使われます。エンドユーザーは、高品質の製品の安定供給を確保するために、ホウ素メーカーと長期的な関係を維持しています。
世界のホウ素市場で活動している企業には、Rio Tinto Group、AbEti Products Oy、Hoganas AB、日本電工株式会社、Saint Gobain、3M、Stella Chemifa Corp、UBE Corp、Boron Specialties LLCなどがあります。世界のホウ素市場で活動するプレーヤーは、顧客の需要を満たすために高品質の製品を提供することに重点を置いています。また、顧客のために高品質な新製品を発売することにも注力しています。
世界のホウ素市場全体の規模は、一次情報と二次情報の両方を用いて導き出されています。調査プロセスを開始するにあたり、市場に関連する質的・量的情報を入手するため、社内外の情報源を用いて徹底的な二次調査を実施しました。また、データを検証し、トピックに関するより分析的な洞察を得るために、業界関係者に複数の一次インタビューを実施しました。このプロセスの参入企業には、副社長、市場開拓マネージャー、マーケットインテリジェンスマネージャー、国内営業マネージャーなどの業界専門家と、ホウ素市場を専門とする評価専門家、調査アナリスト、キーオピニオンリーダーなどの外部コンサルタントが含まれます。
目次
第1章 イントロダクション
第2章 エグゼクティブサマリー
- 主要洞察
- 市場の魅力
第3章 調査手法
- 2次調査
- 1次調査
- 仮説の策定
- マクロ経済要因分析
- 基礎数値の作成
- データの三角測量
- 国レベルのデータ
第4章 ホウ素市場の情勢
- ポーターのファイブフォース分析
- 供給企業の交渉力
- 買い手の交渉力
- 新規参入業者の脅威
- 競争企業間の敵対関係
- 代替品の脅威
- エコシステム分析
- 原材料サプライヤー
- ホウ素メーカー
- 流通業者
- 最終用途産業
- バリューチェーンのベンダー一覧
第5章 ホウ素市場:主要市場力学
- ホウ素市場:主要市場力学
- 市場促進要因
- ガラス・セラミックス産業の成長
- 農薬産業からの需要急増
- 市場抑制要因
- ホウ素価格の変動
- 市場機会
- 航空宇宙・防衛産業への投資拡大
- 今後の動向
- いくつかの産業におけるホウ素ナノ粒子の利用急増
- 促進要因と抑制要因の影響
第6章 ホウ素市場-世界市場分析
- ホウ素市場の数量、2021年~2031年
- ホウ素市場の数量予測・分析
- ホウ素市場の収益、2021年~2031年
- ホウ素市場の収益予測・分析
第7章 ホウ素市場の数量・収益分析:誘導体別
- ホウ砂
- ホウ酸
- 窒化ホウ素
- 炭化ホウ素
- 酸化ホウ素
- その他
第8章 ホウ素市場の収益分析:最終用途産業別
- 農薬
- ガラス
- セラミックス
- 洗剤
- 医薬品
- 電気・電子機器
- その他
第9章 ホウ素市場:地域別分析
- 北米
- 米国
- カナダ
- メキシコ
- 欧州
- ドイツ
- フランス
- イタリア
- 英国
- ロシア
- その他欧州
- アジア太平洋
- オーストラリア
- 中国
- インド
- 日本
- 韓国
- その他アジア太平洋
- 中東・アフリカ
- 南アフリカ
- サウジアラビア
- アラブ首長国連邦
- その他中東・アフリカ
- 中南米
- ブラジル
- アルゼンチン
- その他中南米
第10章 競合情勢
- 主要企業によるヒートマップ分析
- 企業のポジショニングと集中度
第11章 業界情勢
- コラボレーション
- 市場イニシアティブ
第12章 企業プロファイル
- Nippon Denko Co., Ltd.
- Hoganas AB
- 3M Co
- UBE Corporation
- Arkema SA
- JFE Mineral & Alloy Co Ltd
- Tokyo Chemical Industry Co Ltd
- Rio Tinto Ltd
- Compagnie de Saint Gobain SA
- Eti Maden
- Stella Chemifa Corporation
- FREEMAN(JAPAN)CO., LTD.
- KROSAKI HARIMA CORPORATION
- Washington Mills Electro Minerals Limited
- Boron Specialties, LLC
第13章 付録
List Of Tables
- Table 1. Boron Market Segmentation
- Table 2. List of Vendors
- Table 3. Boron Market - Volume and Forecast to 2031 (Kilo Tons)
- Table 4. Boron Market - Revenue and Forecast to 2031 (US$ Million)
- Table 5. Boron Market - Volume and Forecast to 2031 (Kilo Tons) - by Derivatives
- Table 6. Boron Market - Revenue and Forecast to 2031 (US$ Million) - by Derivatives
- Table 7. Boron Market - Revenue and Forecast to 2031 (US$ Million) - by End-use Industry
- Table 8. North America Boron Market - Volume and Forecast to 2031 (Kilo Tons) - by Derivatives
- Table 9. North America Boron Market - Revenue and Forecast to 2031 (US$ Million) - by Derivatives
- Table 10. North America Boron Market - Revenue and Forecast to 2031 (US$ Million) - by End-use Industry
- Table 11. North America Boron Market - Volume and Forecast to 2031 (Kilo Tons) - by Country
- Table 12. North America Boron Market - Revenue and Forecast to 2031 (US$ Million) - by Country
- Table 13. United States Boron Market - Volume and Forecast to 2031 (Kilo Tons) - by Derivatives
- Table 14. United States Boron Market - Revenue and Forecast to 2031 (US$ Million) - by Derivatives
- Table 15. United States Boron Market - Revenue and Forecast to 2031 (US$ Million) - by End-use Industry
- Table 16. Canada Boron Market - Volume and Forecast to 2031 (Kilo Tons) - by Derivatives
- Table 17. Canada Boron Market - Revenue and Forecast to 2031 (US$ Million) - by Derivatives
- Table 18. Canada Boron Market - Revenue and Forecast to 2031 (US$ Million) - by End-use Industry
- Table 19. Mexico Boron Market - Volume and Forecast to 2031 (Kilo Tons) - by Derivatives
- Table 20. Mexico Boron Market - Revenue and Forecast to 2031 (US$ Million) - by Derivatives
- Table 21. Mexico Boron Market - Revenue and Forecast to 2031 (US$ Million) - by End-use Industry
- Table 22. Europe Boron Market - Volume and Forecast to 2031 (Kilo Tons) - by Derivatives
- Table 23. Europe Boron Market - Revenue and Forecast to 2031 (US$ Million) - by Derivatives
- Table 24. Europe Boron Market - Revenue and Forecast to 2031 (US$ Million) - by End-use Industry
- Table 25. Europe Boron Market - Volume and Forecast to 2031 (Kilo Tons) - by Country
- Table 26. Europe Boron Market - Revenue and Forecast to 2031 (US$ Million) - by Country
- Table 27. Germany Boron Market - Volume and Forecast to 2031 (Kilo Tons) - by Derivatives
- Table 28. Germany Boron Market - Revenue and Forecast to 2031 (US$ Million) - by Derivatives
- Table 29. Germany Boron Market - Revenue and Forecast to 2031 (US$ Million) - by End-use Industry
- Table 30. France Boron Market - Volume and Forecast to 2031 (Kilo Tons) - by Derivatives
- Table 31. France Boron Market - Revenue and Forecast to 2031 (US$ Million) - by Derivatives
- Table 32. France Boron Market - Revenue and Forecast to 2031 (US$ Million) - by End-use Industry
- Table 33. Italy Boron Market - Volume and Forecast to 2031 (Kilo Tons) - by Derivatives
- Table 34. Italy Boron Market - Revenue and Forecast to 2031 (US$ Million) - by Derivatives
- Table 35. Italy Boron Market - Revenue and Forecast to 2031 (US$ Million) - by End-use Industry
- Table 36. United Kingdom Boron Market - Volume and Forecast to 2031 (Kilo Tons) - by Derivatives
- Table 37. United Kingdom Boron Market - Revenue and Forecast to 2031 (US$ Million) - by Derivatives
- Table 38. United Kingdom Boron Market - Revenue and Forecast to 2031 (US$ Million) - by End-use Industry
- Table 39. Russia Boron Market - Volume and Forecast to 2031 (Kilo Tons) - by Derivatives
- Table 40. Russia Boron Market - Revenue and Forecast to 2031 (US$ Million) - by Derivatives
- Table 41. Russia Boron Market - Revenue and Forecast to 2031 (US$ Million) - by End-use Industry
- Table 42. Rest of Europe Boron Market - Volume and Forecast to 2031 (Kilo Tons) - by Derivatives
- Table 43. Rest of Europe Boron Market - Revenue and Forecast to 2031 (US$ Million) - by Derivatives
- Table 44. Rest of Europe Boron Market - Revenue and Forecast to 2031 (US$ Million) - by End-use Industry
- Table 45. Asia Pacific Boron Market - Volume and Forecast to 2031 (Kilo Tons) - by Derivatives
- Table 46. Asia Pacific Boron Market - Revenue and Forecast to 2031 (US$ Million) - by Derivatives
- Table 47. Asia Pacific Boron Market - Revenue and Forecast to 2031 (US$ Million) - by End-use Industry
- Table 48. Asia Pacific Boron Market - Volume and Forecast to 2031 (Kilo Tons) - by Country
- Table 49. Asia Pacific Boron Market - Revenue and Forecast to 2031 (US$ Million) - by Country
- Table 50. Australia Boron Market - Volume and Forecast to 2031 (Kilo Tons) - by Derivatives
- Table 51. Australia Boron Market - Revenue and Forecast to 2031 (US$ Million) - by Derivatives
- Table 52. Australia Boron Market - Revenue and Forecast to 2031 (US$ Million) - by End-use Industry
- Table 53. China Boron Market - Volume and Forecast to 2031 (Kilo Tons) - by Derivatives
- Table 54. China Boron Market - Revenue and Forecast to 2031 (US$ Million) - by Derivatives
- Table 55. China Boron Market - Revenue and Forecast to 2031 (US$ Million) - by End-use Industry
- Table 56. India Boron Market - Volume and Forecast to 2031 (Kilo Tons) - by Derivatives
- Table 57. India Boron Market - Revenue and Forecast to 2031 (US$ Million) - by Derivatives
- Table 58. India Boron Market - Revenue and Forecast to 2031 (US$ Million) - by End-use Industry
- Table 59. Japan Boron Market - Volume and Forecast to 2031 (Kilo Tons) - by Derivatives
- Table 60. Japan Boron Market - Revenue and Forecast to 2031 (US$ Million) - by Derivatives
- Table 61. Japan Boron Market - Revenue and Forecast to 2031 (US$ Million) - by End-use Industry
- Table 62. South Korea Boron Market - Volume and Forecast to 2031 (Kilo Tons) - by Derivatives
- Table 63. South Korea Boron Market - Revenue and Forecast to 2031 (US$ Million) - by Derivatives
- Table 64. South Korea Boron Market - Revenue and Forecast to 2031 (US$ Million) - by End-use Industry
- Table 65. Rest of APAC Boron Market - Volume and Forecast to 2031 (Kilo Tons) - by Derivatives
- Table 66. Rest of APAC Boron Market - Revenue and Forecast to 2031 (US$ Million) - by Derivatives
- Table 67. Rest of APAC Boron Market - Revenue and Forecast to 2031 (US$ Million) - by End-use Industry
- Table 68. Middle East and Africa Boron Market - Volume and Forecast to 2031 (Kilo Tons) - by Derivatives
- Table 69. Middle East and Africa Boron Market - Revenue and Forecast to 2031 (US$ Million) - by Derivatives
- Table 70. Middle East and Africa Boron Market - Revenue and Forecast to 2031 (US$ Million) - by End-use Industry
- Table 71. Middle East and Africa Boron Market - Volume and Forecast to 2031 (Kilo Tons) - by Country
- Table 72. Middle East and Africa Boron Market - Revenue and Forecast to 2031 (US$ Million) - by Country
- Table 73. South Africa Boron Market - Volume and Forecast to 2031 (Kilo Tons) - by Derivatives
- Table 74. South Africa Boron Market - Revenue and Forecast to 2031 (US$ Million) - by Derivatives
- Table 75. South Africa Boron Market - Revenue and Forecast to 2031 (US$ Million) - by End-use Industry
- Table 76. Saudi Arabia Boron Market - Volume and Forecast to 2031 (Kilo Tons) - by Derivatives
- Table 77. Saudi Arabia Boron Market - Revenue and Forecast to 2031 (US$ Million) - by Derivatives
- Table 78. Saudi Arabia Boron Market - Revenue and Forecast to 2031 (US$ Million) - by End-use Industry
- Table 79. United Arab Emirates Boron Market - Volume and Forecast to 2031 (Kilo Tons) - by Derivatives
- Table 80. United Arab Emirates Boron Market - Revenue and Forecast to 2031 (US$ Million) - by Derivatives
- Table 81. United Arab Emirates Boron Market - Revenue and Forecast to 2031 (US$ Million) - by End-use Industry
- Table 82. Rest of Middle East and Africa Boron Market - Volume and Forecast to 2031 (Kilo Tons) - by Derivatives
- Table 83. Rest of Middle East and Africa Boron Market - Revenue and Forecast to 2031 (US$ Million) - by Derivatives
- Table 84. Rest of Middle East and Africa Boron Market - Revenue and Forecast to 2031 (US$ Million) - by End-use Industry
- Table 85. South and Central America Boron Market - Volume and Forecast to 2031 (Kilo Tons) - by Derivatives
- Table 86. South and Central America Boron Market - Revenue and Forecast to 2031 (US$ Million) - by Derivatives
- Table 87. South and Central America Boron Market - Revenue and Forecast to 2031 (US$ Million) - by End-use Industry
- Table 88. South and Central America Boron Market - Volume and Forecast to 2031 (Kilo Tons) - by Country
- Table 89. South and Central America Boron Market - Revenue and Forecast to 2031 (US$ Million) - by Country
- Table 90. Brazil Boron Market - Volume and Forecast to 2031 (Kilo Tons) - by Derivatives
- Table 91. Brazil Boron Market - Revenue and Forecast to 2031 (US$ Million) - by Derivatives
- Table 92. Brazil Boron Market - Revenue and Forecast to 2031 (US$ Million) - by End-use Industry
- Table 93. Argentina Boron Market - Volume and Forecast to 2031 (Kilo Tons) - by Derivatives
- Table 94. Argentina Boron Market - Revenue and Forecast to 2031 (US$ Million) - by Derivatives
- Table 95. Argentina Boron Market - Revenue and Forecast to 2031 (US$ Million) - by End-use Industry
- Table 96. Rest of South and Central America Boron Market - Volume and Forecast to 2031 (Kilo Tons) - by Derivatives
- Table 97. Rest of South and Central America Boron Market - Revenue and Forecast to 2031 (US$ Million) - by Derivatives
- Table 98. Rest of South and Central America Boron Market - Revenue and Forecast to 2031 (US$ Million) - by End-use Industry
List Of Figures
- Figure 1. Boron Market Segmentation, by Geography
- Figure 2. Porter's Five Forces Analysis
- Figure 3. Ecosystem Analysis: Boron Market
- Figure 4. Impact Analysis of Drivers and Restraints
- Figure 5. Boron Market Volume (Kilo Tons), 2021-2031
- Figure 6. Boron Market Revenue (US$ Million), 2021-2031
- Figure 7. Boron Market Share (%) - Derivatives, 2023 and 2031
- Figure 8. Borax: Boron Market - Volume and Forecast to 2031 (Kilo Tons)
- Figure 9. Borax: Boron Market - Revenue and Forecast to 2031 (US$ Million)
- Figure 10. Boric Acid: Boron Market - Volume and Forecast to 2031 (Kilo Tons)
- Figure 11. Boric Acid: Boron Market - Revenue and Forecast to 2031 (US$ Million)
- Figure 12. Boron Nitride: Boron Market - Volume and Forecast to 2031 (Kilo Tons)
- Figure 13. Boron Nitride: Boron Market - Revenue and Forecast to 2031 (US$ Million)
- Figure 14. Boron Carbide: Boron Market - Volume and Forecast to 2031 (Kilo Tons)
- Figure 15. Boron Carbide: Boron Market - Revenue and Forecast to 2031 (US$ Million)
- Figure 16. Boron Oxide: Boron Market - Volume and Forecast to 2031 (Kilo Tons)
- Figure 17. Boron Oxide: Boron Market - Revenue and Forecast to 2031 (US$ Million)
- Figure 18. Others: Boron Market - Volume and Forecast to 2031 (Kilo Tons)
- Figure 19. Others: Boron Market - Revenue and Forecast to 2031 (US$ Million)
- Figure 20. Boron Market Share (%) - End-use Industry, 2023 and 2031
- Figure 21. Agrochemicals: Boron Market - Revenue and Forecast to 2031 (US$ Million)
- Figure 22. Glass: Boron Market - Revenue and Forecast to 2031 (US$ Million)
- Figure 23. Ceramics: Boron Market - Revenue and Forecast to 2031 (US$ Million)
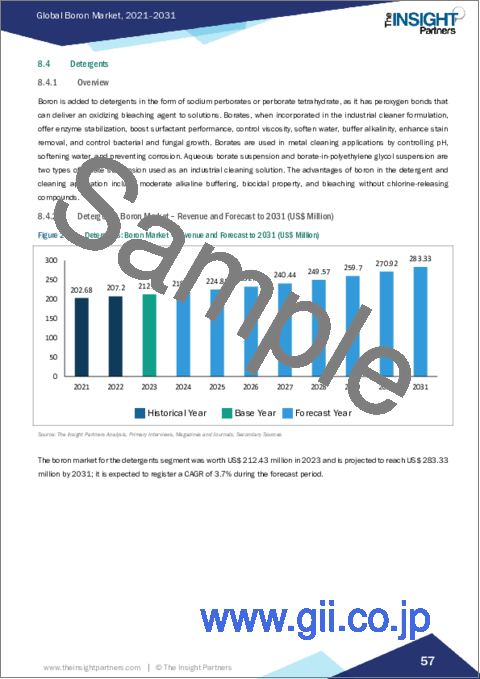
- Figure 24. Detergents: Boron Market - Revenue and Forecast to 2031 (US$ Million)
- Figure 25. Pharmaceuticals: Boron Market - Revenue and Forecast to 2031 (US$ Million)
- Figure 26. Electrical and Electronics: Boron Market - Revenue and Forecast to 2031 (US$ Million)
- Figure 27. Others: Boron Market - Revenue and Forecast to 2031 (US$ Million)
- Figure 28. Boron Market Breakdown by Region, 2023 and 2031 (%)
- Figure 29. North America Boron Market - Volume and Forecast to 2031 (Kilo Tons)
- Figure 30. North America Boron Market - Revenue and Forecast to 2031 (US$ Million)
- Figure 31. North America Boron Market Breakdown by Derivatives (2023 and 2031)
- Figure 32. North America Boron Market Breakdown by End-use Industry (2023 and 2031)
- Figure 33. North America Boron Market Breakdown by Key Countries, 2023 and 2031 (%)
- Figure 34. United States Boron Market - Revenue and Forecast to 2031 (US$ Million)
- Figure 35. Canada Boron Market - Revenue and Forecast to 2031 (US$ Million)
- Figure 36. Mexico Boron Market - Revenue and Forecast to 2031 (US$ Million)
- Figure 37. Europe Boron Market - Volume and Forecast to 2031 (Kilo Tons)
- Figure 38. Europe Boron Market - Revenue and Forecast to 2031 (US$ Million)
- Figure 39. Europe Boron Market Breakdown by Derivatives (2023 and 2031)
- Figure 40. Europe Boron Market Breakdown by End-use Industry (2023 and 2031)
- Figure 41. Europe Boron Market Breakdown by Key Countries, 2023 and 2031 (%)
- Figure 42. Germany Boron Market - Revenue and Forecast to 2031 (US$ Million)
- Figure 43. France Boron Market - Revenue and Forecast to 2031 (US$ Million)
- Figure 44. Italy Boron Market - Revenue and Forecast to 2031 (US$ Million)
- Figure 45. United Kingdom Boron Market - Revenue and Forecast to 2031 (US$ Million)
- Figure 46. Russia Boron Market - Revenue and Forecast to 2031 (US$ Million)
- Figure 47. Rest of Europe Boron Market - Revenue and Forecast to 2031 (US$ Million)
- Figure 48. Asia Pacific Boron Market - Volume and Forecast to 2031 (Kilo Tons)
- Figure 49. Asia Pacific Boron Market - Revenue and Forecast to 2031 (US$ Million)
- Figure 50. Asia Pacific Boron Market Breakdown by Derivatives (2023 and 2031)
- Figure 51. Asia Pacific Boron Market Breakdown by End-use Industry (2023 and 2031)
- Figure 52. Asia Pacific Boron Market Breakdown by Key Countries, 2023 and 2031 (%)
- Figure 53. Australia Boron Market - Revenue and Forecast to 2031 (US$ Million)
- Figure 54. China Boron Market - Revenue and Forecast to 2031 (US$ Million)
- Figure 55. India Boron Market - Revenue and Forecast to 2031 (US$ Million)
- Figure 56. Japan Boron Market - Revenue and Forecast to 2031 (US$ Million)
- Figure 57. South Korea Boron Market - Revenue and Forecast to 2031 (US$ Million)
- Figure 58. Rest of APAC Boron Market - Revenue and Forecast to 2031 (US$ Million)
- Figure 59. Middle East and Africa Boron Market - Volume and Forecast to 2031 (Kilo Tons)
- Figure 60. Middle East and Africa Boron Market - Revenue and Forecast to 2031 (US$ Million)
- Figure 61. Middle East and Africa Boron Market Breakdown by Derivatives (2023 and 2031)
- Figure 62. Middle East and Africa Boron Market Breakdown by End-use Industry (2023 and 2031)
- Figure 63. Middle East and Africa Boron Market Breakdown by Key Countries, 2023 and 2031 (%)
- Figure 64. South Africa Boron Market - Revenue and Forecast to 2031 (US$ Million)
- Figure 65. Saudi Arabia Boron Market - Revenue and Forecast to 2031 (US$ Million)
- Figure 66. United Arab Emirates Boron Market - Revenue and Forecast to 2031 (US$ Million)
- Figure 67. Rest of Middle East and Africa Boron Market - Revenue and Forecast to 2031 (US$ Million)
- Figure 68. South and Central America Boron Market - Volume and Forecast to 2031 (Kilo Tons)
- Figure 69. South and Central America Boron Market - Revenue and Forecast to 2031 (US$ Million)
- Figure 70. South and Central America Boron Market Breakdown by Derivatives (2023 and 2031)
- Figure 71. South and Central America Boron Market Breakdown by End-use Industry (2023 and 2031)
- Figure 72. South and Central America Boron Market Breakdown by Key Countries, 2023 and 2031 (%)
- Figure 73. Brazil Boron Market - Revenue and Forecast to 2031 (US$ Million)
- Figure 74. Argentina Boron Market - Revenue and Forecast to 2031 (US$ Million)
- Figure 75. Rest of South and Central America Boron Market - Revenue and Forecast to 2031 (US$ Million)
- Figure 76. Heat Map Analysis by Key Players
- Figure 77. Company Positioning & Concentration
The boron market size was valued at US$ 5.64 billion in 2023 and is expected to reach US$ 7.65 billion by 2031; it is estimated to register a CAGR of 3.9% from 2023 to 2031.
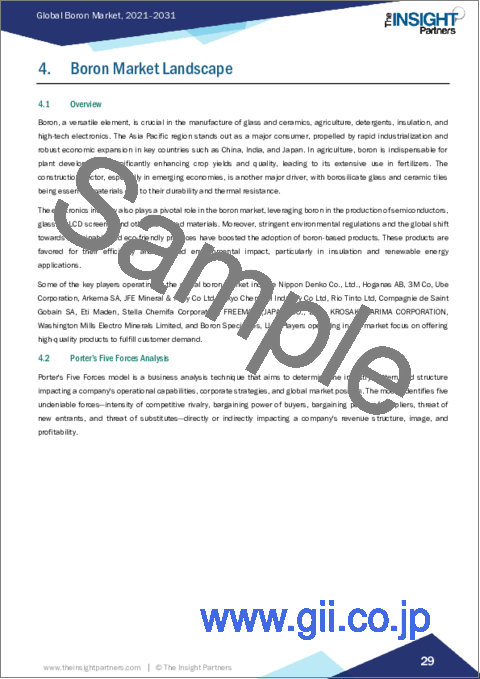
Boron, a versatile element, is crucial in the manufacture of glass and ceramics, agriculture, detergents, insulation, and high-tech electronics. The Asia Pacific region stands out as a major consumer, propelled by rapid industrialization and robust economic expansion in key countries such as China, India, and Japan. In agriculture, boron is indispensable for plant development, significantly enhancing crop yields and quality, leading to its extensive use in fertilizers. The construction sector, especially in emerging economies, is another major driver, with borosilicate glass and ceramic tiles being essential materials due to their durability and thermal resistance.
Based on derivative, the boron market is segmented into borax, boric acid, boron nitride, boron carbide, boron oxide, and others. Boron oxide segment is expected to register highest CAGR in the boron market from 2023 to 2031. Boron oxide, or diboron trioxide, is created by treating borax with sulfuric acid in a fusion furnace. The boron oxide segment is witnessing significant growth due to its use in abrasives, refractories, ceramics, and other high-performance applications. It is used as an insecticide, precursor for the boron compounds production, a fluxing agent in glasses, and a bonding agent in the hot isostatic pressing of boron nitride ceramics. The increasing demand for electronic devices and advancement in the renewable energy sector also contribute to the growth of the boron oxide segment. It is used in the production of semiconductors and dopants in solar cells.
Based on end-use industry, the market is segmented into agrochemicals, glass, ceramics, detergents, pharmaceuticals, electrical and electronics, and others. The glass segment held the largest share in the boron market in 2023. Boron is used in the production of borosilicate glass, known for its high durability, thermal resistance, and chemical stability. Glass producers incorporate 5-20% boric oxide into the silica base to control thermal expansion, lower melting temperature and viscosity, and inhibit crystallization of the glass and devitrification. Borates are used in various glass products such as borosilicate glass, insulation fiberglass, superfine glass fiber, textile fiberglass, display glass, and special glass. Insulation fiberglass material is a major material used in the construction industry.
In the boron market, Asia Pacific is expected to register the highest CAGR during 2023-2031. The region also marks the presence of major agrochemical producers such as India, China, and Japan. Asia Pacific is home to a few major players and many small players in the glass industry. In April 2022, Japanese glass manufacturer AGC developed a building-integrated PV panel for different building requirements. It can be installed on facades, curtain walls, and canopies where normal glass can be placed. Borosilicate glass made of boron is clearer and stronger in terms of sunlight transmission than other types of glass, thus making it a preferred choice for solar panel manufacturers. Such developments by the market players fuel the boron market growth in Asia Pacific.
The boron market in Asia Pacific is prominent due to the growing awareness about crop protection chemicals among farmers, government subsidies, the increase in population, and rising food demand. In the agriculture industry, boron is mixed with other fertilizers, dissolved in water, and sprayed directly on the crops and soil or through irrigation water. Surging demand for excellent agricultural products and the increasing need for high productivity and yield are expected to boost the use of boron in Asia Pacific, especially in China, Japan, and India.
Boron is used in various end-use industries such as glass and ceramics, detergents, agrochemicals, electronics, and pharmaceuticals. These industries are the largest consumers of boron, used for its properties that enhance the durability, heat resistance, and clarity of glass and ceramics. Fertilizer manufacturers incorporate boron into products to improve crop yields. Boron compounds are used in the production of household and industrial cleaning products due to their whitening and stain-removing properties. High purity boron is used in the production of semiconductors and other electronic components. End users maintain long-term relationships with boron manufacturers to ensure a steady supply of high-quality products.
A few players operating in the global boron market include Rio Tinto Group, AbEti Products Oy, Hoganas AB, Nippon Denko Co Ltd, Saint Gobain, 3M, Stella Chemifa Corp, UBE Corp, and Boron Specialties LLC. Players operating in the global boron market focus on providing high-quality products to fulfill customer demand. Also, they are focusing on launching new and high-quality products for their customers.
The overall global boron market size has been derived using both primary and secondary sources. To begin the research process, exhaustive secondary research has been conducted using internal and external sources to obtain qualitative and quantitative information related to the market. Also, multiple primary interviews have been conducted with industry participants to validate the data and gain more analytical insights into the topic. The participants of this process include industry experts such as VPs, business development managers, market intelligence managers, and national sales managers-along with external consultants such as valuation experts, research analysts, and key opinion leaders-specializing in the boron market.
Table Of Contents
1. Introduction
- 1.1 The Insight Partners Research Report Guidance
- 1.2 Market Segmentation
2. Executive Summary
- 2.1 Key Insights
- 2.2 Market Attractiveness
3. Research Methodology
- 3.1 Secondary Research
- 3.2 Primary Research
- 3.2.1 Hypothesis formulation:
- 3.2.2 Macro-economic factor analysis:
- 3.2.3 Developing base number:
- 3.2.4 Data Triangulation:
- 3.2.5 Country level data:
4. Boron Market Landscape
- 4.1 Overview
- 4.2 Porter's Five Forces Analysis
- 4.2.1 Bargaining Power of Suppliers
- 4.2.2 Bargaining Power of Buyers
- 4.2.3 Threat of New Entrants
- 4.2.4 Intensity of Competitive Rivalry
- 4.2.5 Threat of Substitutes
- 4.3 Ecosystem Analysis
- 4.3.1 Raw Material Suppliers
- 4.3.2 Boron Manufacturers
- 4.3.3 Distributors
- 4.3.4 End-Use Industry
- 4.3.5 List of Vendors in the Value Chain
5. Boron Market - Key Market Dynamics
- 5.1 Boron Market - Key Market Dynamics
- 5.2 Market Drivers
- 5.2.1 Growth of Glass & Ceramics Industry
- 5.2.2 Surge in Demand from Agrochemicals Industry
- 5.3 Market Restraints
- 5.3.1 Fluctuations in Boron Prices
- 5.4 Market Opportunities
- 5.4.1 Growing Investments in Aerospace & Defense Industry
- 5.5 Future Trends
- 5.5.1 Surging Utilization of Boron Nanoparticles in Several Industries
- 5.6 Impact of Drivers and Restraints:
6. Boron Market - Global Market Analysis
- 6.1 Boron Market Volume (Kilo Tons), 2021-2031
- 6.2 Boron Market Volume Forecast and Analysis (Kilo Tons)
- 6.3 Boron Market Revenue (US$ Million), 2021-2031
- 6.4 Boron Market Revenue Forecast and Analysis (US$ Million)
7. Boron Market Volume and Revenue Analysis - by Derivatives
- 7.1 Borax
- 7.1.1 Overview
- 7.1.2 Borax: Boron Market - Volume and Forecast to 2031 (Kilo Tons)
- 7.1.3 Borax: Boron Market - Revenue and Forecast to 2031 (US$ Million)
- 7.2 Boric Acid
- 7.2.1 Overview
- 7.2.2 Boric Acid: Boron Market - Volume and Forecast to 2031 (Kilo Tons)
- 7.2.3 Boric Acid: Boron Market - Revenue and Forecast to 2031 (US$ Million)
- 7.3 Boron Nitride
- 7.3.1 Overview
- 7.3.2 Boron Nitride: Boron Market - Volume and Forecast to 2031 (Kilo Tons)
- 7.3.3 Boron Nitride: Boron Market - Revenue and Forecast to 2031 (US$ Million)
- 7.4 Boron Carbide
- 7.4.1 Overview
- 7.4.2 Boron Carbide: Boron Market - Volume and Forecast to 2031 (Kilo Tons)
- 7.4.3 Boron Carbide: Boron Market - Revenue and Forecast to 2031 (US$ Million)
- 7.5 Boron Oxide
- 7.5.1 Overview
- 7.5.2 Boron Oxide: Boron Market - Volume and Forecast to 2031 (Kilo Tons)
- 7.5.3 Boron Oxide: Boron Market - Revenue and Forecast to 2031 (US$ Million)
- 7.6 Others
- 7.6.1 Overview
- 7.6.2 Others: Boron Market - Volume and Forecast to 2031 (Kilo Tons)
- 7.6.3 Others: Boron Market - Revenue and Forecast to 2031 (US$ Million)
8. Boron Market Revenue Analysis - by End-use Industry
- 8.1 Agrochemicals
- 8.1.1 Overview
- 8.1.2 Agrochemicals: Boron Market - Revenue and Forecast to 2031 (US$ Million)
- 8.2 Glass
- 8.2.1 Overview
- 8.2.2 Glass: Boron Market - Revenue and Forecast to 2031 (US$ Million)
- 8.3 Ceramics
- 8.3.1 Overview
- 8.3.2 Ceramics: Boron Market - Revenue and Forecast to 2031 (US$ Million)
- 8.4 Detergents
- 8.4.1 Overview
- 8.4.2 Detergents: Boron Market - Revenue and Forecast to 2031 (US$ Million)
- 8.5 Pharmaceuticals
- 8.5.1 Overview
- 8.5.2 Pharmaceuticals: Boron Market - Revenue and Forecast to 2031 (US$ Million)
- 8.6 Electrical and Electronics
- 8.6.1 Overview
- 8.6.2 Electrical and Electronics: Boron Market - Revenue and Forecast to 2031 (US$ Million)
- 8.7 Others
- 8.7.1 Overview
- 8.7.2 Others: Boron Market - Revenue and Forecast to 2031 (US$ Million)
9. Boron Market - Geographical Analysis
- 9.1 Overview
- 9.2 North America
- 9.2.1 North America Boron Market Overview
- 9.2.2 North America Boron Market - Volume and Forecast to 2031 (Kilo Tons)
- 9.2.3 North America Boron Market - Revenue and Forecast to 2031 (US$ Million)
- 9.2.4 North America Boron Market Breakdown by Derivatives
- 9.2.4.1 North America Boron Market Volume and Forecast and Analysis - by Derivatives
- 9.2.4.2 North America Boron Market Revenue and Forecast and Analysis - by Derivatives
- 9.2.5 North America Boron Market Breakdown by End-use Industry
- 9.2.5.1 North America Boron Market Revenue and Forecast and Analysis - by End-use Industry
- 9.2.6 North America Boron Market Revenue and Forecast and Analysis - by Country
- 9.2.6.1 North America Boron Market Volume and Forecast and Analysis - by Country
- 9.2.6.2 North America Boron Market Revenue and Forecast and Analysis - by Country
- 9.2.6.3 United States Boron Market - Revenue and Forecast to 2031 (US$ Million)
- 9.2.6.3.1 United States Boron Market Breakdown by Derivatives
- 9.2.6.3.2 United States Boron Market Breakdown by End-use Industry
- 9.2.6.4 Canada Boron Market - Revenue and Forecast to 2031 (US$ Million)
- 9.2.6.4.1 Canada Boron Market Breakdown by Derivatives
- 9.2.6.4.2 Canada Boron Market Breakdown by End-use Industry
- 9.2.6.5 Mexico Boron Market - Revenue and Forecast to 2031 (US$ Million)
- 9.2.6.5.1 Mexico Boron Market Breakdown by Derivatives
- 9.2.6.5.2 Mexico Boron Market Breakdown by End-use Industry
- 9.3 Europe
- 9.3.1 Europe Boron Market Overview
- 9.3.2 Europe Boron Market - Volume and Forecast to 2031 (Kilo Tons)
- 9.3.3 Europe Boron Market - Revenue and Forecast to 2031 (US$ Million)
- 9.3.4 Europe Boron Market Breakdown by Derivatives
- 9.3.4.1 Europe Boron Market Volume and Forecast and Analysis - by Derivatives
- 9.3.4.2 Europe Boron Market Revenue and Forecast and Analysis - by Derivatives
- 9.3.5 Europe Boron Market Breakdown by End-use Industry
- 9.3.5.1 Europe Boron Market Revenue and Forecast and Analysis - by End-use Industry
- 9.3.6 Europe Boron Market Revenue and Forecast and Analysis - by Country
- 9.3.6.1 Europe Boron Market Volume and Forecast and Analysis - by Country
- 9.3.6.2 Europe Boron Market Revenue and Forecast and Analysis - by Country
- 9.3.6.3 Germany Boron Market - Revenue and Forecast to 2031 (US$ Million)
- 9.3.6.3.1 Germany Boron Market Breakdown by Derivatives
- 9.3.6.3.2 Germany Boron Market Breakdown by End-use Industry
- 9.3.6.4 France Boron Market - Revenue and Forecast to 2031 (US$ Million)
- 9.3.6.4.1 France Boron Market Breakdown by Derivatives
- 9.3.6.4.2 France Boron Market Breakdown by End-use Industry
- 9.3.6.5 Italy Boron Market - Revenue and Forecast to 2031 (US$ Million)
- 9.3.6.5.1 Italy Boron Market Breakdown by Derivatives
- 9.3.6.5.2 Italy Boron Market Breakdown by End-use Industry
- 9.3.6.6 United Kingdom Boron Market - Revenue and Forecast to 2031 (US$ Million)
- 9.3.6.6.1 United Kingdom Boron Market Breakdown by Derivatives
- 9.3.6.6.2 United Kingdom Boron Market Breakdown by End-use Industry
- 9.3.6.7 Russia Boron Market - Revenue and Forecast to 2031 (US$ Million)
- 9.3.6.7.1 Russia Boron Market Breakdown by Derivatives
- 9.3.6.7.2 Russia Boron Market Breakdown by End-use Industry
- 9.3.6.8 Rest of Europe Boron Market - Revenue and Forecast to 2031 (US$ Million)
- 9.3.6.8.1 Rest of Europe Boron Market Breakdown by Derivatives
- 9.3.6.8.2 Rest of Europe Boron Market Breakdown by End-use Industry
- 9.4 Asia Pacific
- 9.4.1 Asia Pacific Boron Market Overview
- 9.4.2 Asia Pacific Boron Market - Volume and Forecast to 2031 (Kilo Tons)
- 9.4.3 Asia Pacific Boron Market - Revenue and Forecast to 2031 (US$ Million)
- 9.4.4 Asia Pacific Boron Market Breakdown by Derivatives
- 9.4.4.1 Asia Pacific Boron Market Volume and Forecast and Analysis - by Derivatives
- 9.4.4.2 Asia Pacific Boron Market Revenue and Forecast and Analysis - by Derivatives
- 9.4.5 Asia Pacific Boron Market Breakdown by End-use Industry
- 9.4.5.1 Asia Pacific Boron Market Revenue and Forecast and Analysis - by End-use Industry
- 9.4.6 Asia Pacific Boron Market Revenue and Forecast and Analysis - by Country
- 9.4.6.1 Asia Pacific Boron Market Volume and Forecast and Analysis - by Country
- 9.4.6.2 Asia Pacific Boron Market Revenue and Forecast and Analysis - by Country
- 9.4.6.3 Australia Boron Market - Revenue and Forecast to 2031 (US$ Million)
- 9.4.6.3.1 Australia Boron Market Breakdown by Derivatives
- 9.4.6.3.2 Australia Boron Market Breakdown by End-use Industry
- 9.4.6.4 China Boron Market - Revenue and Forecast to 2031 (US$ Million)
- 9.4.6.4.1 China Boron Market Breakdown by Derivatives
- 9.4.6.4.2 China Boron Market Breakdown by End-use Industry
- 9.4.6.5 India Boron Market - Revenue and Forecast to 2031 (US$ Million)
- 9.4.6.5.1 India Boron Market Breakdown by Derivatives
- 9.4.6.5.2 India Boron Market Breakdown by End-use Industry
- 9.4.6.6 Japan Boron Market - Revenue and Forecast to 2031 (US$ Million)
- 9.4.6.6.1 Japan Boron Market Breakdown by Derivatives
- 9.4.6.6.2 Japan Boron Market Breakdown by End-use Industry
- 9.4.6.7 South Korea Boron Market - Revenue and Forecast to 2031 (US$ Million)
- 9.4.6.7.1 South Korea Boron Market Breakdown by Derivatives
- 9.4.6.7.2 South Korea Boron Market Breakdown by End-use Industry
- 9.4.6.8 Rest of APAC Boron Market - Revenue and Forecast to 2031 (US$ Million)
- 9.4.6.8.1 Rest of APAC Boron Market Breakdown by Derivatives
- 9.4.6.8.2 Rest of APAC Boron Market Breakdown by End-use Industry
- 9.5 Middle East and Africa
- 9.5.1 Middle East and Africa Boron Market Overview
- 9.5.2 Middle East and Africa Boron Market - Volume and Forecast to 2031 (Kilo Tons)
- 9.5.3 Middle East and Africa Boron Market - Revenue and Forecast to 2031 (US$ Million)
- 9.5.4 Middle East and Africa Boron Market Breakdown by Derivatives
- 9.5.4.1 Middle East and Africa Boron Market Volume and Forecast and Analysis - by Derivatives
- 9.5.4.2 Middle East and Africa Boron Market Revenue and Forecast and Analysis - by Derivatives
- 9.5.5 Middle East and Africa Boron Market Breakdown by End-use Industry
- 9.5.5.1 Middle East and Africa Boron Market Revenue and Forecast and Analysis - by End-use Industry
- 9.5.6 Middle East and Africa Boron Market Revenue and Forecast and Analysis - by Country
- 9.5.6.1 Middle East and Africa Boron Market Volume and Forecast and Analysis - by Country
- 9.5.6.2 Middle East and Africa Boron Market Revenue and Forecast and Analysis - by Country
- 9.5.6.3 South Africa Boron Market - Revenue and Forecast to 2031 (US$ Million)
- 9.5.6.3.1 South Africa Boron Market Breakdown by Derivatives
- 9.5.6.3.2 South Africa Boron Market Breakdown by End-use Industry
- 9.5.6.4 Saudi Arabia Boron Market - Revenue and Forecast to 2031 (US$ Million)
- 9.5.6.4.1 Saudi Arabia Boron Market Breakdown by Derivatives
- 9.5.6.4.2 Saudi Arabia Boron Market Breakdown by End-use Industry
- 9.5.6.5 United Arab Emirates Boron Market - Revenue and Forecast to 2031 (US$ Million)
- 9.5.6.5.1 United Arab Emirates Boron Market Breakdown by Derivatives
- 9.5.6.5.2 United Arab Emirates Boron Market Breakdown by End-use Industry
- 9.5.6.6 Rest of Middle East and Africa Boron Market - Revenue and Forecast to 2031 (US$ Million)
- 9.5.6.6.1 Rest of Middle East and Africa Boron Market Breakdown by Derivatives
- 9.5.6.6.2 Rest of Middle East and Africa Boron Market Breakdown by End-use Industry
- 9.6 South and Central America
- 9.6.1 South and Central America Boron Market Overview
- 9.6.2 South and Central America Boron Market - Volume and Forecast to 2031 (Kilo Tons)
- 9.6.3 South and Central America Boron Market - Revenue and Forecast to 2031 (US$ Million)
- 9.6.4 South and Central America Boron Market Breakdown by Derivatives
- 9.6.4.1 South and Central America Boron Market Volume and Forecast and Analysis - by Derivatives
- 9.6.4.2 South and Central America Boron Market Revenue and Forecast and Analysis - by Derivatives
- 9.6.5 South and Central America Boron Market Breakdown by End-use Industry
- 9.6.5.1 South and Central America Boron Market Revenue and Forecast and Analysis - by End-use Industry
- 9.6.6 South and Central America Boron Market Revenue and Forecast and Analysis - by Country
- 9.6.6.1 South and Central America Boron Market Volume and Forecast and Analysis - by Country
- 9.6.6.2 South and Central America Boron Market Revenue and Forecast and Analysis - by Country
- 9.6.6.3 Brazil Boron Market - Revenue and Forecast to 2031 (US$ Million)
- 9.6.6.3.1 Brazil Boron Market Breakdown by Derivatives
- 9.6.6.3.2 Brazil Boron Market Breakdown by End-use Industry
- 9.6.6.4 Argentina Boron Market - Revenue and Forecast to 2031 (US$ Million)
- 9.6.6.4.1 Argentina Boron Market Breakdown by Derivatives
- 9.6.6.4.2 Argentina Boron Market Breakdown by End-use Industry
- 9.6.6.5 Rest of South and Central America Boron Market - Revenue and Forecast to 2031 (US$ Million)
- 9.6.6.5.1 Rest of South and Central America Boron Market Breakdown by Derivatives
- 9.6.6.5.2 Rest of South and Central America Boron Market Breakdown by End-use Industry
10. Competitive Landscape
- 10.1 Heat Map Analysis by Key Players
- 10.2 Company Positioning & Concentration
11. Industry Landscape
- 11.1 Overview
- 11.2 Collaboration
- 11.3 Market Initiative
12. Company Profiles
- 12.1 Nippon Denko Co., Ltd.
- 12.1.1 Key Facts
- 12.1.2 Business Description
- 12.1.3 Products and Services
- 12.1.4 Financial Overview
- 12.1.5 SWOT Analysis
- 12.1.6 Key Developments
- 12.2 Hoganas AB
- 12.2.1 Key Facts
- 12.2.2 Business Description
- 12.2.3 Products and Services
- 12.2.4 Financial Overview
- 12.2.5 SWOT Analysis
- 12.2.6 Key Developments
- 12.3 3M Co
- 12.3.1 Key Facts
- 12.3.2 Business Description
- 12.3.3 Products and Services
- 12.3.4 Financial Overview
- 12.3.5 SWOT Analysis
- 12.3.6 Key Developments
- 12.4 UBE Corporation
- 12.4.1 Key Facts
- 12.4.2 Business Description
- 12.4.3 Products and Services
- 12.4.4 Financial Overview
- 12.4.5 SWOT Analysis
- 12.4.6 Key Developments
- 12.5 Arkema SA
- 12.5.1 Key Facts
- 12.5.2 Business Description
- 12.5.3 Products and Services
- 12.5.4 Financial Overview
- 12.5.5 SWOT Analysis
- 12.5.6 Key Developments
- 12.6 JFE Mineral & Alloy Co Ltd
- 12.6.1 Key Facts
- 12.6.2 Business Description
- 12.6.3 Products and Services
- 12.6.4 Financial Overview
- 12.6.5 SWOT Analysis
- 12.6.6 Key Developments
- 12.7 Tokyo Chemical Industry Co Ltd
- 12.7.1 Key Facts
- 12.7.2 Business Description
- 12.7.3 Products and Services
- 12.7.4 Financial Overview
- 12.7.5 SWOT Analysis
- 12.7.6 Key Developments
- 12.8 Rio Tinto Ltd
- 12.8.1 Key Facts
- 12.8.2 Business Description
- 12.8.3 Products and Services
- 12.8.4 Financial Overview
- 12.8.5 SWOT Analysis
- 12.8.6 Key Developments
- 12.9 Compagnie de Saint Gobain SA
- 12.9.1 Key Facts
- 12.9.2 Business Description
- 12.9.3 Products and Services
- 12.9.4 Financial Overview
- 12.9.5 SWOT Analysis
- 12.9.6 Key Developments
- 12.10 Eti Maden
- 12.10.1 Key Facts
- 12.10.2 Business Description
- 12.10.3 Products and Services
- 12.10.4 Financial Overview
- 12.10.5 SWOT Analysis
- 12.10.6 Key Developments
- 12.11 Stella Chemifa Corporation
- 12.11.1 Key Facts
- 12.11.2 Business Description
- 12.11.3 Products and Services
- 12.11.4 Financial Overview
- 12.11.5 SWOT Analysis
- 12.11.6 Key Developments
- 12.12 FREEMAN (JAPAN) CO., LTD.
- 12.12.1 Key Facts
- 12.12.2 Business Description
- 12.12.3 Products and Services
- 12.12.4 Financial Overview
- 12.12.5 SWOT Analysis
- 12.12.6 Key Developments
- 12.13 KROSAKI HARIMA CORPORATION
- 12.13.1 Key Facts
- 12.13.2 Business Description
- 12.13.3 Products and Services
- 12.13.4 Financial Overview
- 12.13.5 SWOT Analysis
- 12.13.6 Key Developments
- 12.14 Washington Mills Electro Minerals Limited
- 12.14.1 Key Facts
- 12.14.2 Business Description
- 12.14.3 Products and Services
- 12.14.4 Financial Overview
- 12.14.5 SWOT Analysis
- 12.14.6 Key Developments
- 12.15 Boron Specialties, LLC
- 12.15.1 Key Facts
- 12.15.2 Business Description
- 12.15.3 Products and Services
- 12.15.4 Financial Overview
- 12.15.5 SWOT Analysis
- 12.15.6 Key Developments
13. Appendix
- 13.1 About The Insight Partners

