|
|
市場調査レポート
商品コード
1533110
アジア太平洋地域のVaaS(Video as a Service):2030年市場予測- 地域別分析-展開モード別、業界別Asia Pacific Video as a Service Market Forecast to 2030 - Regional Analysis - by Deployment Mode and Industry Vertical |
||||||

|
|||||||
|
|||||||

| アジア太平洋地域のVaaS(Video as a Service):2030年市場予測- 地域別分析-展開モード別、業界別 |
|
出版日: 2024年06月04日
発行: The Insight Partners
ページ情報: 英文 95 Pages
納期: 即納可能
|

全表示
- 概要
- 図表
- 目次
アジア太平洋地域のVaaS(Video as a Service)市場は、2022年には9億2,080万米ドルと評価され、2030年には39億8,675万米ドルに達すると予測され、2022年から2030年までのCAGRは20.1%を記録すると予測されています。
VaaS(Video as a Service)市場を変革する技術の進歩がアジア太平洋地域のVaaS(Video as a Service)市場を押し上げる
世界中の技術大手は、人工知能や拡張知能などの新しい革新的技術の開発と統合に大いに取り組んでおり、ヘルスケア、BFSI、IT&テレコム、政府、教育、製造、その他の産業など、さまざまな業界で先進技術の採用を促進しています。AI技術は、VaaS(Video as a Service)市場における次世代ソフトウェア技術の中核に位置づけられています。AIは情報を予測し配信することで、顧客との効率的で迅速かつパーソナライズされた体験を可能にし、雇用者の収益性を高める。AIはまた、ユーザーがビデオをカスタマイズしたり、いつでもどこでもライブビデオ会議を行ったり、将来の使用のためにビデオを録画したり、ユーザーのために指定されたイベントを検出したりするのに役立ちます。AIベースのVaaS(Video as a Service)は、適切なタイミングで適切な顧客をターゲットにすることで、雇用者のマーケティング活動をサポートします。SpotCam Co.Ltd.、vCloud.ai、Comcast Cable Communications Management, LLCなどの開発者は、顧客とサービス・プロバイダー間のやり取りを合理化するため、クラウドベースのビデオによるAI技術の開発と実装に注力しています。サービスとしてのAIベースのビデオは、プロバイダーが顧客の都合に合わせてサービスを提供することを可能にし、それによって顧客満足度を向上させる。2022年1月、Comcast Cable Communications Management, LLCは、コンテンツプロバイダー、オペレーター、広告主向けにVideoAIサービスを開始しました。VideoAIはSoftware-as-a-Service(SaaS)で、企業が動画(ライブおよびオンデマンド)、音声、クローズドキャプションを理解・分析し、コンテンツ資産に関する実用的なメタデータを作成するのに役立ちます。VideoAIはまた、新しいコンテンツを生成・管理し、業務を合理化し、広告効率を向上させることができます。このように、ディーラー管理ビジネスに革命をもたらすAIの統合は、今後数年間、VaaS(Video as a Service)市場の成長を促進する可能性が高いです。技術の進歩は、拡張現実や仮想現実の人気と相まって、消費者の間でサービスとしての動画に対する需要を煽っています。このように、新しい革新的な技術の出現は、今後数年間、効率的で高度なVaaS(Video as a Service)をユーザーに提供するために、ベンダーに多くの機会を創出すると予想されます。
アジア太平洋地域のVaaS(Video as a Service)市場概要
アジア太平洋地域のVaaS(Video as a Service)市場は、中国、インド、日本、オーストラリア、韓国、アジア太平洋地域のその他諸国に区分されます。アジア太平洋地域は予測期間中、世界のVaaS(Video as a Service)市場で最も高いCAGRを記録すると予測されています。アジア太平洋地域における市場成長の背景には、事業運営を効率的に管理する必要性の高まりがあります。IT・通信、ヘルスケア、BFSI、教育、小売、eコマースなど、さまざまな業界で事業を展開する企業は、コスト効率が高く、統合・管理・運用が容易で、どこからでも利用できるVaaS(Video as a Service)を好んでいます。さらに、リモートワークやハイブリッドワークモデルに対する消費者の嗜好の変化は、予測期間中にVaaS(Video as a Service)市場にチャンスをもたらすと思われます。2023年10月のFlexOS調査によると、同地域の従業員の40%がリモートワークを好んでおり、このうちミレニアル世代の40%、ベビーブーム世代の18%がリモートワークモデルを非常に好んでいることから、従業員の間でVaaS(Video as a Service)ソリューションの需要と採用が増加しています。VaaS(Video as a Service)は、より良い意思決定につながる仮想ディスカッション、プレゼンテーション、トラブルシューティングのためのクラウドベースのアプリケーションを提供することにより、チームの効率的な作業を支援します。中国、日本、インド、オーストラリア、韓国、その他のアジア太平洋地域諸国では、拡張現実、AI、仮想現実などの新技術の採用が増加しており、同地域のVaaS(Video as a Service)市場を牽引しています。ソフトウェアとしてのAIベースのビデオは、他のコラボレーション・ツールとの統合を提供し、ビジネスの全体的な効率を高める。さらに、パブリック・クラウド・サービスの成長が同地域の市場成長を後押ししています。IDCアジア太平洋によると、パブリッククラウド市場は2026年までに1,536億米ドルに達し、2022年の成長率は25.9%に達すると予想されています。パブリック・クラウドは、アプリケーションをスケーラブルなモジュールに変換することで、ビジネス・オペレーションとプロセスを合理化する組織からの需要が高いです。このように、さまざまな業界でVaaS(Video as a Service)を使用することの利点が、アジア太平洋地域のVaaS(Video as a Service)市場を牽引しています。
アジア太平洋地域のVaaS(Video as a Service)市場の収益と2030年までの予測(金額)
アジア太平洋地域のVaaS(Video as a Service)市場のセグメンテーション
アジア太平洋地域のVaaS(Video as a Service)市場は、展開モード、業界別、国別に区分されます。展開モードに基づき、アジア太平洋地域のVaaS(Video as a Service)市場は、パブリッククラウド、プライベートクラウド、ハイブリッドクラウドに分類されます。2022年にはパブリッククラウドセグメントが最大の市場シェアを占めています。
業界別では、アジア太平洋地域のVaaS(Video as a Service)市場は、IT&テレコム、ヘルスケア&ライフサイエンス、小売&eコマース、BFSI、教育、メディア&エンターテインメント、政府&公共部門、その他に分類されます。2022年の市場シェアは、IT&テレコム分野が最大でした。
国別に見ると、アジア太平洋地域のVaaS(Video as a Service)市場は、オーストラリア、中国、日本、インド、韓国、その他アジア太平洋地域に区分されます。2022年のアジア太平洋地域のVaaS(Video as a Service)市場シェアは中国が独占しました。
Cisco Systems Inc、Zoom Video Communications Inc、Microsoft Corp、Amazon Web Services Inc、Avaya Holdings Corp、Google LLC、Adobe Inc、RingCentral Inc、BlueJeansは、アジア太平洋地域のVaaS(Video as a Service)市場で事業を展開している大手企業です。
目次
第1章 イントロダクション
第2章 エグゼクティブサマリー
- 主要洞察
- 市場の魅力
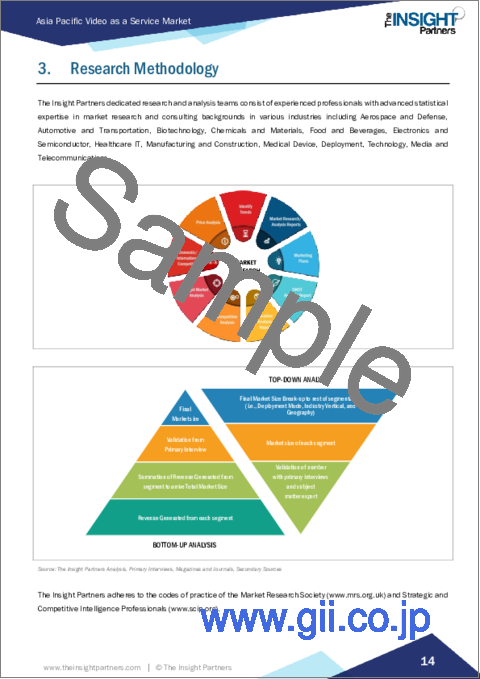
第3章 調査手法
- 調査範囲
- 2次調査
- 1次調査
第4章 アジア太平洋地域のVaaS(Video as a Service)市場情勢
- PEST分析
- エコシステム分析
- バリューチェーンのベンダー一覧
第5章 アジア太平洋地域のVaaS(Video as a Service)市場:主要産業力学
- 促進要因
- 消費者の間でのビデオベースのコミュニケーションに対する需要の高まり
- リモートワークモデルの採用増加
- ヘルスケア業界におけるビデオ会議サービスの利用増加
- 市場抑制要因
- データプライバシーとセキュリティに対する懸念の高まり
- 市場機会
- VaaS(Video as a Service)市場を変革する技術の進歩
- 今後の動向
- 拡大する動画マーケティングと販売動向
- 促進要因と抑制要因の影響
第6章 VaaS(Video as a Service)市場:アジア太平洋市場分析
- VaaS(Video as a Service)市場の収益、2022年~2030年
- VaaS(Video as a Service)市場の予測と分析
第7章 アジア太平洋地域のVaaS(Video as a Service)市場分析:展開モード
- パブリッククラウド
- プライベートクラウド
- ハイブリッドクラウド
第8章 アジア太平洋地域のVaaS(Video as a Service)市場分析:業界別
- IT&テレコム
- ヘルスケア&ライフサイエンス
- 小売・eコマース
- BFSI
- 教育
- メディア・エンターテイメント
- 政府・公共部門
- その他
第9章 アジア太平洋地域のVaaS(Video as a Service)市場:国別分析
- オーストラリア
- 中国
- 日本
- インド
- 韓国
- その他アジア太平洋地域
第10章 競合情勢
- 主要企業別ヒートマップ分析
第11章 業界情勢
- 市場イニシアティブ
- 新製品開発
第12章 企業プロファイル
- Cisco Systems Inc
- Zoom Video Communications Inc
- Microsoft Corp
- Amazon Web Services Inc
- Avaya Holdings Corp
- Google LLC
- Adobe Inc
- RingCentral Inc
- BlueJeans
第13章 付録
List Of Tables
- Table 1. Video as a Service Market Segmentation
- Table 2. Video as a Service Market Revenue and Forecasts to 2030 (US$ Million)
- Table 3. Video as a Service Market Revenue and Forecasts to 2030 (US$ Million) - Deployment Mode
- Table 4. Video as a Service Market Revenue and Forecasts to 2030 (US$ Million) - Industry Vertical
- Table 5. Asia Pacific Video as a Service Market, by Country - Revenue and Forecast to 2030 (USD Million)
- Table 6. Australia Video as a Service Market Revenue and Forecasts to 2030 (US$ Mn) - By Deployment Mode
- Table 7. Australia Video as a Service Market Revenue and Forecasts to 2030 (US$ Mn) - By Industry Vertical
- Table 8. China Video as a Service Market Revenue and Forecasts to 2030 (US$ Mn) - By Deployment Mode
- Table 9. China Video as a Service Market Revenue and Forecasts to 2030 (US$ Mn) - By Industry Vertical
- Table 10. Japan Video as a Service Market Revenue and Forecasts to 2030 (US$ Mn) - By Deployment Mode
- Table 11. Japan Video as a Service Market Revenue and Forecasts to 2030 (US$ Mn) - By Industry Vertical
- Table 12. India Video as a Service Market Revenue and Forecasts to 2030 (US$ Mn) - By Deployment Mode
- Table 13. India Video as a Service Market Revenue and Forecasts to 2030 (US$ Mn) - By Industry Vertical
- Table 14. South Korea Video as a Service Market Revenue and Forecasts to 2030 (US$ Mn) - By Deployment Mode
- Table 15. South Korea Video as a Service Market Revenue and Forecasts to 2030 (US$ Mn) - By Industry Vertical
- Table 16. Rest of Asia Pacific Video as a Service Market Revenue and Forecasts to 2030 (US$ Mn) - By Deployment Mode
- Table 17. Rest of Asia Pacific Video as a Service Market Revenue and Forecasts to 2030 (US$ Mn) - By Industry Vertical
- Table 18. Heat Map Analysis By Key Players
- Table 19. List of Abbreviation
List Of Figures
- Figure 1. Video as a Service Market Segmentation, By Country
- Figure 2. PEST Analysis
- Figure 3. Ecosystem: Video as a Service Market
- Figure 4. Video as a Service Market - Key Industry Dynamics
- Figure 5. Impact Analysis of Drivers and Restraints
- Figure 6. Video as a Service Market Revenue (US$ Million), 2022 & 2030
- Figure 7. Video as a Service Market Share (%) - Deployment Mode, 2022 and 2030
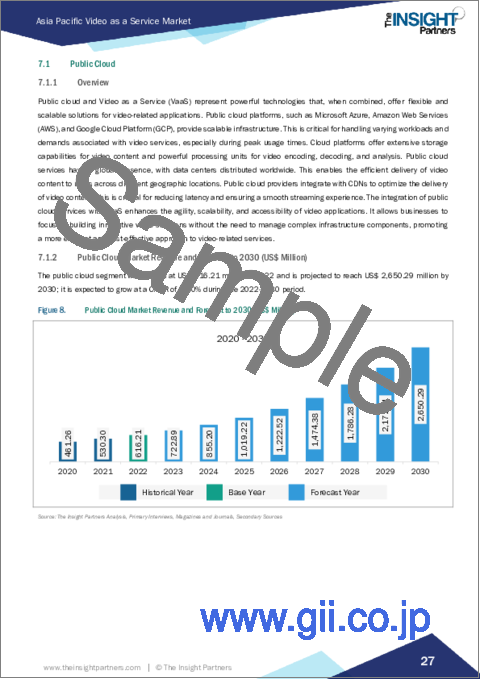
- Figure 8. Public Cloud Market Revenue and Forecasts to 2030 (US$ Million)
- Figure 9. Private Cloud Market Revenue and Forecasts to 2030 (US$ Million)
- Figure 10. Hybrid Cloud Market Revenue and Forecasts to 2030 (US$ Million)
- Figure 11. Video as a Service Market Share (%) - Industry Vertical, 2022 and 2030
- Figure 12. IT & Telecom Market Revenue and Forecasts to 2030 (US$ Million)
- Figure 13. Healthcare & Life Sciences Market Revenue and Forecasts to 2030 (US$ Million)
- Figure 14. Retail & E-Commerce Market Revenue and Forecasts to 2030 (US$ Million)
- Figure 15. BFSI Market Revenue and Forecasts to 2030 (US$ Million)
- Figure 16. Education Market Revenue and Forecasts to 2030 (US$ Million)
- Figure 17. Media & Entertainment Market Revenue and Forecasts to 2030 (US$ Million)
- Figure 18. Government & Public Sector Market Revenue and Forecasts to 2030 (US$ Million)
- Figure 19. Others Market Revenue and Forecasts to 2030 (US$ Million)
- Figure 20. Asia Pacific Video as a Service Market Revenue, By Key Country, (2022) (US$ Million)
- Figure 21. Asia Pacific Video as a Service Market Breakdown By Key Countries, 2022 And 2030 (%)
- Figure 22. Australia Video as a Service Market Revenue and Forecasts to 2030 (US$ Mn)
- Figure 23. China Video as a Service Market Revenue and Forecasts to 2030 (US$ Mn)
- Figure 24. Japan Video as a Service Market Revenue and Forecasts to 2030 (US$ Mn)
- Figure 25. India Video as a Service Market Revenue and Forecasts to 2030 (US$ Mn)
- Figure 26. South Korea Video as a Service Market Revenue and Forecasts to 2030 (US$ Mn)
- Figure 27. Rest of Asia Pacific Video as a Service Market Revenue and Forecasts to 2030 (US$ Mn)
The Asia Pacific video as a service market was valued at US$ 920.80 million in 2022 and is expected to reach US$ 3,986.75 million by 2030; it is estimated to record a CAGR of 20.1% from 2022 to 2030.
Technological Advancements to Revolutionize Video as a Service Market Boost Asia Pacific Video as a Service Market
Technological giants across the world are highly engaged in developing and integrating new innovative technologies such as artificial intelligence and augmented reality, which fuels the adoption of advanced technologies in various industries such as healthcare, BFSI, IT & telecom, government, education, manufacturing, and other industries. AI technology is positioned at the core of the next-generation software technologies in the video as a service market. It predicts and delivers the information, enabling an efficient, fast, and personalized experience with customers and boosting employers' profitability. AI also helps users customize videos, live video conferencing anytime and anywhere, record video for future usage, and detect specified events for users. AI-based video as a service supports employers in their marketing activities by targeting the right customers at the right time. SpotCam Co., Ltd.; vCloud.ai; Comcast Cable Communications Management, LLC; and other developers focus on developing and implementing AI technology with cloud-based videos to streamline interactions between customers and service providers. The AI-based video as a service allows providers to serve customers at their convenience, thereby increasing customer satisfaction. In January 2022, Comcast Cable Communications Management, LLC launched a VideoAI service for content providers, operators, and advertisers. The VideoAI is a software-as-a-service (SaaS) that helps companies understand and analyze video (live and on-demand), audio, and closed captions for creating actionable metadata around content assets. VideoAI can also generate and manage new content, streamlining business operations and improving advertising efficiency. Thus, the integration of AI to revolutionize the dealer management business is likely to fuel the video as a service market growth in the coming years. Advancements in technology, coupled with the popularity of augmented reality and virtual reality, fuel the demand for video as a service among consumers. Thus, the advent of new innovative technologies is expected to create numerous opportunities for vendors to provide efficient and advanced video as a service to users in the coming years.
Asia Pacific Video as a Service Market Overview
The APAC video as a service market is segmented into China, India, Japan, Australia, South Korea, and the Rest of APAC. APAC is anticipated to record the highest CAGR in the global video as a service market during the forecast period. The market growth in APAC is attributed to the growing need to manage business operations effectively. Enterprises operating across industry verticals, including IT & telecom, healthcare, BFSI, education, retail, e-commerce, and others, prefer video as a service that is cost-effective and easy to integrate, manage, and operate from anywhere. Furthermore, shifting consumer preferences for remote and hybrid working models would create opportunities for the video as a service market during the forecast period. According to FlexOS survey of October 2023, 40% of employees in the region prefer remote work; among this, 40% of millennial populations and 18% of baby boomers are highly preferring the remote work model, which increases the demand and adoption of video as a service solution among employees. Video as a service helps teams work effectively by providing a cloud-based application for virtual discussion, presentation, and troubleshooting that leads to better decision making. The rising adoption of new technologies such as augmented reality, AI, and virtual reality in China, Japan, India, Australia, South Korea, and other APAC countries drives the video as a service market in the region. AI-based video as a software offers integration with other collaboration tools, which enhances the overall efficiency of businesses. Moreover, the growth of public cloud services bolsters the market growth in the region. According to IDC Asia Pacific, the public cloud market is expected to reach US$ 153.6 billion by 2026, with a growth rate of 25.9% in 2022. Public cloud is highly demanded by organizations to streamline business operations and processes by transforming their applications into scalable modules. Thus, the benefits of using a video as a service in various industries drive the Asia Pacific video as a service market.
Asia Pacific Video as a Service Market Revenue and Forecast to 2030 (US$ Million)
Asia Pacific Video as a Service Market Segmentation
The Asia Pacific video as a service market is segmented based on deployment mode, industry vertical, and country. Based on deployment mode, the Asia Pacific video as a service market is categorized into public cloud, private cloud, and hybrid cloud. The public cloud segment held the largest market share in 2022.
In terms of industry vertical, the Asia Pacific video as a service market is categorized into IT & telecom, healthcare & life sciences, retail & e-commerce, BFSI, education, media & entertainment, government & public sector, and others. The IT & telecom segment held the largest market share in 2022.
Based on country, the Asia Pacific video as a service market is segmented into Australia, China, Japan, India, South Korea, and the Rest of Asia Pacific. China dominated the Asia Pacific video as a service market share in 2022.
Cisco Systems Inc, Zoom Video Communications Inc, Microsoft Corp, Amazon Web Services Inc, Avaya Holdings Corp, Google LLC, Adobe Inc, RingCentral Inc, and BlueJeans are some of the leading companies operating in the Asia Pacific video as a service market.
Table Of Contents
1. Introduction
- 1.1 The Insight Partners Research Report Guidance
- 1.2 Market Segmentation
2. Executive Summary
- 2.1 Key Insights
- 2.2 Market Attractiveness
3. Research Methodology
- 3.1 Coverage
- 3.2 Secondary Research
- 3.3 Primary Research
4. Asia Pacific Video as a Service Market Landscape
- 4.1 Overview
- 4.2 PEST Analysis
- 4.3 Ecosystem Analysis
- 4.3.1 List of Vendors in Value Chain:
5. Asia Pacific Video as a Service Market - Key Industry Dynamics
- 5.1 Drivers
- 5.1.1 Growing Demand for Video-Based Communications Among Consumers
- 5.1.2 Increasing Adoption of Remote Working Model
- 5.1.3 Rising Use of Video Conferencing Services in Healthcare Industry
- 5.2 Market Restraints
- 5.2.1 Growing Data Privacy and Security Concerns
- 5.3 Market Opportunities
- 5.3.1 Technological Advancements to Revolutionize Video as a Service Market
- 5.4 Future Trends
- 5.4.1 Growing Video Marketing and Selling Trends
- 5.5 Impact of Drivers and Restraints:
6. Video as a Service Market - Asia Pacific Market Analysis
- 6.1 Video as a Service Market Revenue (US$ Million), 2022 - 2030
- 6.2 Video as a Service Market Forecast and Analysis
7. Asia Pacific Video as a Service Market Analysis - Deployment Mode
- 7.1 Public Cloud
- 7.1.1 Overview
- 7.1.2 Public Cloud Market Revenue and Forecasts to 2030 (US$ Million)
- 7.2 Private Cloud
- 7.2.1 Overview
- 7.2.2 Private Cloud Market Revenue and Forecasts to 2030 (US$ Million)
- 7.3 Hybrid Cloud
- 7.3.1 Overview
- 7.3.2 Hybrid Cloud Market Revenue and Forecasts to 2030 (US$ Million)
8. Asia Pacific Video as a Service Market Analysis - Industry Vertical
- 8.1 IT & Telecom
- 8.1.1 Overview
- 8.1.2 IT & Telecom Market Revenue and Forecasts to 2030 (US$ Million)
- 8.2 Healthcare & Life Sciences
- 8.2.1 Overview
- 8.2.2 Healthcare & Life Sciences Market Revenue and Forecasts to 2030 (US$ Million)
- 8.3 Retail & E-Commerce
- 8.3.1 Overview
- 8.3.2 Retail & E-Commerce Market Revenue and Forecasts to 2030 (US$ Million)
- 8.4 BFSI
- 8.4.1 Overview
- 8.4.2 BFSI Market Revenue and Forecasts to 2030 (US$ Million)
- 8.5 Education
- 8.5.1 Overview
- 8.5.2 Education Market Revenue and Forecasts to 2030 (US$ Million)
- 8.6 Media & Entertainment
- 8.6.1 Overview
- 8.6.2 Media & Entertainment Market Revenue and Forecasts to 2030 (US$ Million)
- 8.7 Government & Public Sector
- 8.7.1 Overview
- 8.7.2 Government & Public Sector Market Revenue and Forecasts to 2030 (US$ Million)
- 8.8 Others
- 8.8.1 Overview
- 8.8.2 Others Market Revenue and Forecasts to 2030 (US$ Million)
9. Asia Pacific Video as a Service Market - Country Analysis
- 9.1 Asia Pacific Video as a Service Market
- 9.1.1 Overview
- 9.1.2 Video as a service market Breakdown by Countries
- 9.1.2.1 Australia Video as a Service Market Revenue and Forecasts to 2030 (US$ Mn)
- 9.1.2.1.1 Australia Video as a Service Market Breakdown by Deployment Mode
- 9.1.2.1.2 Australia Video as a Service Market Breakdown by Industry Vertical
- 9.1.2.2 China Video as a Service Market Revenue and Forecasts to 2030 (US$ Mn)
- 9.1.2.2.1 China Video as a Service Market Breakdown by Deployment Mode
- 9.1.2.2.2 China Video as a Service Market Breakdown by Industry Vertical
- 9.1.2.4 Japan Video as a Service Market Revenue and Forecasts to 2030 (US$ Mn)
- 9.1.2.4.1 Japan Video as a Service Market Breakdown by Deployment Mode
- 9.1.2.4.2 Japan Video as a Service Market Breakdown by Industry Vertical
- 9.1.2.5 India Video as a Service Market Revenue and Forecasts to 2030 (US$ Mn)
- 9.1.2.5.1 India Video as a Service Market Breakdown by Deployment Mode
- 9.1.2.5.2 India Video as a Service Market Breakdown by Industry Vertical
- 9.1.2.6 South Korea Video as a Service Market Revenue and Forecasts to 2030 (US$ Mn)
- 9.1.2.6.1 South Korea Video as a Service Market Breakdown by Deployment Mode
- 9.1.2.6.2 South Korea Video as a Service Market Breakdown by Industry Vertical
- 9.1.2.7 Rest of Asia Pacific Video as a Service Market Revenue and Forecasts to 2030 (US$ Mn)
- 9.1.2.7.1 Rest of Asia Pacific Video as a Service Market Breakdown by Deployment Mode
- 9.1.2.7.2 Rest of Asia Pacific Video as a Service Market Breakdown by Industry Vertical
- 9.1.2.1 Australia Video as a Service Market Revenue and Forecasts to 2030 (US$ Mn)
10. Competitive Landscape
- 10.1 Heat Map Analysis By Key Players
11. Industry Landscape
- 11.1 Overview
- 11.2 Market Initiative
- 11.3 New Product Development
12. Company Profile
- 12.1 Cisco Systems Inc
- 12.1.1 Key Facts
- 12.1.2 Business Description
- 12.1.3 Products and Services
- 12.1.4 Financial Overview
- 12.1.5 SWOT Analysis
- 12.1.6 Key Developments
- 12.2 Zoom Video Communications Inc
- 12.2.1 Key Facts
- 12.2.2 Business Description
- 12.2.3 Products and Services
- 12.2.4 Financial Overview
- 12.2.5 SWOT Analysis
- 12.2.6 Key Developments
- 12.3 Microsoft Corp
- 12.3.1 Key Facts
- 12.3.2 Business Description
- 12.3.3 Products and Services
- 12.3.4 Financial Overview
- 12.3.5 SWOT Analysis
- 12.3.6 Key Developments
- 12.4 Amazon Web Services Inc
- 12.4.1 Key Facts
- 12.4.2 Business Description
- 12.4.3 Products and Services
- 12.4.4 Financial Overview
- 12.4.5 SWOT Analysis
- 12.4.6 Key Developments
- 12.5 Avaya Holdings Corp
- 12.5.1 Key Facts
- 12.5.2 Business Description
- 12.5.3 Products and Services
- 12.5.4 Financial Overview
- 12.5.5 SWOT Analysis
- 12.5.6 Key Developments
- 12.6 Google LLC
- 12.6.1 Key Facts
- 12.6.2 Business Description
- 12.6.3 Products and Services
- 12.6.4 Financial Overview
- 12.6.5 SWOT Analysis
- 12.6.6 Key Developments
- 12.7 Adobe Inc
- 12.7.1 Key Facts
- 12.7.2 Business Description
- 12.7.3 Products and Services
- 12.7.4 Financial Overview
- 12.7.5 SWOT Analysis
- 12.7.6 Key Developments
- 12.8 RingCentral Inc
- 12.8.1 Key Facts
- 12.8.2 Business Description
- 12.8.3 Products and Services
- 12.8.4 Financial Overview
- 12.8.5 SWOT Analysis
- 12.8.6 Key Developments
- 12.9 BlueJeans
- 12.9.1 Key Facts
- 12.9.2 Business Description
- 12.9.3 Products and Services
- 12.9.4 Financial Overview
- 12.9.5 SWOT Analysis
- 12.9.6 Key Developments
13. Appendix
- 13.1 Word Index
