|
|
市場調査レポート
商品コード
1533068
鉱業用化学品のアジア太平洋市場、2030年までの予測 - 地域別分析:タイプ別、鉱物タイプ別、用途別Asia Pacific Mining Chemicals Market Forecast to 2030 - Regional Analysis - by Type, Mineral Type (Base Metals, Non-Metallic Minerals, Precious Metals, and Others), and Application (Mineral Processing, Wastewater Treatment, and Others) |
||||||
|
|||||||
|
|||||||

| 鉱業用化学品のアジア太平洋市場、2030年までの予測 - 地域別分析:タイプ別、鉱物タイプ別、用途別 |
|
出版日: 2024年06月04日
発行: The Insight Partners
ページ情報: 英文 132 Pages
納期: 即納可能
|

全表示
- 概要
- 図表
- 目次
アジア太平洋の鉱業用化学品市場は、2022年に60億1,378万米ドルと評価され、2030年には88億8,717万米ドルに達し、2022年から2030年までのCAGRで5.0%の成長が予測されています。
世界の鉱業セクターにおける投資と操業の増加がアジア太平洋鉱業用化学品市場を促進
世界の鉱業活動の増加により、鉱業用化学品の需要が高まっています。さらに、自動化やデジタル化などの先進的な採掘技術の採用により、採掘作業の効率性と環境の持続可能性が世界的に向上しています。世界銀行によると、黒鉛、リチウム、コバルトの生産量は、クリーンエネルギー技術の需要増に対応するため、2050年までに~500%増加すると予想されています。
この地域では、新たな鉱物鉱床の発見、インフラ整備の進展、鉱物・資源需要の増加により、鉱業活動が活発化しています。オーストラリア、中国、チェコ、ポルトガル、米国、カナダ、その他の国々の政府や組織は、探査や採掘活動を積極的に推進しています。グリーン金融開発センターの報告書によると、中国における金属・鉱業への投資は2023年上半期に100億米ドルに達し、2022年同期比で131%増加しました。さらに2023年10月、豪州政府は豪州輸出金融が管理する重要鉱物ファシリティに39億米ドルを追加投資しました。この資金は、オーストラリアの「重要鉱物戦略2023-2030」に沿った鉱業プロジェクトへの支援を目標としていました。鉱業セクターの拡大活動と投資の増加が鉱業用化学品の需要を牽引しています。
アジア太平洋の鉱業用化学品市場の概要
アジア太平洋には、Mitsubishi Materials Corporation, Jiangxi Copper Co Ltd, Aluminum Corporation of China Ltd, Coal India Limited, China Molybdenum Co Ltd, BHPなどの大手鉱山会社が存在します。アジア太平洋には、グリーン鉱山(中国)、サンガッタ鉱山(インドネシア)、ヘイダイゴウ鉱山(中国)、オユトルゴイ銅金鉱山(モンゴル)、ゲブラOC鉱山(インド)、レトパダウン銅鉱山(ミャンマー)、リー鉱山(タイ)、FTBプロジェクト(タイ)、パシル鉱山(インドネシア)という10の主要な露天掘りプロジェクトがあります。米国地質調査所が2022年に発表した報告書によると、中国は2021年、世界数カ国に対する25品目の非燃料鉱物の最大の供給国でした。さらに、中国はリストアップされた25種類の鉱物のうち、16種類の重要鉱物の生産国でもあります。ノルウェー国際問題研究所が2022年に行った調査によると、中央アジアは世界のマンガン鉱石埋蔵量の38.6%、クロム30.07%、鉛20%、亜鉛12.6%、チタン8.7%、アルミニウム5.8%、銅5.3%を記録しました。
中国、タジキスタン、オーストラリア、ベトナムなどが世界の主要アンチモン鉱山の生産量と埋蔵量を占めています。オーストリア連邦省共和国が発表した「世界鉱業データ2022」報告書によれば、オーストラリアにおける鉱物の鉱業生産率は、2000年から2020年の間に142.2%の上昇を記録しました。国際エネルギー機関(IEA)によると、中国企業は重要な鉱物探査、特にリチウムプロジェクトへの投資を倍増させました。鉱業用化学品の需要は、この地域における採掘事業と鉱物探査活動に正比例します。したがって、鉱業事業の成長は、アジア太平洋の鉱業用化学品の需要を強化しています。
アジア太平洋の鉱業用化学品市場の収益と2030年までの予測(金額)
アジア太平洋の鉱業用化学品市場のセグメンテーション
アジア太平洋の鉱業用化学品市場は、タイプ、鉱物タイプ、用途、国によって区分されます。
タイプ別では、アジア太平洋の鉱業用化学品市場は、浮遊化学品、溶媒抽出剤、粉砕助剤、その他にセグメント化されます。浮遊化学品セグメントは、フロサー、凝集剤、抑圧剤、捕集剤、その他に細分化されます。2022年には、浮遊化学品セグメントが最大のシェアを占めています。
鉱物タイプ別に見ると、アジア太平洋の鉱業用化学品市場は卑金属、非金属鉱物、貴金属、その他に区分されます。非金属鉱物セグメントが2022年に最大のシェアを占めました。
用途別では、アジア太平洋の鉱業用化学品市場は鉱物処理、廃水処理、その他に区分されます。鉱物処理セグメントが2022年に最大のシェアを占めました。
国別では、アジア太平洋の鉱業用化学品市場は、オーストラリア、中国、インド、日本、韓国、その他アジア太平洋地域に分類されます。2022年のアジア太平洋鉱業用化学品市場は中国が支配的でした。
Orica Ltd、Kemira Oyj、BASF SE、Clariant AG、Dow Inc、AECI Ltd、Nouryon Chemicals Holding BV、Solvay SA、Arkema SAは、アジア太平洋の鉱業用化学品市場で事業を展開している大手企業の一部です。
目次
第1章 イントロダクション
第2章 エグゼクティブサマリー
- 主要洞察
- 市場の魅力
- 市場の魅力
第3章 調査手法
- 調査範囲
- 2次調査
- 1次調査
第4章 アジア太平洋の鉱業用化学品市場情勢
- ポーターのファイブフォース分析
- 供給企業の交渉力
- 買い手の交渉力
- 新規参入業者の脅威
- 競争企業間の敵対関係
- 代替品の脅威
- エコシステム分析
- 原材料サプライヤー
- メーカー
- 流通業者または供給業者
- 最終用途産業
- バリューチェーンのベンダー一覧
第5章 アジア太平洋の鉱業用化学品市場:主要市場力学
- 市場促進要因
- ハイエンド製品製造における金属・鉱物需要の増大
- 世界の鉱業セクターにおける投資と操業の増加
- 市場抑制要因
- 危険な鉱業用化学品に関連する厳しい政府規制
- 市場機会
- レアアース探鉱活動の活発化
- 今後の動向
- 環境に優しい鉱業化学ソリューションの開発
- 影響分析
第6章 鉱業用化学品市場:アジア太平洋の市場分析
- アジア太平洋鉱業用化学品市場の収益、2022年~2030年
- アジア太平洋鉱業用化学品市場の予測と分析
第7章 アジア太平洋の鉱業用化学品市場分析:タイプ別
- 浮遊化学品
- フロサー
- 凝集剤
- 抑圧剤
- 捕集剤
- その他
- 溶媒抽出剤
- 粉砕助剤
- その他
第8章 アジア太平洋の鉱業用化学品市場分析:鉱物タイプ別
- 卑金属
- 非金属鉱物
- 貴金属
- その他
第9章 アジア太平洋の鉱業用化学品市場分析:用途別
- 鉱物処理
- 廃水処理
- その他
第10章 アジア太平洋の鉱業用化学品市場:国別分析
- アジア太平洋の鉱業用化学品市場の収益と予測:国別分析
- オーストラリア
- 中国
- インド
- 日本
- 韓国
- その他アジア太平洋地域
第11章 業界情勢
- 製品の発売
- その他の戦略と展開
第12章 企業プロファイル
- Orica Ltd
- Kemira Oyj
- BASF SE
- Clariant AG
- Dow Inc
- AECI Ltd
- Nouryon Chemicals Holding BV
- Solvay SA
- Arkema SA
第13章 付録
List Of Tables
- Table 1. Asia Pacific Mining Chemicals Market Segmentation
- Table 2. List of Raw Material Suppliers
- Table 3. Asia Pacific Mining Chemicals Market Revenue and Forecasts to 2030 (US$ Million)
- Table 4. Asia Pacific Mining Chemicals Market Volume and Forecasts to 2030 (Kilo tons) - Type
- Table 5. Asia Pacific Mining Chemicals Market Revenue and Forecasts to 2030 (US$ Million) - Type
- Table 6. Asia Pacific Mining Chemicals Market Revenue and Forecasts to 2030 (US$ Million) - Mineral Type
- Table 7. Asia Pacific Mining Chemicals Market Revenue and Forecasts to 2030 (US$ Million) - Application
- Table 8. Australia Mining Chemicals Market Volume and Forecasts to 2030 (Kilo tons) - By Type
- Table 9. Australia Mining Chemicals Market Revenue and Forecasts to 2030 (US$ Million) - By Type
- Table 10. Australia Mining Chemicals Market Revenue and Forecasts to 2030 (US$ Million) - By Mineral Type
- Table 11. Australia Mining Chemicals Market Revenue and Forecasts to 2030 (US$ Million) - By Application
- Table 12. China Mining Chemicals Market Volume and Forecasts to 2030 (Kilo tons) - By Type
- Table 13. China Mining Chemicals Market Revenue and Forecasts to 2030 (US$ Million) - By Type
- Table 14. China Mining Chemicals Market Revenue and Forecasts to 2030 (US$ Million) - By Mineral Type
- Table 15. China Mining Chemicals Market Revenue and Forecasts to 2030 (US$ Million) - By Application
- Table 16. India Mining Chemicals Market Volume and Forecasts to 2030 (Kilo tons) - By Type
- Table 17. India Mining Chemicals Market Revenue and Forecasts to 2030 (US$ Million) - By Type
- Table 18. India Mining Chemicals Market Revenue and Forecasts to 2030 (US$ Million) - By Mineral Type
- Table 19. India Mining Chemicals Market Revenue and Forecasts to 2030 (US$ Million) - By Application
- Table 20. Japan Mining Chemicals Market Volume and Forecasts to 2030 (Kilo tons) - By Type
- Table 21. Japan Mining Chemicals Market Revenue and Forecasts to 2030 (US$ Million) - By Type
- Table 22. Japan Mining Chemicals Market Revenue and Forecasts to 2030 (US$ Million) - By Mineral Type
- Table 23. Japan Mining Chemicals Market Revenue and Forecasts to 2030 (US$ Million) - By Application
- Table 24. South Korea Mining Chemicals Market Revenue and Forecasts to 2030 (US$ Million) - By Type
- Table 25. South Korea Mining Chemicals Market Revenue and Forecasts to 2030 (US$ Million) - By Type
- Table 26. South Korea Mining Chemicals Market Revenue and Forecasts to 2030 (US$ Million) - By Mineral Type
- Table 27. South Korea Mining Chemicals Market Revenue and Forecasts to 2030 (US$ Million) - By Application
- Table 28. Rest of Asia Pacific Mining Chemicals Market Volume and Forecasts to 2030 (Kilo tons) - By Type
- Table 29. Rest of Asia Pacific Mining Chemicals Market Revenue and Forecasts to 2030 (US$ Million) - By Type
- Table 30. Rest of Asia Pacific Mining Chemicals Market Revenue and Forecasts to 2030 (US$ Million) - By Mineral Type
- Table 31. Rest of Asia Pacific Mining Chemicals Market Revenue and Forecasts to 2030 (US$ Million) - By Application
List Of Figures
- Figure 1. Asia Pacific Mining Chemicals Market Segmentation, By Country
- Figure 2. Porter's Five Forces Analysis
- Figure 3. Ecosystem: Asia Pacific Mining Chemicals Market
- Figure 4. Asia Pacific Mining Chemicals Market Impact Analysis of Drivers and Restraints
- Figure 5. Asia Pacific Mining Chemicals Market Revenue (US$ Million), 2022 - 2030
- Figure 6. Asia Pacific Mining Chemicals Market Share (%) - Type, 2022 and 2030
- Figure 7. Flotation Chemicals Market Revenue and Forecasts to 2030 (US$ Million)
- Figure 8. Flotation Chemicals Market Volume and Forecasts to 2030 (Kilo tons)
- Figure 9. Frothers Market Revenue and Forecasts to 2030 (US$ Million)
- Figure 10. Frothers Market Volume and Forecasts to 2030 (Kilo tons)
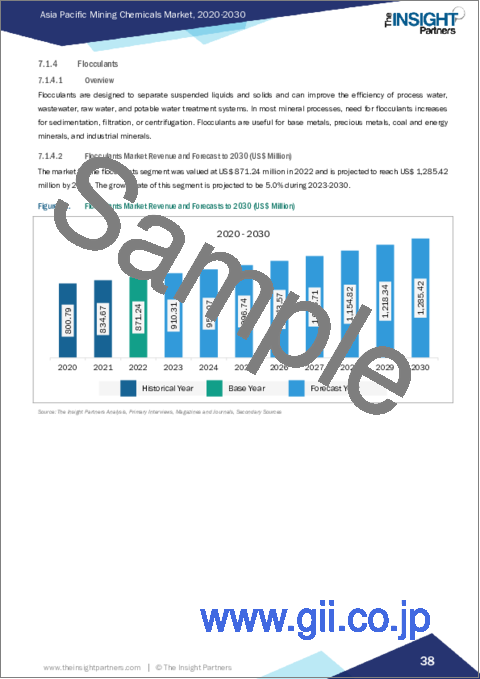
- Figure 11. Flocculants Market Revenue and Forecasts to 2030 (US$ Million)
- Figure 12. Flocculants Market Volume and Forecasts to 2030 (Kilo tons)
- Figure 13. Depressants Market Revenue and Forecasts to 2030 (US$ Million)
- Figure 14. Depressants Market Volume and Forecasts to 2030 (Kilo tons)
- Figure 15. Collectors Market Revenue and Forecasts to 2030 (US$ Million)
- Figure 16. Collectors Market Volume and Forecasts to 2030 (Kilo tons)
- Figure 17. Others Market Revenue and Forecasts to 2030 (US$ Million)
- Figure 18. Others Market Volume and Forecasts to 2030 (Kilo tons)
- Figure 19. Solvent Extractants Market Revenue and Forecasts to 2030 (US$ Million)
- Figure 20. Solvent Extractants Market Volume and Forecasts to 2030 (Kilo tons)
- Figure 21. Grinding Aids Market Revenue and Forecasts to 2030 (US$ Million)
- Figure 22. Grinding Aids Market Volume and Forecasts to 2030 (Kilo tons)
- Figure 23. Others Market Revenue and Forecasts to 2030 (US$ Million)
- Figure 24. Others Market Volume and Forecasts to 2030 (Kilo tons)
- Figure 25. Asia Pacific Mining Chemicals Market Share (%) - Mineral Type, 2022 and 2030
- Figure 26. Base Metals Market Revenue and Forecasts to 2030 (US$ Million)
- Figure 27. Non-Metallic Minerals Market Revenue and Forecasts to 2030 (US$ Million)
- Figure 28. Precious Metals Market Revenue and Forecasts to 2030 (US$ Million)
- Figure 29. Others Market Revenue and Forecasts to 2030 (US$ Million)
- Figure 30. Asia Pacific Mining Chemicals Market Share (%) - Application, 2022 and 2030
- Figure 31. Mineral Processing Market Revenue and Forecasts to 2030 (US$ Million)
- Figure 32. Wastewater Treatment Market Revenue and Forecasts to 2030 (US$ Million)
- Figure 33. Others Market Revenue and Forecasts to 2030 (US$ Million)
- Figure 34. Asia Pacific Mining Chemicals Market Breakdown, by Key Countries, 2022 (US$)
- Figure 35. Mining Chemicals market Breakdown by Key Countries, 2022 and 2030 (%)
- Figure 36. Australia Mining Chemicals Market Volume and Forecasts to 2030 (Kilo tons)
- Figure 37. Australia Mining Chemicals Market Revenue and Forecasts to 2030 (US$ Million)
- Figure 38. China Mining Chemicals Market Volume and Forecasts to 2030 (Kilo tons)
- Figure 39. China Mining Chemicals Market Revenue and Forecasts to 2030 (US$ Million)
- Figure 40. India Mining Chemicals Market Volume and Forecasts to 2030 (Kilo tons)
- Figure 41. India Mining Chemicals Market Revenue and Forecasts to 2030 (US$ Million)
- Figure 42. Japan Mining Chemicals Market Volume and Forecasts to 2030 (Kilo tons)
- Figure 43. Japan Mining Chemicals Market Revenue and Forecasts to 2030 (US$ Million)
- Figure 44. South Korea Mining Chemicals Market Volume and Forecasts to 2030 (Kilo tons)
- Figure 45. South Korea Mining Chemicals Market Revenue and Forecasts to 2030 (US$ Million)
- Figure 46. Rest of Asia Pacific Mining Chemicals Market Volume and Forecasts to 2030 (Kilo tons)
- Figure 47. Rest of Asia Pacific Mining Chemicals Market Revenue and Forecasts to 2030 (US$ Million)
The Asia Pacific mining chemicals market was valued at US$ 6,013.78 million in 2022 and is expected to reach US$ 8,887.17 million by 2030; it is estimated to register at a CAGR of 5.0% from 2022 to 2030.
Increasing Investments and Operations in Global Mining Sector Boost Asia Pacific Mining Chemicals Market
The increase in mining activities worldwide has resulted in rising demand for mining chemicals. Further, the adoption of advanced mining technologies, such as automation and digitization, improves efficiency and environmental sustainability in mining operations globally. According to the World Bank, production of graphite, lithium, and cobalt is expected to rise by ~500% by 2050 to meet the growing demand for clean energy technologies.
The region is witnessing an increase in mining activities due to the discovery of new mineral deposits, growing infrastructure developments, and increasing demand for minerals and resources. Governments and organizations in countries such as Australia, China, the Czech Republic, Portugal, the US, Canada, and others are actively promoting exploration and mining activities. As per a report by the Green Finance and Development Centre, investments in the metals and mining industries in China reached US$ 10 billion in the first half of 2023, a rise of 131% compared to the same period in 2022. Further, in October 2023, the government of Australia invested an additional US$ 3.9 billion in the Export Finance Australia-managed Critical Minerals Facility. The funding targeted support for mining projects aligned with Australia's Critical Minerals Strategy 2023-2030. The expansion activities and rising investments in the mining sector drive the demand for mining chemicals.
Asia Pacific Mining Chemicals Market Overview
Asia Pacific marks the presence of major mining companies such as Mitsubishi Materials Corporation, Jiangxi Copper Co Ltd, Aluminum Corporation of China Ltd, Coal India Limited, China Molybdenum Co Ltd, BHP, and others. Asia Pacific has 10 major surface mining projects-Green mine (China), Sangatta mine (Indonesia), Heidaigou mine (China), Oyu Tolgoi Copper-Gold mine (Mongolia), Gevra OC mine (India), Letpadaung Copper mine (Myanmar), Li mine (Thailand), FTB Project (Thailand), and Pasir mine (Indonesia). According to the report published by the US Geological Survey in 2022, China was the largest supplier of 25 non-fuel mineral commodities to several countries globally in 2021. Additionally, China is the producer of 16 critical minerals out of 25 listed minerals. According to research conducted by the Norwegian Institute of International Affairs in 2022, Central Asia recorded a presence of 38.6% of global manganese ore reserves, 30.07% of chromium, 20% of lead, 12.6% of zinc, 8.7% of titanium, 5.8% of aluminum, and 5.3% of copper.
China, Tajikistan, Australia, Vietnam, and other countries account for major antimony mine production and reserves worldwide. As per the World Mining Data 2022 report released by the Federal Ministry Republic of Austria, the mining production rate for minerals in Australia recorded a rise of 142.2% during 2000-2020. As per the International Energy Agency, Chinese companies doubled their investments in critical mineral exploration, especially in lithium projects. The demand for mining chemicals is directly proportional to the mining operations and mineral exploration activities in the region. Therefore, growth in mining operations bolsters the demand for mining chemicals in Asia Pacific.
Asia Pacific Mining Chemicals Market Revenue and Forecast to 2030 (US$ Million)
Asia Pacific Mining Chemicals Market Segmentation
The Asia Pacific mining chemicals market is segmented based on type, mineral type, application, and country.
In terms of type, the Asia Pacific mining chemicals market is segmented into flotation chemicals, solvent extractants, grinding aids, and others. The flotation chemicals segment is sub-segmented into frothers, flocculants, depressants, collectors, and others. The flotation chemicals segment held the largest share in 2022.
By mineral type, the Asia Pacific mining chemicals market is segmented into base metals, non-metallic minerals, precious metals, and others. The non-metallic minerals segment held the largest share in 2022.
In terms of application, the Asia Pacific mining chemicals market is segmented into mineral processing, wastewater treatment, and others. The mineral processing segment held the largest share in 2022.
Based on country, the Asia Pacific mining chemicals market is categorized into Australia, China, India, Japan, South Korea, and the Rest of Asia Pacific. China dominated the Asia Pacific mining chemicals market in 2022.
Orica Ltd, Kemira Oyj, BASF SE, Clariant AG, Dow Inc, AECI Ltd, Nouryon Chemicals Holding BV, Solvay SA, and Arkema SA are some of the leading companies operating in the Asia Pacific mining chemicals market.
Table Of Contents
1. Introduction
- 1.1 The Insight Partners Research Report Guidance
- 1.2 Market Segmentation
2. Executive Summary
- 2.1 Key Insights
- 2.2 Market Attractiveness
- 2.2.1 Market Attractiveness
3. Research Methodology
- 3.1 Coverage
- 3.2 Secondary Research
- 3.3 Primary Research
4. Asia Pacific Mining Chemicals Market Landscape
- 4.1 Overview
- 4.2 Porter's Five Forces Analysis
- 4.2.1 Bargaining Power of Suppliers
- 4.2.2 Bargaining Power of Buyers
- 4.2.3 Threat of New Entrants
- 4.2.4 Competitive Rivalry
- 4.2.5 Threat of Substitutes
- 4.3 Ecosystem Analysis
- 4.3.1 Raw Material Suppliers:
- 4.3.2 Manufacturers:
- 4.3.3 Distributors or Suppliers:
- 4.3.4 End Use Industry:
- 4.4 List of Vendors in the Value Chain
5. Asia Pacific Mining Chemicals Market - Key Market Dynamics
- 5.1 Market Drivers
- 5.1.1 Growing Demand for Metals and Minerals in High-End Product Manufacturing
- 5.1.2 Increasing Investments and Operations in Global Mining Sector
- 5.2 Market Restraints
- 5.2.1 Stringent Government Regulations Related to Hazardous Mining Chemicals
- 5.3 Market Opportunities
- 5.3.1 Rising Exploration Activities of Rare Earth Metals
- 5.4 Future Trends
- 5.4.1 Development of Environment-Friendly Mining Chemical Solutions
- 5.5 Impact Analysis
6. Mining Chemicals Market - Asia Pacific Market Analysis
- 6.1 Asia Pacific Mining Chemicals Market Revenue (US$ Million), 2022 - 2030
- 6.2 Asia Pacific Mining Chemicals Market Forecast and Analysis
7. Asia Pacific Mining Chemicals Market Analysis - Type
- 7.1 Flotation Chemicals
- 7.1.1 Overview
- 7.1.2 Flotation Chemicals Market Revenue and Forecast to 2030 (US$ Million)
- 7.1.2.1 Flotation Chemicals Market Volume and Forecast to 2030 (Kilo tons)
- 7.1.3 Frothers
- 7.1.3.1 Overview
- 7.1.3.2 Frothers Market Revenue and Forecast to 2030 (US$ Million)
- 7.1.3.3 Frothers Market Volume and Forecast to 2030 (Kilo tons)
- 7.1.4 Flocculants
- 7.1.4.1 Overview
- 7.1.4.2 Flocculants Market Revenue and Forecast to 2030 (US$ Million)
- 7.1.4.3 Flocculants Market Volume and Forecast to 2030 (Kilo tons)
- 7.1.5 Depressants
- 7.1.5.1 Overview
- 7.1.5.2 Depressants Market Revenue and Forecast to 2030 (US$ Million)
- 7.1.5.3 Depressants Market Volume and Forecast to 2030 (Kilo tons)
- 7.1.6 Collectors
- 7.1.6.1 Overview
- 7.1.6.2 Collectors Market Revenue and Forecast to 2030 (US$ Million)
- 7.1.6.3 Collectors Market Volume and Forecast to 2030 (Kilo tons)
- 7.1.7 Others
- 7.1.7.1 Overview
- 7.1.7.2 Others Market Revenue and Forecast to 2030 (US$ Million)
- 7.1.7.3 Others Market Volume and Forecast to 2030 (Kilo tons)
- 7.2 Solvent Extractants
- 7.2.1 Overview
- 7.2.1.1 Solvent Extractants Market Revenue and Forecast to 2030 (US$ Million)
- 7.2.1.2 Solvent Extractants Market Volume and Forecast to 2030 (Kilo tons)
- 7.2.1 Overview
- 7.3 Grinding Aids
- 7.3.1 Overview
- 7.3.1.1 Grinding Aids Market Revenue and Forecast to 2030 (US$ Million)
- 7.3.1.2 Grinding Aids Market Volume and Forecast to 2030 (Kilo tons)
- 7.3.1 Overview
- 7.4 Others
- 7.4.1 Overview
- 7.4.1.1 Others Market Revenue and Forecast to 2030 (US$ Million)
- 7.4.1.2 Others Market Volume and Forecast to 2030 (Kilo tons)
- 7.4.1 Overview
8. Asia Pacific Mining Chemicals Market Analysis - Mineral Type
- 8.1 Base Metals
- 8.1.1 Overview
- 8.1.1.1 Base Metals Market Revenue and Forecast to 2030 (US$ Million)
- 8.1.1 Overview
- 8.2 Non-Metallic Minerals
- 8.2.1 Overview
- 8.2.1.1 Non-metallic minerals Market Revenue and Forecast to 2030 (US$ Million)
- 8.2.1 Overview
- 8.3 Precious Metals
- 8.3.1 Overview
- 8.3.1.1 Precious Metals Market Revenue and Forecast to 2030 (US$ Million)
- 8.3.1 Overview
- 8.4 Others
- 8.4.1 Overview
- 8.4.1.1 Others Market Revenue and Forecast to 2030 (US$ Million)
- 8.4.1 Overview
9. Asia Pacific Mining Chemicals Market Analysis - Application
- 9.1 Mineral Processing
- 9.1.1 Overview
- 9.1.1.1 Mineral Processing Market Revenue and Forecast to 2030 (US$ Million)
- 9.1.1 Overview
- 9.2 Wastewater Treatment
- 9.2.1 Overview
- 9.2.1.1 Wastewater Treatment Market Revenue and Forecast to 2030 (US$ Million)
- 9.2.1 Overview
- 9.3 Others
- 9.3.1 Overview
- 9.3.1.1 Others Market Revenue and Forecast to 2030 (US$ Million)
- 9.3.1 Overview
10. Asia Pacific Mining Chemicals Market - Country Analysis
- 10.1.1 Asia Pacific Mining Chemicals Market Revenue and Forecasts and Analysis - By Countries
- 10.1.1.1 Mining Chemicals market Breakdown by Country
- 10.1.1.2 Australia Mining Chemicals Market Volume and Forecasts to 2030 (Kilo tons)
- 10.1.1.3 Australia Mining Chemicals Market Revenue and Forecasts to 2030 (US$ Million)
- 10.1.1.3.1 Australia Mining Chemicals Market Breakdown by Type
- 10.1.1.3.2 Australia Mining Chemicals Market Breakdown by Type
- 10.1.1.3.3 Australia Mining Chemicals Market Breakdown by Mineral Type
- 10.1.1.3.4 Australia Mining Chemicals Market Breakdown by Application
- 10.1.1.4 China Mining Chemicals Market Volume and Forecasts to 2030 (Kilo tons)
- 10.1.1.5 China Mining Chemicals Market Revenue and Forecasts to 2030 (US$ Million)
- 10.1.1.5.1 China Mining Chemicals Market Breakdown by Type
- 10.1.1.5.2 China Mining Chemicals Market Breakdown by Type
- 10.1.1.5.3 China Mining Chemicals Market Breakdown by Mineral Type
- 10.1.1.5.4 China Mining Chemicals Market Breakdown by Application
- 10.1.1.6 India Mining Chemicals Market Volume and Forecasts to 2030 (Kilo tons)
- 10.1.1.7 India Mining Chemicals Market Revenue and Forecasts to 2030 (US$ Million)
- 10.1.1.7.1 India Mining Chemicals Market Breakdown by Type
- 10.1.1.7.2 India Mining Chemicals Market Breakdown by Type
- 10.1.1.7.3 India Mining Chemicals Market Breakdown by Mineral Type
- 10.1.1.7.4 India Mining Chemicals Market Breakdown by Application
- 10.1.1.8 Japan Mining Chemicals Market Volume and Forecasts to 2030 (Kilo tons)
- 10.1.1.9 Japan Mining Chemicals Market Revenue and Forecasts to 2030 (US$ Million)
- 10.1.1.9.1 Japan Mining Chemicals Market Breakdown by Type
- 10.1.1.9.2 Japan Mining Chemicals Market Breakdown by Type
- 10.1.1.9.3 Japan Mining Chemicals Market Breakdown by Mineral Type
- 10.1.1.9.4 Japan Mining Chemicals Market Breakdown by Application
- 10.1.1.10 South Korea Mining Chemicals Market Volume and Forecasts to 2030 (Kilo tons)
- 10.1.1.11 South Korea Mining Chemicals Market Revenue and Forecasts to 2030 (US$ Million)
- 10.1.1.11.1 South Korea Mining Chemicals Market Breakdown by Type
- 10.1.1.11.2 South Korea Mining Chemicals Market Breakdown by Type
- 10.1.1.11.3 South Korea Mining Chemicals Market Breakdown by Mineral Type
- 10.1.1.11.4 South Korea Mining Chemicals Market Breakdown by Application
- 10.1.1.12 Rest of Asia Pacific Mining Chemicals Market Volume and Forecasts to 2030 (Kilo tons)
- 10.1.1.13 Rest of Asia Pacific Mining Chemicals Market Revenue and Forecasts to 2030 (US$ Million)
- 10.1.1.13.1 Rest of Asia Pacific Mining Chemicals Market Breakdown by Type
- 10.1.1.13.2 Rest of Asia Pacific Mining Chemicals Market Breakdown by Type
- 10.1.1.13.3 Rest of Asia Pacific Mining Chemicals Market Breakdown by Mineral Type
- 10.1.1.13.4 Rest of Asia Pacific Mining Chemicals Market Breakdown by Application
11. Industry Landscape
- 11.1 Overview
- 11.2 Product launch
- 11.3 Other Strategies and Developments
12. Company Profiles
- 12.1 Orica Ltd
- 12.1.1 Key Facts
- 12.1.2 Business Description
- 12.1.3 Products and Services
- 12.1.4 Financial Overview
- 12.1.5 SWOT Analysis
- 12.1.6 Key Developments
- 12.2 Kemira Oyj
- 12.2.1 Key Facts
- 12.2.2 Business Description
- 12.2.3 Products and Services
- 12.2.4 Financial Overview
- 12.2.5 SWOT Analysis
- 12.2.6 Key Developments
- 12.3 BASF SE
- 12.3.1 Key Facts
- 12.3.2 Business Description
- 12.3.3 Products and Services
- 12.3.4 Financial Overview
- 12.3.5 SWOT Analysis
- 12.3.6 Key Developments
- 12.4 Clariant AG
- 12.4.1 Key Facts
- 12.4.2 Business Description
- 12.4.3 Products and Services
- 12.4.4 Financial Overview
- 12.4.5 SWOT Analysis
- 12.4.6 Key Developments
- 12.5 Dow Inc
- 12.5.1 Key Facts
- 12.5.2 Business Description
- 12.5.3 Products and Services
- 12.5.4 Financial Overview
- 12.5.5 SWOT Analysis
- 12.5.6 Key Developments
- 12.6 AECI Ltd
- 12.6.1 Key Facts
- 12.6.2 Business Description
- 12.6.3 Products and Services
- 12.6.4 Financial Overview
- 12.6.5 SWOT Analysis
- 12.6.6 Key Developments
- 12.7 Nouryon Chemicals Holding BV
- 12.7.1 Key Facts
- 12.7.2 Business Description
- 12.7.3 Products and Services
- 12.7.4 Financial Overview
- 12.7.5 SWOT Analysis
- 12.7.6 Key Developments
- 12.8 Solvay SA
- 12.8.1 Key Facts
- 12.8.2 Business Description
- 12.8.3 Products and Services
- 12.8.4 Financial Overview
- 12.8.5 SWOT Analysis
- 12.8.6 Key Developments
- 12.9 Arkema SA
- 12.9.1 Key Facts
- 12.9.2 Business Description
- 12.9.3 Products and Services
- 12.9.4 Financial Overview
- 12.9.5 SWOT Analysis
- 12.9.6 Key Developments

