|
|
市場調査レポート
商品コード
1481951
欧州のビジュアライゼーションと3Dレンダリングソフトウェア:2030年までの市場予測 - 地域分析 - 用途、展開、エンドユーザー別Europe Visualization & 3D Rendering Software Market Forecast to 2030 - Regional Analysis - by Application, Deployment, and End User |
||||||
|
|||||||
|
|||||||


| 欧州のビジュアライゼーションと3Dレンダリングソフトウェア:2030年までの市場予測 - 地域分析 - 用途、展開、エンドユーザー別 |
|
出版日: 2024年03月04日
発行: The Insight Partners
ページ情報: 英文 104 Pages
納期: 即納可能
|

全表示
- 概要
- 図表
- 目次
欧州のビジュアライゼーションと3Dレンダリングソフトウェア市場は、2022年の8億1,608万米ドルから2030年には36億9,337万米ドルに成長すると予測されています。2022年から2030年までのCAGRは20.8%と推定されています。
ゲームとビデオ撮影の需要急増が欧州のビジュアライゼーションと3Dレンダリングソフトウェア市場を活性化
デジタル化、アクセシビリティの向上、新しいゲーム技術の使いやすさがゲーム業界を牽引する一方で、3Dモデリングはゲーム業界に革命をもたらしました。European Gaming and Betting Association(EGBA)のデータによると、欧州におけるeスポーツゲームの収益は2021年に米国1億米ドルに達しました。2022年11月、ドイツゲーム産業協会は、ドイツのゲーム分野の発展に2,000万米ドルを投資しました。ほぼすべてのハイエンドゲームが3Dを採用、または3Dアセットを使用しています。ゲームは3D技術によって、よりリアルで魅力的なものになった。
ゲーマーをバーチャルの世界に完全に没入させるためには、シーンや小道具、人物がリアルに見える必要があります。3Dレンダリングは、グラフィックの向上に役立ちます。当初、3Dデザインツールは、ゲーム開発者がPCゲームやコンソールゲームを開発するために広く使用されていました。しかし、モバイル・マイクロプロセッサの処理能力が徐々に向上しているため、開発者はモバイル・ゲーム業界で3Dデザイン・ツールを使用しています。さらに、スマートフォンの低価格化とインターネットサービスの世界の普及により、モバイルゲーム産業が発展しています。さらに、エレクトロニック・アーツやアクティビジョン・ブリザードといった大手ゲーム会社が、前年比増収と市場浸透率の向上を発表したことで、COVID-19の大流行がゲーム業界を大きく後押ししました。
映画産業とゲーム産業は、臨場感あふれる体験をもたらすコンピューター生成画像に依存するようになった。アニメーションや映画は、3D設計ツールの重要な用途の1つです。長い間、3D設計ツールはアニメーションや映画で広く使用されてきました。しかし、世界のSFジャンルの動向の高まりにより、3Dデザインツールの採用が増加しています。コンテンツ制作業界、小規模なプロダクション、個人プロフェッショナルは、より広いレベルで3Dデザインツールを活用しています。一方、中小企業によるアニメーション広告コンテンツの展開が世界的に拡大していることも、ビジュアライゼーションと3Dレンダリングソフトウェア市場の成長を後押ししています。
欧州のビジュアライゼーションと3Dレンダリングソフトウェア市場概要
EUで活動する業界は、ダイナミックに変化する技術情勢に対応しなければならないというプレッシャーにさらされ続けています。このような技術の浸透の増加は、目的のインフラストラクチャや製品の設計と構築に複雑さをもたらしています。設計とモデル構築のプロセスを理解し、同じプロセスを合理化するために、さまざまな業界の企業が、革新的なアイデアのインタラクティブな設計と視覚化を促進するIT製品に多額の投資を行っています。欧州はまた、ヘルスケア、製薬、自動車、エネルギー・電力、インフラ・建設、半導体・エレクトロニクスの各分野で主要な用途を持つ高精度工業製品の拠点でもあります。したがって、欧州における工業化の進展は、視覚化ツールや3Dレンダリングツールなどの設計・エンジニアリングソリューションの採用を促進する主要な要因の1つとなっています。また、特にグーグル、ヒューレット・パッカード、IBMなどのハイテク大手によるAIへの大規模なシフトが、ビジュアライゼーションおよび3Dレンダリングソフトウェア市場の成長をさらに促進しています。2022年2月、ダッソー・システムズは、ライフサイクル・アセスメント・ツール「サステイナブル・イノベーション・インテリジェンス」を発表しました。ダッソー・システムズの3Dエクスペリエンス・プラットフォームに完全に統合され、バリュー・チェーン全体をカバーするこのクラウド・ベース・ソリューションは、18,000を超える産業および農業プロセスの影響に関するecoinventデータベースを仮想設計、製品開発、製造エンジニアリング、オペレーション、ロジスティクスに統合します。このように、前述のすべての要因が、欧州のビジュアライゼーションと3Dレンダリングソフトウェア市場の成長を促進しています。
欧州のビジュアライゼーションと3Dレンダリングソフトウェア市場の収益と2030年までの予測
欧州のビジュアライゼーションと3Dレンダリングソフトウェア市場セグメンテーション
欧州のビジュアライゼーションと3Dレンダリングソフトウェア市場は、用途、展開、エンドユーザー、国にセグメント化されます。
用途別では、欧州のビジュアライゼーションと3Dレンダリングソフトウェア市場は、トレーニングシミュレーション、マーケティング&広告、ビデオゲーム、製品ビジュアライゼーション、建築ビジュアライゼーションに区分されます。建築ビジュアライゼーションセグメントは、2022年に欧州ビジュアライゼーションと3Dレンダリングソフトウェア市場で最大のシェアを占めました。
展開に基づき、欧州のビジュアライゼーションと3Dレンダリングソフトウェア市場はオンプレミスとクラウドに区分されます。2022年の欧州ビジュアライゼーションと3Dレンダリングソフトウェア市場では、オンプレミスセグメントが大きなシェアを占めています。
エンドユーザー別に見ると、欧州のビジュアライゼーションと3Dレンダリングソフトウェア市場は、メディア&エンターテインメント、建築&建設、デザイン&エンジニアリング、ヘルスケア、その他に区分されます。建築・建設セグメントが2022年の欧州ビジュアライゼーションと3Dレンダリングソフトウェア市場で最大のシェアを占めています。
国別では、欧州のビジュアライゼーションと3Dレンダリングソフトウェア市場は、フランス、ドイツ、英国、イタリア、スペイン、その他欧州に区分されます。2022年の欧州ビジュアライゼーションと3Dレンダリングソフトウェア市場は英国が独占しています。
Act-3D、Autodesk Inc、Chaos Group、Christie Digital Systems、Dassault Systemes SE、Luxion Inc、Next Limit、NVIDIA Corp、Thea Render by Altairは、欧州のビジュアライゼーションと3Dレンダリングソフトウェア市場で事業を展開している大手企業です。
目次
第1章 イントロダクション
第2章 エグゼクティブサマリー
- 主要洞察
- 市場の魅力
第3章 調査手法
- 調査範囲
- 2次調査
- 1次調査
第4章 欧州のビジュアライゼーションと3Dレンダリングソフトウェア市場情勢
- エコシステム分析
- サービスプロバイダー
- エンドユーザー業界
- バリューチェーンのベンダー一覧
- 重要考察
- 3Dファイルフォーマットで使用されるデータフォーマットの詳細分析
- OBJ
- ステップ
- COLLADA
- STL
- FBX
- GLTF
- 3DS
- IGES
- 3Dファイルフォーマットで使用されるデータフォーマットの詳細分析
第5章 欧州のビジュアライゼーションと3Dレンダリングソフトウェア市場- 主要産業力学
- 促進要因
- より高速で効率的なソリューションへのニーズの増加
- ゲームとビデオ撮影の需要の急増
- 建設およびインフラ開発の増加
- リアルなビジュアルに対する需要の増加
- 市場抑制要因
- 新興諸国における熟練労働力と支援インフラの不足
- 市場機会
- バーチャルリアリティ(VR)の普及
- 製造業の急拡大とプロトタイピングの必要性
- 医療および科学研究におけるビジュアライゼーションおよび3Dレンダリングソフトウェアの使用の増加
- 今後の動向
- ファクトリーオートメーションの出現
- クラウドベースの技術採用の増加
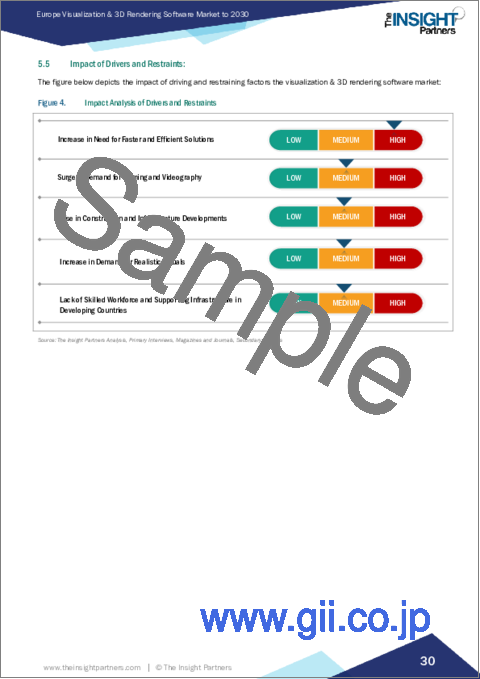
- 促進要因と阻害要因の影響
第6章 ビジュアライゼーションと3Dレンダリングソフトウェア市場-欧州市場分析
- 欧州のビジュアライゼーションと3Dレンダリングソフトウェア市場概要
- 欧州のビジュアライゼーションと3Dレンダリングソフトウェア市場収益、2022年~2030年
- ビジュアライゼーションと3Dレンダリングソフトウェアの欧州市場予測・分析
第7章 ビジュアライゼーションと3Dレンダリングソフトウェアの欧州市場分析:用途
- トレーニングシミュレーション
- マーケティングと広告
- ビデオゲーム
- 製品ビジュアライゼーション
- アーキテクチャのビジュアライゼーション
第8章 欧州のビジュアライゼーションと3Dレンダリングソフトウェア市場分析:展開
- オンプレミス
- クラウド
第9章 欧州のビジュアライゼーションと3Dレンダリングソフトウェア市場分析:エンドユーザー
- メディアとエンターテインメント
- 建築と建設
- 設計とエンジニアリング
- ヘルスケア
- その他
第10章 欧州のビジュアライゼーションと3Dレンダリングソフトウェア市場:国別分析
- 欧州
- フランス
- ドイツ
- 英国
- イタリア
- スペイン
- その他
第11章 業界情勢
- 市場イニシアティブ
- 製品開発
- 合併と買収
第12章 企業プロファイル
- Autodesk Inc
- Christie Digital Systems
- Dassault Systemes SE
- NVIDIA Corp
- Chaos Group
- Luxion Inc.
- Next Limit
- Act-3D
- Thea Render by Altair
第13章 付録
List Of Tables
- Table 1. Europe Visualization & 3D Rendering Software Market Segmentation
- Table 2. Europe Visualization & 3D Rendering Software Market Revenue and Forecasts To 2030 (US$ Million)
- Table 3. Europe Visualization & 3D Rendering Software Market Revenue and Forecasts To 2030 (US$ Million) - Application
- Table 4. Europe Visualization & 3D Rendering Software Market Revenue and Forecasts To 2030 (US$ Million) - Deployment
- Table 5. Europe Visualization & 3D Rendering Software Market Revenue and Forecasts To 2030 (US$ Million) - End User
- Table 6. Europe Visualization & 3D Rendering Software Market, by Country - Revenue and Forecast to 2030 (USD Million)
- Table 7. France: Europe Visualization & 3D Rendering Software Market Revenue and Forecasts To 2030 (US$ Mn) - By Application
- Table 8. France: Europe Visualization & 3D Rendering Software Market Revenue and Forecasts To 2030 (US$ Mn) - By Deployment
- Table 9. France: Europe Visualization & 3D Rendering Software Market Revenue and Forecasts To 2030 (US$ Mn) - By End User
- Table 10. Germany: Europe Visualization & 3D Rendering Software Market Revenue and Forecasts To 2030 (US$ Mn) - By Application
- Table 11. Germany: Europe Visualization & 3D Rendering Software Market Revenue and Forecasts To 2030 (US$ Mn) - By Deployment
- Table 12. Germany: Europe Visualization & 3D Rendering Software Market Revenue and Forecasts To 2030 (US$ Mn) - By End User
- Table 13. UK: Europe Visualization & 3D Rendering Software Market Revenue and Forecasts To 2030 (US$ Mn) - By Application
- Table 14. UK: Europe Visualization & 3D Rendering Software Market Revenue and Forecasts To 2030 (US$ Mn) - By Deployment
- Table 15. UK: Europe Visualization & 3D Rendering Software Market Revenue and Forecasts To 2030 (US$ Mn) - By End User
- Table 16. Italy: Europe Visualization & 3D Rendering Software Market Revenue and Forecasts To 2030 (US$ Mn) - By Application
- Table 17. Italy: Europe Visualization & 3D Rendering Software Market Revenue and Forecasts To 2030 (US$ Mn) - By Deployment
- Table 18. Italy: Europe Visualization & 3D Rendering Software Market Revenue and Forecasts To 2030 (US$ Mn) - By End User
- Table 19. Spain: Europe Visualization & 3D Rendering Software Market Revenue and Forecasts To 2030 (US$ Mn) - By Application
- Table 20. Spain: Europe Visualization & 3D Rendering Software Market Revenue and Forecasts To 2030 (US$ Mn) - By Deployment
- Table 21. Spain: Europe Visualization & 3D Rendering Software Market Revenue and Forecasts To 2030 (US$ Mn) - By End User
- Table 22. Rest of Europe: Europe Visualization & 3D Rendering Software Market Revenue and Forecasts To 2030 (US$ Mn) - By Application
- Table 23. Rest of Europe: Europe Visualization & 3D Rendering Software Market Revenue and Forecasts To 2030 (US$ Mn) - By Deployment
- Table 24. Rest of Europe: Europe Visualization & 3D Rendering Software Market Revenue and Forecasts To 2030 (US$ Mn) - By End User
- Table 25. List of Abbreviation
List Of Figures
- Figure 1. Europe Visualization & 3D Rendering Software Market Segmentation, By Country
- Figure 2. Ecosystem: Europe Visualization & 3D Rendering Software Market
- Figure 3. Europe Visualization & 3D Rendering Software Market - Key Industry Dynamics
- Figure 4. Impact Analysis of Drivers and Restraints
- Figure 5. Europe Visualization & 3D Rendering Software Market Revenue (US$ Million), 2022 & 2030
- Figure 6. Europe Visualization & 3D Rendering Software Market Share (%) - Application, 2022 and 2030
- Figure 7. Training Simulation: Europe Visualization & 3D Rendering Software Market Revenue and Forecasts To 2030 (US$ Million)
- Figure 8. Marketing and Advertisement: Europe Visualization & 3D Rendering Software Market Revenue and Forecasts To 2030 (US$ Million)
- Figure 9. Video Games: Europe Visualization & 3D Rendering Software Market Revenue and Forecasts To 2030 (US$ Million)
- Figure 10. Product Visualization: Europe Visualization & 3D Rendering Software Market Revenue and Forecasts To 2030 (US$ Million)
- Figure 11. Architectural Visualization: Europe Visualization & 3D Rendering Software Market Revenue and Forecasts To 2030 (US$ Million)
- Figure 12. Europe Visualization & 3D Rendering Software Market Share (%) - Deployment, 2022 and 2030
- Figure 13. On-Premise: Europe Visualization & 3D Rendering Software Market Revenue and Forecasts To 2030 (US$ Million)
- Figure 14. Cloud: Europe Visualization & 3D Rendering Software Market Revenue and Forecasts To 2030 (US$ Million)
- Figure 15. Europe Visualization & 3D Rendering Software Market Share (%) - End User, 2022 and 2030
- Figure 16. Media and Entertainment: Europe Visualization & 3D Rendering Software Market Revenue and Forecasts To 2030 (US$ Million)
- Figure 17. Architecture and Construction: Europe Visualization & 3D Rendering Software Market Revenue and Forecasts To 2030 (US$ Million)
- Figure 18. Design and Engineering: Europe Visualization & 3D Rendering Software Market Revenue and Forecasts To 2030 (US$ Million)
- Figure 19. Healthcare: Europe Visualization & 3D Rendering Software Market Revenue and Forecasts To 2030 (US$ Million)
- Figure 20. Others: Europe Visualization & 3D Rendering Software Market Revenue and Forecasts To 2030 (US$ Million)
- Figure 21. Europe Visualization & 3D Rendering Software Market, By Country, 2022 ($Mn)
- Figure 22. Visualization & 3D rendering software market Breakdown by Key Countries, 2022 and 2030 (%)
- Figure 23. France: Europe Visualization & 3D Rendering Software Market Revenue and Forecasts To 2030 (US$ Mn)
- Figure 24. Germany: Europe Visualization & 3D Rendering Software Market Revenue and Forecasts To 2030 (US$ Mn)
- Figure 25. UK: Europe Visualization & 3D Rendering Software Market Revenue and Forecasts To 2030 (US$ Mn)
- Figure 26. Italy: Europe Visualization & 3D Rendering Software Market Revenue and Forecasts To 2030 (US$ Mn)
- Figure 27. Spain: Europe Visualization & 3D Rendering Software Market Revenue and Forecasts To 2030 (US$ Mn)
- Figure 28. Rest of Europe: Europe Visualization & 3D Rendering Software Market Revenue and Forecasts To 2030 (US$ Mn)
The Europe visualization & 3D rendering software market is expected to grow from US$ 816.08 million in 2022 to US$ 3,693.37 million by 2030. It is estimated to grow at a CAGR of 20.8% from 2022 to 2030.
Surge in Demand for Gaming and Videography Fuels Europe Visualization & 3D Rendering Software Market
While the rise in digitalization, increased accessibility, and user-friendliness of newer gaming technologies have driven the gaming industry, 3D modeling has revolutionized it. According to the European Gaming and Betting Association (EGBA) data, e-sports gaming revenues in Europe reached US $ 0.1 billion in 2021. In November 2022, the German Games Industry Association invested USD 20.0 million in the development of the German gaming sector. Almost every high-end game deploys 3D or uses 3D assets. Games have become more realistic and enticing through 3D technologies.
In order to indulge a gamer entirely in the virtual world, the scenes, props, and people should seem realistic. 3D rendering helps in improving graphics. Initially, 3D designing tools were widely used by game developers to develop PC and console games. However, due to the incremental advancement in processing capacities of mobile microprocessors, developers are using 3D designing tools in the mobile gaming industry. Moreover, increasing affordability of smartphones and growing penetration of internet services worldwide have subsequently flourished the mobile gaming industry. Further, the COVID-19 pandemic propelled the gaming industry substantially as gaming giants, such as Electronic Arts and Activision Blizzard, announced higher year-on-year revenues and greater market penetration than ever before.
Film and gaming industries have become dependent on computer-generated images for a realistic experience. Animation and movies are one of the significant applications of 3D designing tools. For long, 3D designing tools have been widely used in animation and movies. However, the growing trend of the sci-fi genre worldwide has resulted in the rising adoption of 3D designing tools. The content creation industry, small production houses, and individual professionals utilize 3D designing tools at a broader level. Meanwhile, the growing deployment of animated advertisement content by small and medium businesses worldwide is also propelling the visualization and 3D rendering software market growth.
Europe Visualization & 3D Rendering Software Market Overview
Industries operating in the EU are under continuous pressure to stay at par with the dynamically transforming technology landscape. This increasing technology penetration has resulted in complications in designing and building the desired infrastructures or products. To understand the designing and model-building process and streamline the same, companies from various industries heavily invest in IT offerings that facilitate interactive designing and visualization of innovative ideas. Europe is also a hub of high-precision industrial goods, having prime applications in the healthcare, pharmaceuticals, automotive, energy & power, infrastructure & construction, and semiconductors & electronics sectors. Thus, the growing industrialization in Europe is one of the major factors driving the adoption of designing and engineering solutions, such as visualization and 3D rendering tools. Also, the massive shift toward AI, particularly by tech giants such as Google, Hewlett Packard, and IBM, has further propelled the growth of the visualization and 3D rendering software market. In February 2022, Dassault Systemes announced the debut of "Sustainable Innovation Intelligence," a life cycle assessment tool that helps businesses reduce the environmental consequences of the goods, resources, and processes they generate, simultaneously promoting the circular economy. The cloud-based solution, which is fully integrated into Dassault Systemes 3DEXPERIENCE platform and covers the entire value chain, integrates the ecoinvent database on the impacts of over 18,000 industrial and agricultural processes into virtual design, product development, manufacturing engineering, operations, and logistics. Thus, all the aforementioned factors are driving the visualization and 3D rendering software market growth in Europe.
Europe Visualization & 3D Rendering Software Market Revenue and Forecast to 2030 (US$ Million)
Europe Visualization & 3D Rendering Software Market Segmentation
The Europe visualization & 3D rendering software market is segmented into application, deployment, end user, and country.
Based on application, the Europe visualization & 3D rendering software market is segmented into training simulation, marketing and advertisement, video games, product visualization, and architectural visualization. The architectural visualization segment held the largest share of the Europe visualization & 3D rendering software market in 2022.
Based on deployment, the Europe visualization & 3D rendering software market is segmented into on-premise and cloud. The on-premise segment held a larger share of the Europe visualization & 3D rendering software market in 2022.
Based on end user, the Europe visualization & 3D rendering software market is segmented into media and entertainment, architecture and construction, design and engineering, healthcare, and others. The architecture and construction segment held the largest share of the Europe visualization & 3D rendering software market in 2022.
Based on country, the Europe visualization & 3D rendering software market is segmented into France, Germany, the UK, Italy, Spain, and the Rest of Europe. The UK dominated the Europe visualization & 3D rendering software market in 2022.
Act-3D, Autodesk Inc, Chaos Group, Christie Digital Systems, Dassault Systemes SE, Luxion Inc., Next Limit, NVIDIA Corp, and Thea Render by Altair are some of the leading companies operating in the Europe visualization & 3D rendering software market.
Table Of Contents
1. Introduction
- 1.1 The Insight Partners Research Report Guidance
- 1.2 Market Segmentation
2. Executive Summary
- 2.1 Key Insights
- 2.2 Market Attractiveness
3. Research Methodology
- 3.1 Coverage
- 3.2 Secondary Research
- 3.3 Primary Research
4. Europe Visualization & 3D Rendering Software Market Landscape
- 4.1 Overview
- 4.2 Ecosystem Analysis
- 4.2.1 Service Provider:
- 4.2.2 End-User Industry:
- 4.2.3 List of Vendors in the Value Chain:
- 4.3 Premium Insights
- 4.3.1 In-depth Analysis on Data Formats used in 3D File Formats
- 4.3.1.1 OBJ
- 4.3.1.2 STEP
- 4.3.1.3 COLLADA
- 4.3.1.4 STL
- 4.3.1.5 FBX
- 4.3.1.6 GLTF
- 4.3.1.7 3DS
- 4.3.1.8 IGES
- 4.3.1 In-depth Analysis on Data Formats used in 3D File Formats
5. Europe Visualization & 3D Rendering Software Market - Key Industry Dynamics
- 5.1 Drivers
- 5.1.1 Increase in Need for Faster and Efficient Solutions
- 5.1.2 Surge in Demand for Gaming and Videography
- 5.1.3 Rise in Construction and Infrastructure Developments
- 5.1.4 Increase in Demand for Realistic Visuals
- 5.2 Market Restraints
- 5.2.1 Lack of Skilled Workforce and Supporting Infrastructure in Developing Countries
- 5.3 Market Opportunities
- 5.3.1 Proliferation of Virtual Reality (VR)
- 5.3.2 Rapid Expansion in Manufacturing Industry and Need for Prototyping
- 5.3.3 Increased Use of Visualization and 3D Rendering Software in Medical and Scientific Research
- 5.4 Future Trends
- 5.4.1 Emergence of Factory Automation
- 5.4.2 Rise in Adoption of Cloud-based Technologies
- 5.5 Impact of Drivers and Restraints:
6. Visualization & 3D Rendering Software Market - Europe Market Analysis
- 6.1 Europe Visualization & 3D Rendering Software Market Overview
- 6.2 Europe Visualization & 3D Rendering Software Market Revenue (US$ Million), 2022 - 2030
- 6.3 Europe Visualization & 3D Rendering Software Market Forecast and Analysis
7. Europe Visualization & 3D Rendering Software Market Analysis - Application
- 7.1 Training Simulation
- 7.1.1 Overview
- 7.1.2 Training Simulation: Europe Visualization & 3D Rendering Software Market Revenue and Forecasts To 2030 (US$ Million)
- 7.2 Marketing and Advertisement
- 7.2.1 Overview
- 7.2.2 Marketing and Advertisement: Europe Visualization & 3D Rendering Software Market Revenue and Forecasts To 2030 (US$ Million)
- 7.3 Video Games
- 7.3.1 Overview
- 7.3.2 Video Games: Europe Visualization & 3D Rendering Software Market Revenue and Forecasts To 2030 (US$ Million)
- 7.4 Product Visualization
- 7.4.1 Overview
- 7.4.2 Product Visualization: Europe Visualization & 3D Rendering Software Market Revenue and Forecasts To 2030 (US$ Million)
- 7.5 Architectural Visualization
- 7.5.1 Overview
- 7.5.2 Architectural Visualization: Europe Visualization & 3D Rendering Software Market Revenue and Forecasts To 2030 (US$ Million)
8. Europe Visualization & 3D Rendering Software Market Analysis - Deployment
- 8.1 On-Premise
- 8.1.1 Overview
- 8.1.2 On-Premise: Europe Visualization & 3D Rendering Software Market Revenue and Forecasts To 2030 (US$ Million)
- 8.2 Cloud
- 8.2.1 Overview
- 8.2.2 Cloud: Europe Visualization & 3D Rendering Software Market Revenue and Forecasts To 2030 (US$ Million)
9. Europe Visualization & 3D Rendering Software Market Analysis - End User
- 9.1 Media and Entertainment
- 9.1.1 Overview
- 9.1.2 Media and Entertainment: Europe Visualization & 3D Rendering Software Market Revenue and Forecasts To 2030 (US$ Million)
- 9.2 Architecture and Construction
- 9.2.1 Overview
- 9.2.2 Architecture and Construction: Europe Visualization & 3D Rendering Software Market Revenue and Forecasts To 2030 (US$ Million)
- 9.3 Design and Engineering
- 9.3.1 Overview
- 9.3.2 Design and Engineering: Europe Visualization & 3D Rendering Software Market Revenue and Forecasts To 2030 (US$ Million)
- 9.4 Healthcare
- 9.4.1 Overview
- 9.4.2 Healthcare: Europe Visualization & 3D Rendering Software Market Revenue and Forecasts To 2030 (US$ Million)
- 9.5 Others
- 9.5.1 Overview
- 9.5.2 Others: Europe Visualization & 3D Rendering Software Market Revenue and Forecasts To 2030 (US$ Million)
10. Europe Visualization & 3D Rendering Software Market - Country Analysis
- 10.1.1 Europe Visualization & 3D Rendering Software Market Overview
- 10.1.2 Europe Visualization & 3D Rendering Software Market Revenue and Forecasts and Analysis - By Countries
- 10.1.2.1 France: Europe Visualization & 3D Rendering Software Market Revenue and Forecasts to 2030 (US$ Mn)
- 10.1.2.1.1 France: Europe Visualization & 3D Rendering Software Market Breakdown by Application
- 10.1.2.1.2 France: Europe Visualization & 3D Rendering Software Market Breakdown by Deployment
- 10.1.2.1.3 France: Europe Visualization & 3D Rendering Software Market Breakdown by End User
- 10.1.2.2 Germany: Europe Visualization & 3D Rendering Software Market Revenue and Forecasts to 2030 (US$ Mn)
- 10.1.2.2.1 Germany: Europe Visualization & 3D Rendering Software Market Breakdown by Application
- 10.1.2.2.2 Germany: Europe Visualization & 3D Rendering Software Market Breakdown by Deployment
- 10.1.2.2.3 Germany: Europe Visualization & 3D Rendering Software Market Breakdown by End User
- 10.1.2.3 UK: Europe Visualization & 3D Rendering Software Market Revenue and Forecasts to 2030 (US$ Mn)
- 10.1.2.3.1 UK: Europe Visualization & 3D Rendering Software Market Breakdown by Application
- 10.1.2.3.2 UK: Europe Visualization & 3D Rendering Software Market Breakdown by Deployment
- 10.1.2.3.3 UK: Europe Visualization & 3D Rendering Software Market Breakdown by End User
- 10.1.2.4 Italy: Europe Visualization & 3D Rendering Software Market Revenue and Forecasts to 2030 (US$ Mn)
- 10.1.2.4.1 Italy: Europe Visualization & 3D Rendering Software Market Breakdown by Application
- 10.1.2.4.2 Italy: Europe Visualization & 3D Rendering Software Market Breakdown by Deployment
- 10.1.2.4.3 Italy: Europe Visualization & 3D Rendering Software Market Breakdown by End User
- 10.1.2.5 Spain: Europe Visualization & 3D Rendering Software Market Revenue and Forecasts to 2030 (US$ Mn)
- 10.1.2.5.1 Spain: Europe Visualization & 3D Rendering Software Market Breakdown by Application
- 10.1.2.5.2 Spain: Europe Visualization & 3D Rendering Software Market Breakdown by Deployment
- 10.1.2.5.3 Spain: Europe Visualization & 3D Rendering Software Market Breakdown by End User
- 10.1.2.6 Rest of Europe: Europe Visualization & 3D Rendering Software Market Revenue and Forecasts to 2030 (US$ Mn)
- 10.1.2.6.1 Rest of Europe: Europe Visualization & 3D Rendering Software Market Breakdown by Application
- 10.1.2.6.2 Rest of Europe: Europe Visualization & 3D Rendering Software Market Breakdown by Deployment
- 10.1.2.6.3 Rest of Europe: Europe Visualization & 3D Rendering Software Market Breakdown by End User
- 10.1.2.1 France: Europe Visualization & 3D Rendering Software Market Revenue and Forecasts to 2030 (US$ Mn)
11. Industry Landscape
- 11.1 Overview
- 11.2 Market Initiative
- 11.3 Product Development
- 11.4 Mergers & Acquisitions
12. Company Profiles
- 12.1 Autodesk Inc
- 12.1.1 Key Facts
- 12.1.2 Business Description
- 12.1.3 Products and Services
- 12.1.4 Financial Overview
- 12.1.5 SWOT Analysis
- 12.1.6 Key Developments
- 12.2 Christie Digital Systems
- 12.2.1 Key Facts
- 12.2.2 Business Description
- 12.2.3 Products and Services
- 12.2.4 Financial Overview
- 12.2.5 SWOT Analysis
- 12.2.6 Key Developments
- 12.3 Dassault Systemes SE
- 12.3.1 Key Facts
- 12.3.2 Business Description
- 12.3.3 Products and Services
- 12.3.4 Financial Overview
- 12.3.5 SWOT Analysis
- 12.3.6 Key Developments
- 12.4 NVIDIA Corp
- 12.4.1 Key Facts
- 12.4.2 Business Description
- 12.4.3 Products and Services
- 12.4.4 Financial Overview
- 12.4.5 SWOT Analysis
- 12.4.6 Key Developments
- 12.5 Chaos Group
- 12.5.1 Key Facts
- 12.5.2 Business Description
- 12.5.3 Products and Services
- 12.5.4 Financial Overview
- 12.5.5 SWOT Analysis
- 12.5.6 Key Developments
- 12.6 Luxion Inc.
- 12.6.1 Key Facts
- 12.6.2 Business Description
- 12.6.3 Products and Services
- 12.6.4 Financial Overview
- 12.6.5 SWOT Analysis
- 12.6.6 Key Developments
- 12.7 Next Limit
- 12.7.1 Key Facts
- 12.7.2 Business Description
- 12.7.3 Products and Services
- 12.7.4 Financial Overview
- 12.7.5 SWOT Analysis
- 12.7.6 Key Developments
- 12.8 Act-3D
- 12.8.1 Key Facts
- 12.8.2 Business Description
- 12.8.3 Products and Services
- 12.8.4 Financial Overview
- 12.8.5 SWOT Analysis
- 12.8.6 Key Developments
- 12.9 Thea Render by Altair
- 12.9.1 Key Facts
- 12.9.2 Business Description
- 12.9.3 Products and Services
- 12.9.4 Financial Overview
- 12.9.5 SWOT Analysis
- 12.9.6 Key Developments
13. Appendix
- 13.1 Word Index

