|
|
市場調査レポート
商品コード
1362389
蛍光in-situハイブリダイゼーション・イメージング・システム市場規模・動向、世界・地域シェア、動向、成長機会分析レポート対象範囲:製品別、用途別、エンドユーザー別、地域別Fluorescence In-Situ Hybridization Imaging Systems Market Size and Forecasts, Global and Regional Share, Trends, and Growth Opportunity Analysis Report Coverage: By Product, Application, End User, and Geography |
||||||
|
|
|||||||
|
|||||||


| 蛍光in-situハイブリダイゼーション・イメージング・システム市場規模・動向、世界・地域シェア、動向、成長機会分析レポート対象範囲:製品別、用途別、エンドユーザー別、地域別 |
|
出版日: 2023年09月18日
発行: The Insight Partners
ページ情報: 英文 212 Pages
納期: 即納可能
|

- 全表示
- 概要
- 図表
- 目次
蛍光in-situハイブリダイゼーション(FISH)イメージングシステムの世界市場は、2022年の10億8,400万米ドルから2030年には19億140万米ドルに達すると予測されます。2022年から2030年までのCAGRは7.3%で成長すると推定されます。
市場成長の主な要因は、対象疾患の有病率の上昇と体外診断への研究開発投資の増加です。しかし、魚の画像診断システムや処置のコストが高いことが、市場の成長をある程度妨げています。
蛍光インサイチュハイブリダイゼーション(FISH)イメージングシステム市場の市場機会
FISHイメージング・システムは、技術的進歩の急増により著しい進化を遂げており、その結果、最先端のイノベーションが遺伝子研究と診断の状況を一変させています。これらの進歩には、強化された光学系、より高感度で汎用性の高い蛍光色素、洗練された自動化機能などが含まれます。これらのアップグレードされた機能と統合された最新のFISHイメージング・システムは、より高い感度、改善された画像解像度、より速い処理時間を提供します。さらに、これらの技術的進歩により、FISHイメージングの応用範囲は、がん診断から遺伝的素因検査へと広がっています。2021年7月、BioViewとCapio Biosciencesは、全血から循環腫瘍細胞(CTC)を採取するためのプラットフォームを共同で開発しました。両社の技術を統合することで、両社はさらにCTCリキッドバイオプシーのダウンストリーム解析の改善に取り組みました。同様に、BioViewとCapio Biosciencesは共同で、2020年12月にRUBYnanomedと提携し、がん検出を強化するため、臨床におけるCTC技術の受容と採用を加速する独自のイメージングソリューションを開発しました。このように、FISHイメージング・システムにおける技術的進歩は、蛍光in-situハイブリダイゼーション(FISH)イメージング・システム市場における企業にとって大きなビジネスチャンスとなります。
蛍光in-situハイブリダイゼーション(FISH)イメージング・システム市場を阻害する要因
コンピュータ断層撮影(CT)スキャン、免疫組織化学(IHC)スキャン、骨スキャン、FISHイメージング、磁気共鳴画像(MRI)スキャン、陽電子放射断層撮影(PET)スキャン、超音波検査、X線検査などは、がんの検出に用いられる検査のひとつです。FISH画像解析は、他の方法に比べて比較的高価であるため、がん検出においてあまり一般的に使用されていない方法です。機器のコストに加え、試薬やその他の消耗品に関連する費用、および専門的な人員の任命が、FISHイメージングに基づく評価の全体的なコストを増加させる可能性があります。例えば、IHCによるALK遺伝子非小細胞肺がんの検出は、1検査あたり米国で90.07米ドル、欧州で68.69米ドルの費用がかかり、FISHとIHCによる独立検査または並行検査(1検査あたり米国で441.85米ドル、欧州で279.46米ドル)よりも低いです。したがって、手順やシステムのコストが高いことが、蛍光in situハイブリダイゼーション(FISH)イメージング・システム市場の成長を制限しています。
蛍光in situハイブリダイゼーション(FISH)イメージングシステム市場:セグメント別概要
蛍光in-situハイブリダイゼーション(FISH)イメージングシステム市場は、製品別に機器、消耗品、アクセサリー、ソフトウェアに区分されます。消耗品セグメントは2022年に大きな市場シェアを占め、同セグメントはより高いCAGRを記録すると予測されています。消耗品は、蛍光in-situハイブリダイゼーション(FISH)イメージング・システム市場で最も有望な分野であり、今後数年間で飛躍的な成長に貢献します。FISH消耗品には、ハイブリダイゼーションバッファー、プローブ、タグ検出キット、シグナル増幅検出キットなどが含まれます。Abbott、F. Abnova、Thermo Fisher Scientificなどのメーカーの存在が、消耗品セグメントの市場を強化しています。さらに、これらの製品はさまざまな研究診断プロセスで頻繁に使用されており、これが消費を促進すると期待されています。このように、プローブ&キットを提供する様々な市場プレイヤーの存在と市場プレイヤーによる技術的進歩が、今後数年間、このセグメントの市場を促進する可能性が高いです。
蛍光in-situハイブリダイゼーション(FISH)イメージングシステム市場は、用途別に、がん診断、遺伝子疾患診断、感染症診断、その他に区分されます。2022年の市場シェアはがん診断分野が大きく、同分野はより高いCAGRを記録すると予測されています。FISH技術はがん診断に多大な恩恵をもたらしています。FISHイメージング・システムは遺伝子の変化を調べ、異常の検出に役立ちます。Cancer Research UKによると、FISH検査は、乳がん、リンパ腫、肺がん、前立腺がん、慢性リンパ性白血病(CLL)、急性リンパ芽球性白血病(ALL)、急性骨髄性白血病(AML)、慢性骨髄性白血病(CML)、骨髄腫、Ewings肉腫、黒色腫皮膚がんなど、いくつかのがんの診断に使用されています。
エンドユーザー別では、蛍光in-situハイブリダイゼーション(FISH)イメージングシステム市場は、診断ラボ、受託研究機関、製薬・バイオテクノロジー企業、その他に区分されます。2022年の市場シェアは診断ラボ分野が大きく、同分野はより高いCAGRを記録すると予測されています。診断研究所は、蛍光in-situハイブリダイゼーション(FISH)イメージングプロセスのためのいくつかの技術や製品を開発するために様々な研究プロジェクトに関与しています。研究と技術における前例のない開発は、ヘルスケアとライフサイエンス分野における変革の可能性を生み出しました。蛍光in-situハイブリダイゼーション(FISH)イメージングシステムの臨床応用は広大で、慢性疾患の診断と治療能力を強化する機会を提供しています。遺伝子発見や希少遺伝子疾患の診断にも大きな可能性があります。この技術は、がん、高血圧、糖尿病、腎臓病などの一般的な疾患の発症に影響する希少な遺伝子因子や一般的な遺伝子因子の解析にますます使用されるようになっています。
蛍光in-situハイブリダイゼーション(FISH)イメージング・システム市場:地域別概要
2022年の世界の蛍光in-situハイブリダイゼーション(FISH)イメージングシステム市場では、北米が最大のシェアを占めました。同地域では、米国が最大の蛍光in-situハイブリダイゼーション(FISH)イメージングシステム市場シェアを占め、予測期間中に最も高いCAGRを記録すると予測されています。分子遺伝学や細胞遺伝学における高度な診断ツールに対する需要の高まり、遺伝性疾患やがんの有病率の上昇が蛍光in-situハイブリダイゼーション(FISH)イメージングシステムの採用に拍車をかけています。米国がん協会が2022年に発表したデータによると、米国では約190万人が新たにがんと診断され、60万9360人ががんで死亡しています。これらのシステムは遺伝物質の高解像度イメージングを提供し、研究者や臨床医がより高い精度で染色体異常や遺伝子変異を検出することを可能にします。さらに、個別化医療と標的療法への注目の高まりは、遺伝子解析を伴う研究活動の急増につながり、FISHイメージング・システムの需要を高めています。細胞内の遺伝子配列に関する詳細な空間情報を直接提供するこれらのシステムの能力は、研究および臨床アプリケーションの両方において非常に貴重であることが証明されています。自動化、スループットの向上、画像解析ソフトウェアの強化など、FISHイメージング・システムの技術的進歩の人気も近年高まっています。その結果、研究所や医療機関は、より大量のサンプルを処理し、正確な結果を効率的に生成するための設備が整ってきています。このように、前述の要因は米国における蛍光in-situハイブリダイゼーション(FISH)イメージング・システム市場の成長を後押しすることになります。
蛍光in-situハイブリダイゼーション(FISH)イメージングシステム市場に関するレポート作成時に参照した主な一次情報および二次情報は、World Bank Data、National Health Service(NHS)、FDA(Food and Drug Administration)、EMA(European Medicines Agency)、WHO(World Health Organization)などです。
目次
第1章 イントロダクション
第2章 エグゼクティブサマリー
- 主要洞察
- 市場の魅力
第3章 調査手法
- 調査範囲
- 2次調査
- 1次調査
第4章 蛍光インサイチューハイブリダイゼーション(FISH)イメージングシステム市場情勢
- PEST分析
- 世界のPEST分析
第5章 蛍光in-situハイブリダイゼーション(FISH)イメージングシステム市場-主要産業力学
- 主な市場促進要因
- 対象疾患の有病率の上昇
- 体外診断への研究開発投資の増加
- 主な市場抑制要因
- FISHイメージング・システムと手順の高コスト
- 主な市場機会
- 蛍光in situハイブリダイゼーションイメージングの技術進歩
- 今後の動向
- FISHイメージング技術の自動化とデジタル化
- インパクト分析
第6章 蛍光in-situハイブリダイゼーション(FISH)イメージングシステム市場:世界市場分析
- 蛍光in-situハイブリダイゼーション(FISH)イメージングシステム市場収益、2022年~2030年
第7章 蛍光in-situハイブリダイゼーション(FISH)イメージングシステムの世界市場-2030年までの収益と予測:製品別
- 蛍光in-situハイブリダイゼーション(FISH)イメージングシステム市場製品別売上高シェア、2022年・2030年(%)
- 機器
- 消耗品
- 付属品
- ソフトウェア
第8章 蛍光in-situハイブリダイゼーション(FISH)イメージングシステムの世界市場:用途別収益と2030年までの予測
- 蛍光in-situハイブリダイゼーション(FISH)イメージングシステム市場:2022年・2030年アプリケーション別売上高シェア(%)
- がん診断
- 遺伝子疾患診断
- 感染症診断
- その他
第9章 蛍光In-Situハイブリダイゼーション(FISH)イメージングシステムの世界市場:エンドユーザー別収益と2030年までの予測
- 蛍光in-situハイブリダイゼーション(FISH)イメージングシステム市場エンドユーザー別2022年・2030年収益シェア(%)
- 診断研究所
- 契約研究機関
- 製薬・バイオテクノロジー企業
- その他
第10章 蛍光インサイチューハイブリダイゼーション(FISH)イメージングシステム市場- 地域別分析
- 北米
- メキシコ
- 欧州
- その他欧州
- アジア太平洋
- その他アジア太平洋地域
- 中東・アフリカ
- その他中東とアフリカ
- 中南米
- その他中南米
第11章 蛍光in-situハイブリダイゼーション(FISH)イメージングシステム市場業界情勢
- 蛍光in-situハイブリダイゼーション(FISH)イメージングシステム市場の成長戦略
- 無機的成長戦略
- 有機的成長戦略
第12章 企業プロファイル
- Euroclone SpA
- TissueGnostics GmbH
- Agilent Technologies Inc
- Abnova Taiwan Corp
- BioGenex Laboratories Inc
- Leica Biosystems Nussloch GmbH
- MetaSystems Probes GmbH
- Bio-View Ltd
- Thermo Fisher Scientific Inc
- Applied Spectral Imaging
- PerkinElmer Inc
第13章 付録
List Of Tables
- Table 1. Fluorescence In-Situ Hybridization (FISH) Imaging Systems Market Segmentation
- Table 2. North America Fluorescence In-Situ Hybridization (FISH) Imaging Systems Market, by Product- Revenue and Forecast to 2030 (US$ Million)
- Table 3. North America Fluorescence In-Situ Hybridization (FISH) Imaging Systems Market, by Instruments - Revenue and Forecast to 2030 (US$ Million)
- Table 4. North America Fluorescence In-Situ Hybridization (FISH) Imaging Systems Market, by Consumables - Revenue and Forecast to 2030 (US$ Million)
- Table 5. North America Fluorescence In-Situ Hybridization (FISH) Imaging Systems Market, by Application - Revenue and Forecast to 2030 (US$ Million)
- Table 6. North America Fluorescence In-Situ Hybridization (FISH) Imaging Systems Market, by End User - Revenue and Forecast to 2030 (US$ Million)
- Table 7. US Fluorescence In-Situ Hybridization (FISH) Imaging Systems Market, by Product- Revenue and Forecast to 2030 (US$ Million)
- Table 8. US Fluorescence In-Situ Hybridization (FISH) Imaging Systems Market, by Instruments - Revenue and Forecast to 2030 (US$ Million)
- Table 9. US Fluorescence In-Situ Hybridization (FISH) Imaging Systems Market, by Consumables - Revenue and Forecast to 2030 (US$ Million)
- Table 10. US Fluorescence In-Situ Hybridization (FISH) Imaging Systems Market, by Application - Revenue and Forecast to 2030 (US$ Million)
- Table 11. US Fluorescence In-Situ Hybridization (FISH) Imaging Systems Market, by End User - Revenue and Forecast to 2030 (US$ Million)
- Table 12. Canada Fluorescence In-Situ Hybridization (FISH) Imaging Systems Market, by Product- Revenue and Forecast to 2030 (US$ Million)
- Table 13. US Fluorescence In-Situ Hybridization (FISH) Imaging Systems Market, by Instruments - Revenue and Forecast to 2030 (US$ Million)
- Table 14. Canada Fluorescence In-Situ Hybridization (FISH) Imaging Systems Market, by Consumables - Revenue and Forecast to 2030 (US$ Million)
- Table 15. Canada Fluorescence In-Situ Hybridization (FISH) Imaging Systems Market, by Application - Revenue and Forecast to 2030 (US$ Million)
- Table 16. Canada Fluorescence In-Situ Hybridization (FISH) Imaging Systems Market, by End User - Revenue and Forecast to 2030 (US$ Million)
- Table 17. Mexico Fluorescence In-Situ Hybridization (FISH) Imaging Systems Market, by Product- Revenue and Forecast to 2030 (US$ Million)
- Table 18. Mexico Fluorescence In-Situ Hybridization (FISH) Imaging Systems Market, by Instruments - Revenue and Forecast to 2030 (US$ Million)
- Table 19. Mexico Fluorescence In-Situ Hybridization (FISH) Imaging Systems Market, by Consumables - Revenue and Forecast to 2030 (US$ Million)
- Table 20. Mexico Fluorescence In-Situ Hybridization (FISH) Imaging Systems Market, by Application - Revenue and Forecast to 2030 (US$ Million)
- Table 21. Mexico Fluorescence In-Situ Hybridization (FISH) Imaging Systems Market, by End User - Revenue and Forecast to 2030 (US$ Million)
- Table 22. Europe Fluorescence In-Situ Hybridization (FISH) Imaging Systems Market, by Product- Revenue and Forecast to 2030 (US$ Million)
- Table 23. Europe Fluorescence In-Situ Hybridization (FISH) Imaging Systems Market, by Instruments - Revenue and Forecast to 2030 (US$ Million)
- Table 24. Europe Fluorescence In-Situ Hybridization (FISH) Imaging Systems Market, by Consumables - Revenue and Forecast to 2030 (US$ Million)
- Table 25. Europe Fluorescence In-Situ Hybridization (FISH) Imaging Systems Market, by Application - Revenue and Forecast to 2030 (US$ Million)
- Table 26. Europe Fluorescence In-Situ Hybridization (FISH) Imaging Systems Market, by End User - Revenue and Forecast to 2030 (US$ Million)
- Table 27. Germany Fluorescence In-Situ Hybridization (FISH) Imaging Systems Market, by Product- Revenue and Forecast to 2030 (US$ Million)
- Table 28. Germany Fluorescence In-Situ Hybridization (FISH) Imaging Systems Market, by Instruments - Revenue and Forecast to 2030 (US$ Million)
- Table 29. Germany Fluorescence In-Situ Hybridization (FISH) Imaging Systems Market, by Consumables - Revenue and Forecast to 2030 (US$ Million)
- Table 30. Germany Fluorescence In-Situ Hybridization (FISH) Imaging Systems Market, by Application - Revenue and Forecast to 2030 (US$ Million)
- Table 31. Germany Fluorescence In-Situ Hybridization (FISH) Imaging Systems Market, by End User - Revenue and Forecast to 2030 (US$ Million)
- Table 32. UK Fluorescence In-Situ Hybridization (FISH) Imaging Systems Market, by Product- Revenue and Forecast to 2030 (US$ Million)
- Table 33. UK Fluorescence In-Situ Hybridization (FISH) Imaging Systems Market, by Instruments - Revenue and Forecast to 2030 (US$ Million)
- Table 34. UK Fluorescence In-Situ Hybridization (FISH) Imaging Systems Market, by Consumables - Revenue and Forecast to 2030 (US$ Million)
- Table 35. UK Fluorescence In-Situ Hybridization (FISH) Imaging Systems Market, by Application - Revenue and Forecast to 2030 (US$ Million)
- Table 36. UK Fluorescence In-Situ Hybridization (FISH) Imaging Systems Market, by End User - Revenue and Forecast to 2030 (US$ Million)
- Table 37. France Fluorescence In-Situ Hybridization (FISH) Imaging Systems Market, by Product- Revenue and Forecast to 2030 (US$ Million)
- Table 38. France Fluorescence In-Situ Hybridization (FISH) Imaging Systems Market, by Instruments - Revenue and Forecast to 2030 (US$ Million)
- Table 39. France Fluorescence In-Situ Hybridization (FISH) Imaging Systems Market, by Consumables - Revenue and Forecast to 2030 (US$ Million)
- Table 40. France Fluorescence In-Situ Hybridization (FISH) Imaging Systems Market, by Application - Revenue and Forecast to 2030 (US$ Million)
- Table 41. France Fluorescence In-Situ Hybridization (FISH) Imaging Systems Market, by End User - Revenue and Forecast to 2030 (US$ Million)
- Table 42. Italy Fluorescence In-Situ Hybridization (FISH) Imaging Systems Market, by Product- Revenue and Forecast to 2030 (US$ Million)
- Table 43. Italy Fluorescence In-Situ Hybridization (FISH) Imaging Systems Market, by Instruments - Revenue and Forecast to 2030 (US$ Million)
- Table 44. Italy Fluorescence In-Situ Hybridization (FISH) Imaging Systems Market, by Consumables - Revenue and Forecast to 2030 (US$ Million)
- Table 45. Italy Fluorescence In-Situ Hybridization (FISH) Imaging Systems Market, by Application - Revenue and Forecast to 2030 (US$ Million)
- Table 46. Italy Fluorescence In-Situ Hybridization (FISH) Imaging Systems Market, by End User - Revenue and Forecast to 2030 (US$ Million)
- Table 47. Spain Fluorescence In-Situ Hybridization (FISH) Imaging Systems Market, by Product- Revenue and Forecast to 2030 (US$ Million)
- Table 48. Spain Fluorescence In-Situ Hybridization (FISH) Imaging Systems Market, by Instruments - Revenue and Forecast to 2030 (US$ Million)
- Table 49. Spain Fluorescence In-Situ Hybridization (FISH) Imaging Systems Market, by Consumables - Revenue and Forecast to 2030 (US$ Million)
- Table 50. Spain Fluorescence In-Situ Hybridization (FISH) Imaging Systems Market, by Application - Revenue and Forecast to 2030 (US$ Million)
- Table 51. Spain Fluorescence In-Situ Hybridization (FISH) Imaging Systems Market, by End User - Revenue and Forecast to 2030 (US$ Million)
- Table 52. Rest of Europe Fluorescence In-Situ Hybridization (FISH) Imaging Systems Market, by Product- Revenue and Forecast to 2030 (US$ Million)
- Table 53. Rest of Europe Fluorescence In-Situ Hybridization (FISH) Imaging Systems Market, by Instruments - Revenue and Forecast to 2030 (US$ Million)
- Table 54. Rest of Europe Fluorescence In-Situ Hybridization (FISH) Imaging Systems Market, by Consumables - Revenue and Forecast to 2030 (US$ Million)
- Table 55. Rest of Europe Fluorescence In-Situ Hybridization (FISH) Imaging Systems Market, by Application - Revenue and Forecast to 2030 (US$ Million)
- Table 56. Rest of Europe Fluorescence In-Situ Hybridization (FISH) Imaging Systems Market, by End User - Revenue and Forecast to 2030 (US$ Million)
- Table 57. Asia Pacific Fluorescence In-Situ Hybridization (FISH) Imaging Systems Market, by Product- Revenue and Forecast to 2030 (US$ Million)
- Table 58. Asia Pacific Fluorescence In-Situ Hybridization (FISH) Imaging Systems Market, by Instruments - Revenue and Forecast to 2030 (US$ Million)
- Table 59. Asia Pacific Fluorescence In-Situ Hybridization (FISH) Imaging Systems Market, by Consumables - Revenue and Forecast to 2030 (US$ Million)
- Table 60. Asia Pacific Fluorescence In-Situ Hybridization (FISH) Imaging Systems Market, by Application - Revenue and Forecast to 2030 (US$ Million)
- Table 61. Asia Pacific Fluorescence In-Situ Hybridization (FISH) Imaging Systems Market, by End User - Revenue and Forecast to 2030 (US$ Million)
- Table 62. China Fluorescence In-Situ Hybridization (FISH) Imaging Systems Market, by Product- Revenue and Forecast to 2030 (US$ Million)
- Table 63. China Fluorescence In-Situ Hybridization (FISH) Imaging Systems Market, by Instruments - Revenue and Forecast to 2030 (US$ Million)
- Table 64. China Fluorescence In-Situ Hybridization (FISH) Imaging Systems Market, by Consumables - Revenue and Forecast to 2030 (US$ Million)
- Table 65. China Fluorescence In-Situ Hybridization (FISH) Imaging Systems Market, by Application - Revenue and Forecast to 2030 (US$ Million)
- Table 66. China Fluorescence In-Situ Hybridization (FISH) Imaging Systems Market, by End User - Revenue and Forecast to 2030 (US$ Million)
- Table 67. Japan Fluorescence In-Situ Hybridization (FISH) Imaging Systems Market, by Product- Revenue and Forecast to 2030 (US$ Million)
- Table 68. Japan Fluorescence In-Situ Hybridization (FISH) Imaging Systems Market, by Instruments - Revenue and Forecast to 2030 (US$ Million)
- Table 69. Japan Fluorescence In-Situ Hybridization (FISH) Imaging Systems Market, by Consumables - Revenue and Forecast to 2030 (US$ Million)
- Table 70. Japan Fluorescence In-Situ Hybridization (FISH) Imaging Systems Market, by Application - Revenue and Forecast to 2030 (US$ Million)
- Table 71. Japan Fluorescence In-Situ Hybridization (FISH) Imaging Systems Market, by End User - Revenue and Forecast to 2030 (US$ Million)
- Table 72. India Fluorescence In-Situ Hybridization (FISH) Imaging Systems Market, by Product- Revenue and Forecast to 2030 (US$ Million)
- Table 73. India Fluorescence In-Situ Hybridization (FISH) Imaging Systems Market, by Instruments - Revenue and Forecast to 2030 (US$ Million)
- Table 74. India Fluorescence In-Situ Hybridization (FISH) Imaging Systems Market, by Consumables - Revenue and Forecast to 2030 (US$ Million)
- Table 75. India Fluorescence In-Situ Hybridization (FISH) Imaging Systems Market, by Application - Revenue and Forecast to 2030 (US$ Million)
- Table 76. India Fluorescence In-Situ Hybridization (FISH) Imaging Systems Market, by End User - Revenue and Forecast to 2030 (US$ Million)
- Table 77. Australia Fluorescence In-Situ Hybridization (FISH) Imaging Systems Market, by Product- Revenue and Forecast to 2030 (US$ Million)
- Table 78. Australia Fluorescence In-Situ Hybridization (FISH) Imaging Systems Market, by Instruments - Revenue and Forecast to 2030 (US$ Million)
- Table 79. Australia Fluorescence In-Situ Hybridization (FISH) Imaging Systems Market, by Consumables - Revenue and Forecast to 2030 (US$ Million)
- Table 80. Australia Fluorescence In-Situ Hybridization (FISH) Imaging Systems Market, by Application - Revenue and Forecast to 2030 (US$ Million)
- Table 81. Australia Fluorescence In-Situ Hybridization (FISH) Imaging Systems Market, by End User - Revenue and Forecast to 2030 (US$ Million)
- Table 82. South Korea Fluorescence In-Situ Hybridization (FISH) Imaging Systems Market, by Product- Revenue and Forecast to 2030 (US$ Million)
- Table 83. South Korea Fluorescence In-Situ Hybridization (FISH) Imaging Systems Market, by Instruments - Revenue and Forecast to 2030 (US$ Million)
- Table 84. South Korea Fluorescence In-Situ Hybridization (FISH) Imaging Systems Market, by Consumables - Revenue and Forecast to 2030 (US$ Million)
- Table 85. South Korea Fluorescence In-Situ Hybridization (FISH) Imaging Systems Market, by Application - Revenue and Forecast to 2030 (US$ Million)
- Table 86. South Korea Fluorescence In-Situ Hybridization (FISH) Imaging Systems Market, by End User - Revenue and Forecast to 2030 (US$ Million)
- Table 87. Rest of Asia Pacific Fluorescence In-Situ Hybridization (FISH) Imaging Systems Market, by Product- Revenue and Forecast to 2030 (US$ Million)
- Table 88. Rest of Asia Pacific Fluorescence In-Situ Hybridization (FISH) Imaging Systems Market, by Instruments - Revenue and Forecast to 2030 (US$ Million)
- Table 89. Rest of Asia Pacific Fluorescence In-Situ Hybridization (FISH) Imaging Systems Market, by Consumables - Revenue and Forecast to 2030 (US$ Million)
- Table 90. Rest of Asia Pacific Fluorescence In-Situ Hybridization (FISH) Imaging Systems Market, by Application - Revenue and Forecast to 2030 (US$ Million)
- Table 91. Rest of Asia Pacific Fluorescence In-Situ Hybridization (FISH) Imaging Systems Market, by End User - Revenue and Forecast to 2030 (US$ Million)
- Table 92. Middle East and Africa Fluorescence In-Situ Hybridization (FISH) Imaging Systems Market, by Product- Revenue and Forecast to 2030 (US$ Million)
- Table 93. Middle East and Africa Fluorescence In-Situ Hybridization (FISH) Imaging Systems Market, by Instruments - Revenue and Forecast to 2030 (US$ Million)
- Table 94. Middle East and Africa Fluorescence In-Situ Hybridization (FISH) Imaging Systems Market, by Consumables - Revenue and Forecast to 2030 (US$ Million)
- Table 95. Middle East and Africa Fluorescence In-Situ Hybridization (FISH) Imaging Systems Market, by Application - Revenue and Forecast to 2030 (US$ Million)
- Table 96. Middle East and Africa Fluorescence In-Situ Hybridization (FISH) Imaging Systems Market, by End User - Revenue and Forecast to 2030 (US$ Million)
- Table 97. Saudi Arabia Fluorescence In-Situ Hybridization (FISH) Imaging Systems Market, by Product- Revenue and Forecast to 2030 (US$ Million)
- Table 98. Saudi Arabia Fluorescence In-Situ Hybridization (FISH) Imaging Systems Market, by Instruments - Revenue and Forecast to 2030 (US$ Million)
- Table 99. Saudi Arabia Fluorescence In-Situ Hybridization (FISH) Imaging Systems Market, by Consumables - Revenue and Forecast to 2030 (US$ Million)
- Table 100. Saudi Arabia Fluorescence In-Situ Hybridization (FISH) Imaging Systems Market, by Application - Revenue and Forecast to 2030 (US$ Million)
- Table 101. Saudi Arabia Fluorescence In-Situ Hybridization (FISH) Imaging Systems Market, by End User - Revenue and Forecast to 2030 (US$ Million)
- Table 102. U.A.E Fluorescence In-Situ Hybridization (FISH) Imaging Systems Market, by Product- Revenue and Forecast to 2030 (US$ Million)
- Table 103. U.A.E Fluorescence In-Situ Hybridization (FISH) Imaging Systems Market, by Instruments - Revenue and Forecast to 2030 (US$ Million)
- Table 104. U.A.E Fluorescence In-Situ Hybridization (FISH) Imaging Systems Market, by Consumables - Revenue and Forecast to 2030 (US$ Million)
- Table 105. U.A.E Fluorescence In-Situ Hybridization (FISH) Imaging Systems Market, by Application - Revenue and Forecast to 2030 (US$ Million)
- Table 106. U.A.E Fluorescence In-Situ Hybridization (FISH) Imaging Systems Market, by End User - Revenue and Forecast to 2030 (US$ Million)
- Table 107. South Africa Fluorescence In-Situ Hybridization (FISH) Imaging Systems Market, by Product- Revenue and Forecast to 2030 (US$ Million)
- Table 108. South Africa Fluorescence In-Situ Hybridization (FISH) Imaging Systems Market, by Instruments - Revenue and Forecast to 2030 (US$ Million)
- Table 109. South Africa Fluorescence In-Situ Hybridization (FISH) Imaging Systems Market, by Consumables - Revenue and Forecast to 2030 (US$ Million)
- Table 110. South Africa Fluorescence In-Situ Hybridization (FISH) Imaging Systems Market, by Application - Revenue and Forecast to 2030 (US$ Million)
- Table 111. South Africa Fluorescence In-Situ Hybridization (FISH) Imaging Systems Market, by End User - Revenue and Forecast to 2030 (US$ Million)
- Table 112. Rest of Middle East and Africa Fluorescence In-Situ Hybridization (FISH) Imaging Systems Market, by Product- Revenue and Forecast to 2030 (US$ Million)
- Table 113. Rest of Middle East and Africa Fluorescence In-Situ Hybridization (FISH) Imaging Systems Market, by Instruments - Revenue and Forecast to 2030 (US$ Million)
- Table 114. Rest of Middle East and Africa Fluorescence In-Situ Hybridization (FISH) Imaging Systems Market, by Consumables - Revenue and Forecast to 2030 (US$ Million)
- Table 115. Rest of Middle East and Africa Fluorescence In-Situ Hybridization (FISH) Imaging Systems Market, by Application - Revenue and Forecast to 2030 (US$ Million)
- Table 116. Rest of Middle East and Africa Fluorescence In-Situ Hybridization (FISH) Imaging Systems Market, by End User - Revenue and Forecast to 2030 (US$ Million)
- Table 117. South and Central America Fluorescence In-Situ Hybridization (FISH) Imaging Systems Market, by Product- Revenue and Forecast to 2030 (US$ Million)
- Table 118. South and Central America Fluorescence In-Situ Hybridization (FISH) Imaging Systems Market, by Instruments - Revenue and Forecast to 2030 (US$ Million)
- Table 119. South and Central America Fluorescence In-Situ Hybridization (FISH) Imaging Systems Market, by Consumables - Revenue and Forecast to 2030 (US$ Million)
- Table 120. South and Central America Fluorescence In-Situ Hybridization (FISH) Imaging Systems Market, by Application - Revenue and Forecast to 2030 (US$ Million)
- Table 121. South and Central America Fluorescence In-Situ Hybridization (FISH) Imaging Systems Market, by End User - Revenue and Forecast to 2030 (US$ Million)
- Table 122. Brazil Fluorescence In-Situ Hybridization (FISH) Imaging Systems Market, by Product- Revenue and Forecast to 2030 (US$ Million)
- Table 123. Brazil Fluorescence In-Situ Hybridization (FISH) Imaging Systems Market, by Instruments - Revenue and Forecast to 2030 (US$ Million)
- Table 124. Brazil Fluorescence In-Situ Hybridization (FISH) Imaging Systems Market, by Consumables - Revenue and Forecast to 2030 (US$ Million)
- Table 125. Brazil Fluorescence In-Situ Hybridization (FISH) Imaging Systems Market, by Application - Revenue and Forecast to 2030 (US$ Million)
- Table 126. Brazil Fluorescence In-Situ Hybridization (FISH) Imaging Systems Market, by End User - Revenue and Forecast to 2030 (US$ Million)
- Table 127. Argentina Fluorescence In-Situ Hybridization (FISH) Imaging Systems Market, by Product- Revenue and Forecast to 2030 (US$ Million)
- Table 128. Argentina Fluorescence In-Situ Hybridization (FISH) Imaging Systems Market, by Instruments - Revenue and Forecast to 2030 (US$ Million)
- Table 129. Argentina Fluorescence In-Situ Hybridization (FISH) Imaging Systems Market, by Consumables - Revenue and Forecast to 2030 (US$ Million)
- Table 130. Argentina Fluorescence In-Situ Hybridization (FISH) Imaging Systems Market, by Application - Revenue and Forecast to 2030 (US$ Million)
- Table 131. Argentina Fluorescence In-Situ Hybridization (FISH) Imaging Systems Market, by End User - Revenue and Forecast to 2030 (US$ Million)
- Table 132. Rest of South & Central America Fluorescence In-Situ Hybridization (FISH) Imaging Systems Market, by Product- Revenue and Forecast to 2030 (US$ Million)
- Table 133. Rest of South & Central America Fluorescence In-Situ Hybridization (FISH) Imaging Systems Market, by Instruments - Revenue and Forecast to 2030 (US$ Million)
- Table 134. Rest of South & Central America Fluorescence In-Situ Hybridization (FISH) Imaging Systems Market, by Consumables - Revenue and Forecast to 2030 (US$ Million)
- Table 135. Rest of South & Central America Fluorescence In-Situ Hybridization (FISH) Imaging Systems Market, by Application - Revenue and Forecast to 2030 (US$ Million)
- Table 136. Rest of South & Central America Fluorescence In-Situ Hybridization (FISH) Imaging Systems Market, by End User - Revenue and Forecast to 2030 (US$ Million)
- Table 137. Recent Inorganic Growth Strategies in the Fluorescence In-situ Hybridization (FISH) Imaging Systems Market
- Table 138. Recent Organic Growth Strategies in the Fluorescence In-situ Hybridization (FISH) Imaging Systems Market
- Table 139. Glossary of Terms, Fluorescence In-Situ Hybridization (FISH) Imaging Systems Market
List Of Figures
- Figure 1. Fluorescence In-Situ Hybridization (FISH) Imaging Systems Market Segmentation, By Geography
- Figure 2. Global PEST Analysis
- Figure 3. Fluorescence In-Situ Hybridization (FISH) Imaging Systems Market - Key Industry Dynamics
- Figure 4. Impact Analysis of Drivers and Restraints
- Figure 5. Fluorescence In-Situ Hybridization (FISH) Imaging Systems Market Revenue (US$ Mn), 2022 - 2030
- Figure 6. Fluorescence In-Situ Hybridization (FISH) Imaging Systems Market Revenue Share, by Product 2022 & 2030 (%)
- Figure 7. Instruments: Fluorescence In-Situ Hybridization (FISH) Imaging Systems Market - Revenue and Forecast to 2030 (US$ Million)
- Figure 8. Consumables: Fluorescence In-Situ Hybridization (FISH) Imaging Systems Market - Revenue and Forecast to 2030 (US$ Million)
- Figure 9. Accessories: Fluorescence In-Situ Hybridization (FISH) Imaging Systems Market - Revenue and Forecast to 2030 (US$ Million)
- Figure 10. Software: Fluorescence In-Situ Hybridization (FISH) Imaging Systems Market - Revenue and Forecast to 2030 (US$ Million)
- Figure 11. Fluorescence In-Situ Hybridization (FISH) Imaging Systems Market Revenue Share, by Application 2022 & 2030 (%)
- Figure 12. Cancer Diagnosis: Fluorescence In-Situ Hybridization (FISH) Imaging Systems Market - Revenue and Forecast to 2030 (US$ Million)
- Figure 13. Genetic Disease Diagnosis: Fluorescence In-Situ Hybridization (FISH) Imaging Systems Market - Revenue and Forecast to 2030 (US$ Million)
- Figure 14. Infectious Disease Diagnosis: Fluorescence In-Situ Hybridization (FISH) Imaging Systems Market - Revenue and Forecast to 2030 (US$ Million)
- Figure 15. Others: Fluorescence In-Situ Hybridization (FISH) Imaging Systems Market - Revenue and Forecast to 2030 (US$ Million)
- Figure 16. Fluorescence In-Situ Hybridization (FISH) Imaging Systems Market Revenue Share, by End User 2022 & 2030 (%)
- Figure 17. Diagnostic Laboratories: Fluorescence In-Situ Hybridization (FISH) Imaging Systems Market - Revenue and Forecast to 2030 (US$ Million)
- Figure 18. Contract Research Organization: Fluorescence In-Situ Hybridization (FISH) Imaging Systems Market - Revenue and Forecast to 2030 (US$ Million)
- Figure 19. Pharmaceutical And Biotechnological Companies: Fluorescence In-Situ Hybridization (FISH) Imaging Systems Market - Revenue and Forecast to 2030 (US$ Million)
- Figure 20. Others: Fluorescence In-Situ Hybridization (FISH) Imaging Systems Market - Revenue and Forecast to 2030 (US$ Million)
- Figure 21. North America: Fluorescence In-Situ Hybridization (FISH) Imaging Systems Market, by Key Country - Revenue (2022) (US$ Million)
- Figure 22. North America Fluorescence In-Situ Hybridization (FISH) Imaging Systems Market Revenue and Forecast to 2030 (US$ Million)
- Figure 23. North America: North America, by Country, 2022 & 2030 (%)
- Figure 24. US: Fluorescence In-Situ Hybridization (FISH) Imaging Systems Market - Revenue and Forecast to 2030 (US$ Million)
- Figure 25. Canada: Fluorescence In-Situ Hybridization (FISH) Imaging Systems Market - Revenue and Forecast to 2030 (US$ Million)
- Figure 26. Mexico: Fluorescence In-Situ Hybridization (FISH) Imaging Systems Market - Revenue and Forecast to 2030 (US$ Million)
- Figure 27. Europe Fluorescence In-Situ Hybridization (FISH) Imaging Systems Market, By Geography, 2022 ($Mn)
- Figure 28. Europe Fluorescence In-Situ Hybridization (FISH) Imaging Systems Market Revenue And Forecast to 2030 (US$ Mn)
- Figure 29. Europe Fluorescence In-Situ Hybridization (FISH) Imaging Systems Market, By Key Countries, 2022 And 2030 (%)
- Figure 30. Germany Fluorescence In-Situ Hybridization (FISH) Imaging Systems Market Revenue And Forecast to 2030 (US$ Mn)
- Figure 31. UK Fluorescence In-Situ Hybridization (FISH) Imaging Systems Market Revenue And Forecast to 2030 (US$ Mn)
- Figure 32. France Fluorescence In-Situ Hybridization (FISH) Imaging Systems Market Revenue and Forecast to 2030 (US$ Mn)
- Figure 33. Italy Fluorescence In-Situ Hybridization (FISH) Imaging Systems Market Revenue And Forecast to 2030 (US$ Mn)
- Figure 34. Spain Fluorescence In-Situ Hybridization (FISH) Imaging Systems Market Revenue And Forecast to 2030 (US$ Mn)
- Figure 35. Rest of Europe Fluorescence In-Situ Hybridization (FISH) Imaging Systems Market Revenue And Forecast to 2030 (US$ Mn)
- Figure 36. Asia Pacific: Fluorescence In-Situ Hybridization (FISH) Imaging Systems Market, by Key Country - Revenue (2022) (US$ Million)
- Figure 37. Asia Pacific Fluorescence In-Situ Hybridization (FISH) Imaging Systems Market Revenue and Forecast to 2030 (US$ Million)
- Figure 38. Asia Pacific: Fluorescence In-Situ Hybridization (FISH) Imaging Systems Market, by Country, 2022 & 2030 (%)
- Figure 39. China: Fluorescence In-Situ Hybridization (FISH) Imaging Systems Market - Revenue and Forecast to 2030 (US$ Million)
- Figure 40. Japan: Fluorescence In-Situ Hybridization (FISH) Imaging Systems Market - Revenue and Forecast to 2030 (US$ Million)
- Figure 41. India: Fluorescence In-Situ Hybridization (FISH) Imaging Systems Market - Revenue and Forecast to 2030 (US$ Million)
- Figure 42. Australia: Fluorescence In-Situ Hybridization (FISH) Imaging Systems Market - Revenue and Forecast to 2030 (US$ Million)
- Figure 43. South Korea: Fluorescence In-Situ Hybridization (FISH) Imaging Systems Market - Revenue and Forecast to 2030 (US$ Million)
- Figure 44. Rest of Asia Pacific: Fluorescence In-Situ Hybridization (FISH) Imaging Systems Market - Revenue and Forecast to 2030 (US$ Million)
- Figure 45. Middle East and Africa: Fluorescence In-Situ Hybridization (FISH) Imaging Systems Market, by Key Country - Revenue (2022) (US$ Million)
- Figure 46. Middle East and Africa Fluorescence In-Situ Hybridization (FISH) Imaging Systems Market Revenue and Forecast to 2030 (US$ Million)
- Figure 47. Middle East and Africa: Fluorescence In-Situ Hybridization (FISH) Imaging Systems Market, by Country, 2022 & 2030 (%)
- Figure 48. Saudi Arabia: Fluorescence In-Situ Hybridization (FISH) Imaging Systems Market - Revenue and Forecast to 2030 (US$ Million)
- Figure 49. U.A.E: Fluorescence In-Situ Hybridization (FISH) Imaging Systems Market - Revenue and Forecast to 2030 (US$ Million)
- Figure 50. South Africa: Fluorescence In-Situ Hybridization (FISH) Imaging Systems Market - Revenue and Forecast to 2030 (US$ Million)
- Figure 51. Rest of Middle East and Africa: Fluorescence In-Situ Hybridization (FISH) Imaging Systems Market - Revenue and Forecast to 2030 (US$ Million)
- Figure 52. Fluorescence In-Situ Hybridization (FISH) Imaging Systems Market, By Geography, 2022 ($Mn)
- Figure 53. South & Central America Fluorescence In-Situ Hybridization (FISH) Imaging Systems Market Revenue and Forecast to 2030 (US$ Mn)
- Figure 54. South & Central America Fluorescence In-Situ Hybridization (FISH) Imaging Systems Market, By Key Countries, 2022 and 2030 (%)
- Figure 55. Brazil Fluorescence In-Situ Hybridization (FISH) Imaging Systems Market Revenue and Forecast to 2030 (US$ Mn)
- Figure 56. Argentina Fluorescence In-Situ Hybridization (FISH) Imaging Systems Market Revenue and Forecast to 2030 (US$ Mn)
- Figure 57. Rest of South & Central America Fluorescence In-Situ Hybridization (FISH) Imaging Systems Market Revenue and Forecast to 2030 (US$ Mn)
- Figure 58. Growth Strategies in the Fluorescence In-situ Hybridization (FISH) Imaging Systems Market
The global fluorescence in-situ hybridization (FISH) imaging systems market is expected to reach US$ 1,901.4 million in 2030 from US$ 1,084.0 million in 2022. The market is estimated to grow with a CAGR of 7.3% from 2022 to 2030.
The key factors driving the market's growth are rising prevalence of target disorders and the increasing R&D investments in in-vitro diagnostics. However, high cost of fish imaging systems and procedures is hampering the market's growth to a certain extent.
Market Opportunities of Fluorescence In-Situ Hybridization (FISH) Imaging Systems Market
FISH imaging systems are witnessing a remarkable evolution due to the surge in technological advancements, which result in cutting-edge innovations transforming the landscape of genetic research and diagnostics. These advancements include enhanced optics, more sensitive and versatile fluorophores, and sophisticated automation features. Modern FISH imaging systems, integrated with these upgraded features, offer greater sensitivity, improved image resolution, and faster processing times. Moreover, these technological advancements have extended the application scope of FISH imaging from cancer diagnosis to genetic predisposition testing. In July 2021, BioView and Capio Biosciences collaborated to create a platform for collecting circulating tumor cells (CTCs) from whole blood. By integrating their technologies, these companies further worked on improving the CTC liquid biopsy downstream analysis. Similarly, BioView and Capio Biosciences, in collaboration, partnered with RUBYnanomed in December 2020 to create a unique imaging solution to accelerate the acceptance and adoption of CTC technology in clinics to enhance cancer detection. Thus, technological advancements in FISH imaging systems create significant opportunities for companies in the fluorescence in-situ hybridization (FISH) imaging systems market.
Factors Hampering Fluorescence In-Situ Hybridization (FISH) Imaging Systems Market
Computerized tomography (CT) scan, immunohistochemistry (IHC), bone scan, FISH imaging, magnetic resonance imaging (MRI), positron emission tomography (PET) scan, ultrasound, and X-ray are among the tests used to detect cancer. FISH imaging analysis is a less commonly used method in cancer detection owing to its relatively higher cost compared to other methods. In addition to the cost of equipment, the expenses associated with reagents and other consumables, and specialized personnel appointments can add to the overall cost of evaluation based on FISH imaging. For instance, the detection of ALK gene non-small cell lung cancer by IHC costs US$ 90.07 in the US and US$ 68.69 in Europe for every test, which is less than either independent or parallel testing by FISH and IHC (costing ~US$ 441.85 in the US and US$ 279.46 in Europe per test). Thus, the high cost of procedures and systems limits the growth of the fluorescence in situ hybridization (FISH) imaging systems market.
Fluorescence In-Situ Hybridization (FISH) Imaging Systems Market: Segmental Overview
Based on product, the fluorescence in-situ hybridization (FISH) imaging systems market is segmented into instruments, consumables, accessories, and software. The consumables segment held a larger market share in 2022 and same segment is anticipated to register a higher CAGR. Consumables are the most promising segment of the fluorescence in-situ hybridization (FISH) imaging system market that will contribute to tremendous growth in the coming years. FISH consumables include hybridization buffers, probes, tag detection kits, signal amplification detection kits, and others. The presence of manufacturers such as Abbott, F. Abnova, and Thermo Fisher Scientific bolsters the market for the consumables segment. Additionally, these products are frequently used in various research diagnosis processes, which is expected to propel consumption. Thus, the presence of various market players offering probes & kits and technological advancements by market players are likely to propel the market for the segment in the coming years.
Based on application, the fluorescence in-situ hybridization (FISH) imaging systems market is segmented into cancer diagnosis, genetic disease diagnosis, infectious disease diagnosis, and others. The cancer diagnosis segment held a larger market share in 2022 and same segment is anticipated to register a higher CAGR. FISH technology has tremendously benefited cancer diagnosis. FISH imaging systems can look for gene changes and help detect anomalies. According to Cancer Research UK, FISH testing is used for the diagnosis of several cancers, including breast cancer, lymphoma, lung cancer, prostate cancer, chronic lymphocytic leukemia (CLL), acute lymphoblastic leukemia (ALL), acute myeloid leukemia (AML), chronic myeloid leukemia (CML), myeloma, Ewings sarcoma, and melanoma skin cancer.
Based on end user, the fluorescence in-situ hybridization (FISH) imaging systems market is segmented into diagnostic laboratories, contract research organization, pharmaceutical and biotechnological companies, and others. The diagnostic laboratories segment held a larger market share in 2022 and same segment is anticipated to register a higher CAGR. The diagnostic laboratories are involved in various research projects to develop several technologies and products for fluorescence in-situ hybridization (FISH) imaging processes. Unprecedented developments in research and technologies have created the potential for transformation in the healthcare and life sciences sectors. The clinical applications of fluorescence in-situ hybridization (FISH) imaging systems are vast and offer opportunities to enhance diagnosis and treatment capabilities for chronic disease. They offer huge potential in gene discovery and diagnosis of rare genetic disorders. The technologies are increasingly used to analyze rare and common genetic factors influencing the development of common diseases, such as cancer, high blood pressure, diabetes, and renal diseases.
Fluorescence In-Situ Hybridization (FISH) Imaging Systems Market: Geographical Overview
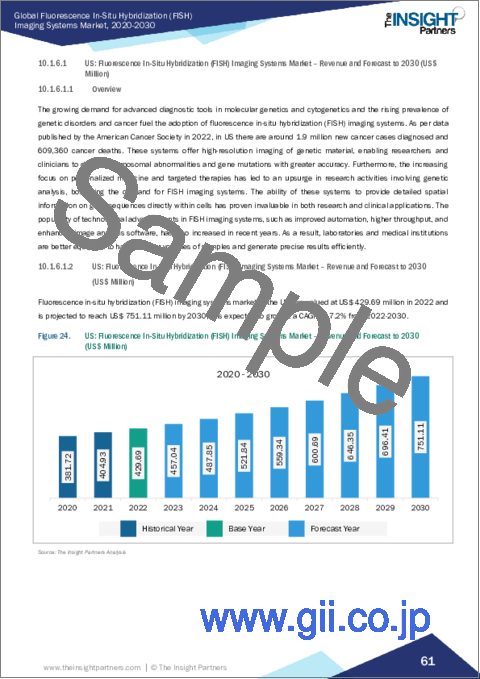
North America accounted for the largest share of the global fluorescence in-situ hybridization (FISH) imaging systems market in 2022. In the region, the US held the largest fluorescence in-situ hybridization (FISH) imaging systems market share and is anticipated to register the highest CAGR during the forecast period. The growing demand for advanced diagnostic tools in molecular genetics and cytogenetics and the rising prevalence of genetic disorders and cancer fuel the adoption of fluorescence in-situ hybridization (FISH) imaging systems. As per data published by the American Cancer Society in 2022, in US there are around 1.9 million new cancer cases diagnosed and 609,360 cancer deaths. These systems offer high-resolution imaging of genetic material, enabling researchers and clinicians to detect chromosomal abnormalities and gene mutations with greater accuracy. Furthermore, the increasing focus on personalized medicine and targeted therapies has led to an upsurge in research activities involving genetic analysis, bolstering the demand for FISH imaging systems. The ability of these systems to provide detailed spatial information on gene sequences directly within cells has proven invaluable in both research and clinical applications. The popularity of technological advancements in FISH imaging systems, such as improved automation, higher throughput, and enhanced image analysis software, has also increased in recent years. As a result, laboratories and medical institutions are better equipped to handle larger volumes of samples and generate precise results efficiently. Thus, the aforementioned factors will fuel the fluorescence in-situ hybridization (FISH) imaging systems market growth in the US.
A few of the major primary and secondary sources referred to while preparing the report on the fluorescence in-situ hybridization (FISH) imaging systems market are the World Bank Data, National Health Service (NHS), FDA (Food and Drug Administration), EMA (European Medicines Agency), and WHO (World Health Organization).
Reasons to Buy:
- Save and reduce time carrying out entry-level research by identifying the growth, size, leading players, and segments in the fluorescence in-situ hybridization (FISH) imaging systems market.
- Highlights key business priorities in order to assist companies to realign their business strategies.
- The key findings and recommendations highlight crucial progressive industry trends in the global fluorescence in-situ hybridization (FISH) imaging systems market, thereby allowing players across the value chain to develop effective long-term strategies.
- Develop/modify business expansion plans by using substantial growth offering developed and emerging markets.
- Scrutinize in-depth global market trends and outlook coupled with the factors driving the fluorescence in-situ hybridization (FISH) imaging systems market, as well as those hindering it.
- Enhance the decision-making process by understanding the strategies that underpin security interest with respect to client products, segmentation, pricing, and distribution.
Table Of Contents
1. Introduction
- 1.1 The Insight Partners Research Report Guidance
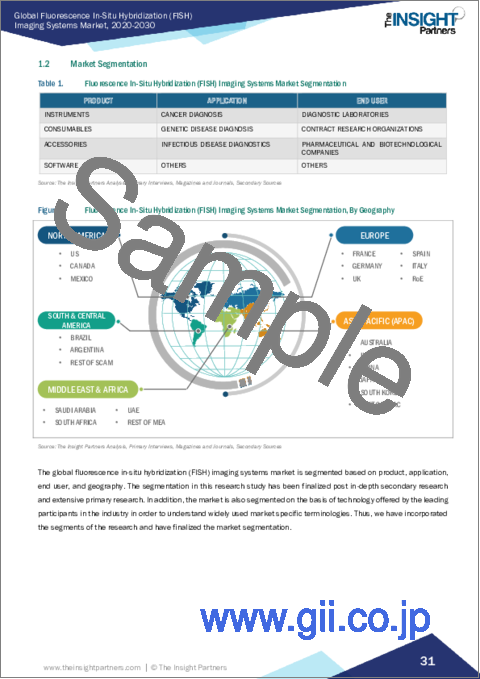
- 1.2 Market Segmentation
2. Executive Summary
- 2.1 Key Insights
- 2.2 Market Attractiveness
3. Research Methodology
- 3.1 Coverage
- 3.2 Secondary Research
- 3.3 Primary Research
4. Fluorescence In-Situ Hybridization (FISH) Imaging Systems Market Landscape
- 4.1 Overview
- 4.2 PEST Analysis
- 4.2.1 Global PEST Analysis
5. Fluorescence In-Situ Hybridization (FISH) Imaging Systems Market - Key Industry Dynamics
- 5.1 Key Market Drivers:
- 5.1.1 Rising Prevalence of Target Disorders
- 5.1.2 Increasing R&D Investments in In-Vitro Diagnostics
- 5.2 Key Market Restraints:
- 5.2.1 High Cost of FISH Imaging Systems and Procedures
- 5.3 Key Market Opportunities:
- 5.3.1 Technological Advancements in Fluorescence In Situ Hybridization Imaging
- 5.4 Future Trends:
- 5.4.1 Automation and Digitalization of FISH Imaging Technique
- 5.5 Impact Analysis:
6. Fluorescence In-Situ Hybridization (FISH) Imaging Systems Market - Global Market Analysis
- 6.1 Fluorescence In-Situ Hybridization (FISH) Imaging Systems Market Revenue (US$ Mn), 2022 - 2030
7. Global Fluorescence In-Situ Hybridization (FISH) Imaging Systems Market - Revenue and Forecast to 2030 - by Product
- 7.1 Overview
- 7.2 Fluorescence In-Situ Hybridization (FISH) Imaging Systems Market Revenue Share, by Product 2022 & 2030 (%)
- 7.3 Instruments
- 7.3.1 Overview
- 7.3.2 Instruments: Fluorescence In-Situ Hybridization (FISH) Imaging Systems Market - Revenue and Forecast to 2030 (US$ Million)
- 7.3.2.1 Instruments: Fluorescence In-Situ Hybridization (FISH) Imaging Systems Market - Revenue and Forecast to 2030 (US$ Million)
- 7.4 Consumables
- 7.4.1 Overview
- 7.4.2 Consumables: Fluorescence In-Situ Hybridization (FISH) Imaging Systems Market - Revenue and Forecast to 2030 (US$ Million)
- 7.4.2.1 Consumables: Fluorescence In-Situ Hybridization (FISH) Imaging Systems Market - Revenue and Forecast to 2030 (US$ Million)
- 7.5 Accessories
- 7.5.1 Overview
- 7.5.2 Accessories: Fluorescence In-Situ Hybridization (FISH) Imaging Systems Market - Revenue and Forecast to 2030 (US$ Million)
- 7.6 Software
- 7.6.1 Overview
- 7.6.2 Software: Fluorescence In-Situ Hybridization (FISH) Imaging Systems Market - Revenue and Forecast to 2030 (US$ Million)
8. Global Fluorescence In-Situ Hybridization (FISH) Imaging Systems Market - Revenue and Forecast to 2030 - by Application
- 8.1 Overview
- 8.2 Fluorescence In-Situ Hybridization (FISH) Imaging Systems Market Revenue Share, by Application 2022 & 2030 (%)
- 8.3 Cancer Diagnosis
- 8.3.1 Overview
- 8.3.2 Cancer Diagnosis: Fluorescence In-Situ Hybridization (FISH) Imaging Systems Market - Revenue and Forecast to 2030 (US$ Million)
- 8.4 Genetic Disease Diagnosis
- 8.4.1 Overview
- 8.4.2 Genetic Disease Diagnosis: Fluorescence In-Situ Hybridization (FISH) Imaging Systems Market - Revenue and Forecast to 2030 (US$ Million)
- 8.5 Infectious Disease Diagnosis
- 8.5.1 Overview
- 8.5.2 Infectious Disease Diagnosis: Fluorescence In-Situ Hybridization (FISH) Imaging Systems Market - Revenue and Forecast to 2030 (US$ Million)
- 8.6 Others
- 8.6.1 Overview
- 8.6.2 Others: Fluorescence In-Situ Hybridization (FISH) Imaging Systems Market - Revenue and Forecast to 2030 (US$ Million)
9. Global Fluorescence In-Situ Hybridization (FISH) Imaging Systems Market - Revenue and Forecast to 2030 - by End User
- 9.1 Overview
- 9.2 Fluorescence In-Situ Hybridization (FISH) Imaging Systems Market Revenue Share, by End User 2022 & 2030 (%)
- 9.3 Diagnostic Laboratories
- 9.3.1 Overview
- 9.3.2 Diagnostic Laboratories: Fluorescence In-Situ Hybridization (FISH) Imaging Systems Market - Revenue and Forecast to 2030 (US$ Million)
- 9.4 Contract Research Organization
- 9.4.1 Overview
- 9.4.2 Contract Research Organization: Fluorescence In-Situ Hybridization (FISH) Imaging Systems Market - Revenue and Forecast to 2030 (US$ Million)
- 9.5 Pharmaceutical And Biotechnological Companies
- 9.5.1 Overview
- 9.5.2 Pharmaceutical and Biotechnological Companies: Fluorescence In-Situ Hybridization (FISH) Imaging Systems Market - Revenue and Forecast to 2030 (US$ Million)
- 9.6 Others
- 9.6.1 Overview
- 9.6.2 Others: Fluorescence In-Situ Hybridization (FISH) Imaging Systems Market - Revenue and Forecast to 2030 (US$ Million)
10. Fluorescence In-Situ Hybridization (FISH) Imaging Systems Market - Geographical Analysis
- 10.1 North America: Fluorescence In-Situ Hybridization (FISH) Imaging Systems Market
- 10.1.1 Overview
- 10.1.2 North America: Fluorescence In-Situ Hybridization (FISH) Imaging Systems Market - Revenue and Forecast to 2030 (US$ Million)
- 10.1.3 North America: Fluorescence In-Situ Hybridization (FISH) Imaging Systems Market, by Product, 2020-2030 (US$ Million)
- 10.1.3.1 North America: Fluorescence In-Situ Hybridization (FISH) Imaging Systems Market, by Instruments, 2020-2030 (US$ Million)
- 10.1.3.2 North America: Fluorescence In-Situ Hybridization (FISH) Imaging Systems Market, by Consumables, 2020-2030 (US$ Million)
- 10.1.4 North America: Fluorescence In-Situ Hybridization (FISH) Imaging Systems Market, by Application, 2020-2030 (US$ Million)
- 10.1.5 North America: Fluorescence In-Situ Hybridization (FISH) Imaging Systems Market, by End User, 2020-2030 (US$ Million)
- 10.1.6 North America: North America, by Country, 2022 & 2030 (%)
- 10.1.6.1 US: Fluorescence In-Situ Hybridization (FISH) Imaging Systems Market - Revenue and Forecast to 2030 (US$ Million)
- 10.1.6.1.1 Overview
- 10.1.6.1.2 US: Fluorescence In-Situ Hybridization (FISH) Imaging Systems Market - Revenue and Forecast to 2030 (US$ Million)
- 10.1.6.1.3 US: Fluorescence In-Situ Hybridization (FISH) Imaging Systems Market, by Product, 2020-2030 (US$ Million)
- 10.1.6.1.3.1 US: Fluorescence In-Situ Hybridization (FISH) Imaging Systems Market, by Instruments, 2020-2030 (US$ Million)
- 10.1.6.1.3.2 US: Fluorescence In-Situ Hybridization (FISH) Imaging Systems Market, by Consumables, 2020-2030 (US$ Million)
- 10.1.6.1.4 US: Fluorescence In-Situ Hybridization (FISH) Imaging Systems Market, by Application, 2020-2030 (US$ Million)
- 10.1.6.1.5 US: Fluorescence In-Situ Hybridization (FISH) Imaging Systems Market, by End User, 2020-2030 (US$ Million)
- 10.1.6.2 Canada: Fluorescence In-Situ Hybridization (FISH) Imaging Systems Market - Revenue and Forecast to 2030 (US$ Million)
- 10.1.6.2.1 Overview
- 10.1.6.2.2 Canada: Fluorescence In-Situ Hybridization (FISH) Imaging Systems Market - Revenue and Forecast to 2030 (US$ Million)
- 10.1.6.2.3 Canada: Fluorescence In-Situ Hybridization (FISH) Imaging Systems Market, by Product, 2020-2030 (US$ Million)
- 10.1.6.2.3.1 Canada: Fluorescence In-Situ Hybridization (FISH) Imaging Systems Market, by Instruments, 2020-2030 (US$ Million)
- 10.1.6.2.3.2 Canada: Fluorescence In-Situ Hybridization (FISH) Imaging Systems Market, by Consumables, 2020-2030 (US$ Million)
- 10.1.6.2.4 Canada: Fluorescence In-Situ Hybridization (FISH) Imaging Systems Market, by Application, 2020-2030 (US$ Million)
- 10.1.6.2.5 Canada: Fluorescence In-Situ Hybridization (FISH) Imaging Systems Market, by End User, 2020-2030 (US$ Million)
- 10.1.6.3 Mexico: Fluorescence In-Situ Hybridization (FISH) Imaging Systems Market - Revenue and Forecast to 2030 (US$ Million)
- 10.1.6.3.1 Overview
- 10.1.6.3.2 Mexico: Fluorescence In-Situ Hybridization (FISH) Imaging Systems Market - Revenue and Forecast to 2030 (US$ Million)
- 10.1.6.3.3 Mexico: Fluorescence In-Situ Hybridization (FISH) Imaging Systems Market, by Product, 2020-2030 (US$ Million)
- 10.1.6.3.3.1 Mexico: Fluorescence In-Situ Hybridization (FISH) Imaging Systems Market, by Instruments, 2020-2030 (US$ Million)
- 10.1.6.3.3.2 Mexico: Fluorescence In-Situ Hybridization (FISH) Imaging Systems Market, by Consumables, 2020-2030 (US$ Million)
- 10.1.6.3.4 Mexico: Fluorescence In-Situ Hybridization (FISH) Imaging Systems Market, by Application, 2020-2030 (US$ Million)
- 10.1.6.3.5 Mexico: Fluorescence In-Situ Hybridization (FISH) Imaging Systems Market, by End User, 2020-2030 (US$ Million)
- 10.1.6.1 US: Fluorescence In-Situ Hybridization (FISH) Imaging Systems Market - Revenue and Forecast to 2030 (US$ Million)
- 10.2 Europe Fluorescence In-Situ Hybridization (FISH) Imaging Systems Market, Revenue and Forecast to 2030
- 10.2.1 Overview
- 10.2.2 Europe Fluorescence In-Situ Hybridization (FISH) Imaging Systems Market Revenue and Forecast to 2030 (US$ Mn)
- 10.2.3 Europe: Fluorescence In-Situ Hybridization (FISH) Imaging Systems Market, by Product, 2020-2030 (US$ Million)
- 10.2.3.1 Europe: Fluorescence In-Situ Hybridization (FISH) Imaging Systems Market, by Instruments, 2020-2030 (US$ Million)
- 10.2.3.2 Europe: Fluorescence In-Situ Hybridization (FISH) Imaging Systems Market, by Consumables, 2020-2030 (US$ Million)
- 10.2.4 Europe: Fluorescence In-Situ Hybridization (FISH) Imaging Systems Market, by Application, 2020-2030 (US$ Million)
- 10.2.5 Europe: Fluorescence In-Situ Hybridization (FISH) Imaging Systems Market, by End User, 2020-2030 (US$ Million)
- 10.2.6 Europe Fluorescence In-Situ Hybridization (FISH) Imaging Systems Market by Country
- 10.2.6.1 Germany
- 10.2.6.1.1 Overview
- 10.2.6.1.2 Germany Fluorescence In-Situ Hybridization (FISH) Imaging Systems Market Revenue and Forecast to 2030 (US$ Mn)
- 10.2.6.1.3 Germany: Fluorescence In-Situ Hybridization (FISH) Imaging Systems Market, by Product, 2020-2030 (US$ Million)
- 10.2.6.1.3.1 Germany: Fluorescence In-Situ Hybridization (FISH) Imaging Systems Market, by Instruments, 2020-2030 (US$ Million)
- 10.2.6.1.3.2 Germany: Fluorescence In-Situ Hybridization (FISH) Imaging Systems Market, by Consumables, 2020-2030 (US$ Million)
- 10.2.6.1.4 Germany: Fluorescence In-Situ Hybridization (FISH) Imaging Systems Market, by Application, 2020-2030 (US$ Million)
- 10.2.6.1.5 Germany: Fluorescence In-Situ Hybridization (FISH) Imaging Systems Market, by End User, 2020-2030 (US$ Million)
- 10.2.6.2 UK
- 10.2.6.2.1 Overview
- 10.2.6.2.2 UK: Fluorescence In-Situ Hybridization (FISH) Imaging Systems Market Revenue and Forecast to 2030 (US$ Mn)
- 10.2.6.2.3 UK: Fluorescence In-Situ Hybridization (FISH) Imaging Systems Market, by Product, 2020-2030 (US$ Million)
- 10.2.6.2.3.1 UK: Fluorescence In-Situ Hybridization (FISH) Imaging Systems Market, by Instruments, 2020-2030 (US$ Million)
- 10.2.6.2.3.2 UK: Fluorescence In-Situ Hybridization (FISH) Imaging Systems Market, by Consumables, 2020-2030 (US$ Million)
- 10.2.6.2.4 UK: Fluorescence In-Situ Hybridization (FISH) Imaging Systems Market, by Application, 2020-2030 (US$ Million)
- 10.2.6.2.5 UK: Fluorescence In-Situ Hybridization (FISH) Imaging Systems Market, by End User, 2020-2030 (US$ Million)
- 10.2.6.3 France
- 10.2.6.3.1 Overview
- 10.2.6.3.2 France Fluorescence In-Situ Hybridization (FISH) Imaging Systems Market Revenue and Forecast to 2030 (US$ Mn)
- 10.2.6.3.3 France: Fluorescence In-Situ Hybridization (FISH) Imaging Systems Market, by Product, 2020-2030 (US$ Million)
- 10.2.6.3.3.1 France: Fluorescence In-Situ Hybridization (FISH) Imaging Systems Market, by Instruments, 2020-2030 (US$ Million)
- 10.2.6.3.3.2 France: Fluorescence In-Situ Hybridization (FISH) Imaging Systems Market, by Consumables, 2020-2030 (US$ Million)
- 10.2.6.3.4 France: Fluorescence In-Situ Hybridization (FISH) Imaging Systems Market, by Application, 2020-2030 (US$ Million)
- 10.2.6.3.5 France: Fluorescence In-Situ Hybridization (FISH) Imaging Systems Market, by End User, 2020-2030 (US$ Million)
- 10.2.6.4 Italy
- 10.2.6.4.1 Overview
- 10.2.6.4.2 Italy Fluorescence In-Situ Hybridization (FISH) Imaging Systems Market Revenue and Forecast to 2030 (US$ Mn)
- 10.2.6.4.3 Italy: Fluorescence In-Situ Hybridization (FISH) Imaging Systems Market, by Product, 2020-2030 (US$ Million)
- 10.2.6.4.3.1 Italy: Fluorescence In-Situ Hybridization (FISH) Imaging Systems Market, by Instruments, 2020-2030 (US$ Million)
- 10.2.6.4.3.2 Italy: Fluorescence In-Situ Hybridization (FISH) Imaging Systems Market, by Consumables, 2020-2030 (US$ Million)
- 10.2.6.4.4 Italy: Fluorescence In-Situ Hybridization (FISH) Imaging Systems Market, by Application, 2020-2030 (US$ Million)
- 10.2.6.4.5 Italy: Fluorescence In-Situ Hybridization (FISH) Imaging Systems Market, by End User, 2020-2030 (US$ Million)
- 10.2.6.5 Spain
- 10.2.6.5.1 Overview
- 10.2.6.5.2 Spain Fluorescence In-Situ Hybridization (FISH) Imaging Systems Market Revenue and Forecast to 2030 (US$ Mn)
- 10.2.6.5.3 Spain: Fluorescence In-Situ Hybridization (FISH) Imaging Systems Market, by Product, 2020-2030 (US$ Million)
- 10.2.6.5.3.1 Spain: Fluorescence In-Situ Hybridization (FISH) Imaging Systems Market, by Instruments, 2020-2030 (US$ Million)
- 10.2.6.5.3.2 Spain: Fluorescence In-Situ Hybridization (FISH) Imaging Systems Market, by Consumables, 2020-2030 (US$ Million)
- 10.2.6.5.4 Spain: Fluorescence In-Situ Hybridization (FISH) Imaging Systems Market, by Application, 2020-2030 (US$ Million)
- 10.2.6.5.5 Spain: Fluorescence In-Situ Hybridization (FISH) Imaging Systems Market, by End User, 2020-2030 (US$ Million)
- 10.2.6.6 Rest of Europe
- 10.2.6.6.1 Overview
- 10.2.6.6.2 Rest of Europe Fluorescence In-Situ Hybridization (FISH) Imaging Systems Market Revenue and Forecast to 2030 (US$ Mn)
- 10.2.6.6.3 Rest of Europe: Fluorescence In-Situ Hybridization (FISH) Imaging Systems Market, by Product, 2020-2030 (US$ Million)
- 10.2.6.6.3.1 Rest of Europe: Fluorescence In-Situ Hybridization (FISH) Imaging Systems Market, by Instruments, 2020-2030 (US$ Million)
- 10.2.6.6.3.2 Rest of Europe: Fluorescence In-Situ Hybridization (FISH) Imaging Systems Market, by Consumables, 2020-2030 (US$ Million)
- 10.2.6.6.4 Rest of Europe: Fluorescence In-Situ Hybridization (FISH) Imaging Systems Market, by Application, 2020-2030 (US$ Million)
- 10.2.6.6.5 Rest of Europe: Fluorescence In-Situ Hybridization (FISH) Imaging Systems Market, by End User, 2020-2030 (US$ Million)
- 10.2.6.1 Germany
- 10.3 Asia Pacific: Fluorescence In-Situ Hybridization (FISH) Imaging Systems Market
- 10.3.1 Overview
- 10.3.2 Asia Pacific: Fluorescence In-Situ Hybridization (FISH) Imaging Systems Market - Revenue and Forecast to 2030 (US$ Million)
- 10.3.3 Asia Pacific: Fluorescence In-Situ Hybridization (FISH) Imaging Systems Market, by Product, 2020-2030 (US$ Million)
- 10.3.3.1 Asia Pacific: Fluorescence In-Situ Hybridization (FISH) Imaging Systems Market, by Instruments, 2020-2030 (US$ Million)
- 10.3.3.2 Asia Pacific: Fluorescence In-Situ Hybridization (FISH) Imaging Systems Market, by Consumables, 2020-2030 (US$ Million)
- 10.3.4 Asia Pacific: Fluorescence In-Situ Hybridization (FISH) Imaging Systems Market, by Application, 2020-2030 (US$ Million)
- 10.3.5 Asia Pacific: Fluorescence In-Situ Hybridization (FISH) Imaging Systems Market, by End User, 2020-2030 (US$ Million)
- 10.3.6 Asia Pacific: Fluorescence In-Situ Hybridization (FISH) Imaging Systems Market, by Country, 2022 & 2030 (%)
- 10.3.6.1 China: Fluorescence In-Situ Hybridization (FISH) Imaging Systems Market - Revenue and Forecast to 2030 (US$ Million)
- 10.3.6.1.1 Overview
- 10.3.6.1.2 China: Fluorescence In-Situ Hybridization (FISH) Imaging Systems Market - Revenue and Forecast to 2030 (US$ Million)
- 10.3.6.1.3 China: Fluorescence In-Situ Hybridization (FISH) Imaging Systems Market, by Product, 2020-2030 (US$ Million)
- 10.3.6.1.3.1 China: Fluorescence In-Situ Hybridization (FISH) Imaging Systems Market, by Instruments, 2020-2030 (US$ Million)
- 10.3.6.1.3.2 China: Fluorescence In-Situ Hybridization (FISH) Imaging Systems Market, by Consumables, 2020-2030 (US$ Million)
- 10.3.6.1.4 China: Fluorescence In-Situ Hybridization (FISH) Imaging Systems Market, by Application, 2020-2030 (US$ Million)
- 10.3.6.1.5 China: Fluorescence In-Situ Hybridization (FISH) Imaging Systems Market, by End User, 2020-2030 (US$ Million)
- 10.3.6.2 Japan: Fluorescence In-Situ Hybridization (FISH) Imaging Systems Market - Revenue and Forecast to 2030 (US$ Million)
- 10.3.6.2.1 Overview
- 10.3.6.2.2 Japan: Fluorescence In-Situ Hybridization (FISH) Imaging Systems Market - Revenue and Forecast to 2030 (US$ Million)
- 10.3.6.2.3 Japan: Fluorescence In-Situ Hybridization (FISH) Imaging Systems Market, by Product, 2020-2030 (US$ Million)
- 10.3.6.2.3.1 Japan: Fluorescence In-Situ Hybridization (FISH) Imaging Systems Market, by Instruments, 2020-2030 (US$ Million)
- 10.3.6.2.3.2 Japan: Fluorescence In-Situ Hybridization (FISH) Imaging Systems Market, by Consumables, 2020-2030 (US$ Million)
- 10.3.6.2.4 Japan: Fluorescence In-Situ Hybridization (FISH) Imaging Systems Market, by Application, 2020-2030 (US$ Million)
- 10.3.6.2.5 Japan: Fluorescence In-Situ Hybridization (FISH) Imaging Systems Market, by End User, 2020-2030 (US$ Million)
- 10.3.6.3 India: Fluorescence In-Situ Hybridization (FISH) Imaging Systems Market - Revenue and Forecast to 2030 (US$ Million)
- 10.3.6.3.1 Overview
- 10.3.6.3.2 India: Fluorescence In-Situ Hybridization (FISH) Imaging Systems Market - Revenue and Forecast to 2030 (US$ Million)
- 10.3.6.3.3 India: Fluorescence In-Situ Hybridization (FISH) Imaging Systems Market, by Product, 2020-2030 (US$ Million)
- 10.3.6.3.3.1 India: Fluorescence In-Situ Hybridization (FISH) Imaging Systems Market, by Instruments, 2020-2030 (US$ Million)
- 10.3.6.3.3.2 India: Fluorescence In-Situ Hybridization (FISH) Imaging Systems Market, by Consumables, 2020-2030 (US$ Million)
- 10.3.6.3.4 India: Fluorescence In-Situ Hybridization (FISH) Imaging Systems Market, by Application, 2020-2030 (US$ Million)
- 10.3.6.3.5 India: Fluorescence In-Situ Hybridization (FISH) Imaging Systems Market, by End User, 2020-2030 (US$ Million)
- 10.3.6.4 Australia: Fluorescence In-Situ Hybridization (FISH) Imaging Systems Market - Revenue and Forecast to 2030 (US$ Million)
- 10.3.6.4.1 Overview
- 10.3.6.4.2 Australia: Fluorescence In-Situ Hybridization (FISH) Imaging Systems Market - Revenue and Forecast to 2030 (US$ Million)
- 10.3.6.4.3 Australia: Fluorescence In-Situ Hybridization (FISH) Imaging Systems Market, by Product, 2020-2030 (US$ Million)
- 10.3.6.4.3.1 Australia: Fluorescence In-Situ Hybridization (FISH) Imaging Systems Market, by Instruments, 2020-2030 (US$ Million)
- 10.3.6.4.3.2 Australia: Fluorescence In-Situ Hybridization (FISH) Imaging Systems Market, by Consumables, 2020-2030 (US$ Million)
- 10.3.6.4.4 Australia: Fluorescence In-Situ Hybridization (FISH) Imaging Systems Market, by Application, 2020-2030 (US$ Million)
- 10.3.6.4.5 Australia: Fluorescence In-Situ Hybridization (FISH) Imaging Systems Market, by End User, 2020-2030 (US$ Million)
- 10.3.6.5 South Korea: Fluorescence In-Situ Hybridization (FISH) Imaging Systems Market - Revenue and Forecast to 2030 (US$ Million)
- 10.3.6.5.1 Overview
- 10.3.6.5.2 South Korea: Fluorescence In-Situ Hybridization (FISH) Imaging Systems Market - Revenue and Forecast to 2030 (US$ Million)
- 10.3.6.5.3 South Korea: Fluorescence In-Situ Hybridization (FISH) Imaging Systems Market, by Product, 2020-2030 (US$ Million)
- 10.3.6.5.3.1 South Korea: Fluorescence In-Situ Hybridization (FISH) Imaging Systems Market, by Instruments, 2020-2030 (US$ Million)
- 10.3.6.5.3.2 South Korea: Fluorescence In-Situ Hybridization (FISH) Imaging Systems Market, by Consumables, 2020-2030 (US$ Million)
- 10.3.6.5.4 South Korea: Fluorescence In-Situ Hybridization (FISH) Imaging Systems Market, by Application, 2020-2030 (US$ Million)
- 10.3.6.5.5 South Korea: Fluorescence In-Situ Hybridization (FISH) Imaging Systems Market, by End User, 2020-2030 (US$ Million)
- 10.3.6.6 Rest of Asia Pacific: Fluorescence In-Situ Hybridization (FISH) Imaging Systems Market - Revenue and Forecast to 2030 (US$ Million)
- 10.3.6.6.1 Overview
- 10.3.6.6.2 Rest of Asia Pacific: Fluorescence In-Situ Hybridization (FISH) Imaging Systems Market - Revenue and Forecast to 2030 (US$ Million)
- 10.3.6.6.3 Rest of Asia Pacific: Fluorescence In-Situ Hybridization (FISH) Imaging Systems Market, by Product, 2020-2030 (US$ Million)
- 10.3.6.6.3.1 Rest of Asia Pacific: Fluorescence In-Situ Hybridization (FISH) Imaging Systems Market, by Instruments, 2020-2030 (US$ Million)
- 10.3.6.6.3.2 Rest of Asia Pacific: Fluorescence In-Situ Hybridization (FISH) Imaging Systems Market, by Consumables, 2020-2030 (US$ Million)
- 10.3.6.6.4 Rest of Asia Pacific: Fluorescence In-Situ Hybridization (FISH) Imaging Systems Market, by Application, 2020-2030 (US$ Million)
- 10.3.6.6.5 Rest of Asia Pacific: Fluorescence In-Situ Hybridization (FISH) Imaging Systems Market, by End User, 2020-2030 (US$ Million)
- 10.3.6.1 China: Fluorescence In-Situ Hybridization (FISH) Imaging Systems Market - Revenue and Forecast to 2030 (US$ Million)
- 10.4 Middle East and Africa: Fluorescence In-Situ Hybridization (FISH) Imaging Systems Market
- 10.4.1 Overview
- 10.4.2 Middle East and Africa: Fluorescence In-Situ Hybridization (FISH) Imaging Systems Market - Revenue and Forecast to 2030 (US$ Million)
- 10.4.3 Middle East and Africa: Fluorescence In-Situ Hybridization (FISH) Imaging Systems Market, by Product, 2020-2030 (US$ Million)
- 10.4.3.1 Middle East and Africa: Fluorescence In-Situ Hybridization (FISH) Imaging Systems Market, by Instruments, 2020-2030 (US$ Million)
- 10.4.3.2 Middle East and Africa: Fluorescence In-Situ Hybridization (FISH) Imaging Systems Market, by Consumables, 2020-2030 (US$ Million)
- 10.4.4 Middle East and Africa: Fluorescence In-Situ Hybridization (FISH) Imaging Systems Market, by Application, 2020-2030 (US$ Million)
- 10.4.5 Middle East and Africa: Fluorescence In-Situ Hybridization (FISH) Imaging Systems Market, by End User, 2020-2030 (US$ Million)
- 10.4.6 Middle East and Africa: Fluorescence In-Situ Hybridization (FISH) Imaging Systems Market, by Country, 2022 & 2030 (%)
- 10.4.6.1 Saudi Arabia: Fluorescence In-Situ Hybridization (FISH) Imaging Systems Market - Revenue and Forecast to 2030 (US$ Million)
- 10.4.6.1.1 Overview
- 10.4.6.1.2 Saudi Arabia: Fluorescence In-Situ Hybridization (FISH) Imaging Systems Market - Revenue and Forecast to 2030 (US$ Million)
- 10.4.6.1.3 Saudi Arabia: Fluorescence In-Situ Hybridization (FISH) Imaging Systems Market, by Product, 2020-2030 (US$ Million)
- 10.4.6.1.3.1 Saudi Arabia: Fluorescence In-Situ Hybridization (FISH) Imaging Systems Market, by Instruments, 2020-2030 (US$ Million)
- 10.4.6.1.3.2 Saudi Arabia: Fluorescence In-Situ Hybridization (FISH) Imaging Systems Market, by Consumables, 2020-2030 (US$ Million)
- 10.4.6.1.4 Saudi Arabia: Fluorescence In-Situ Hybridization (FISH) Imaging Systems Market, by Application, 2020-2030 (US$ Million)
- 10.4.6.1.5 Saudi Arabia: Fluorescence In-Situ Hybridization (FISH) Imaging Systems Market, by End User, 2020-2030 (US$ Million)
- 10.4.6.2 U.A.E: Fluorescence In-Situ Hybridization (FISH) Imaging Systems Market - Revenue and Forecast to 2030 (US$ Million)
- 10.4.6.2.1 Overview
- 10.4.6.2.2 U.A.E: Fluorescence In-Situ Hybridization (FISH) Imaging Systems Market - Revenue and Forecast to 2030 (US$ Million)
- 10.4.6.2.3 U.A.E: Fluorescence In-Situ Hybridization (FISH) Imaging Systems Market, by Product, 2020-2030 (US$ Million)
- 10.4.6.2.3.1 U.A.E: Fluorescence In-Situ Hybridization (FISH) Imaging Systems Market, by Instruments, 2020-2030 (US$ Million)
- 10.4.6.2.3.2 U.A.E: Fluorescence In-Situ Hybridization (FISH) Imaging Systems Market, by Consumables, 2020-2030 (US$ Million)
- 10.4.6.2.4 U.A.E: Fluorescence In-Situ Hybridization (FISH) Imaging Systems Market, by Application, 2020-2030 (US$ Million)
- 10.4.6.2.5 U.A.E: Fluorescence In-Situ Hybridization (FISH) Imaging Systems Market, by End User, 2020-2030 (US$ Million)
- 10.4.6.3 South Africa: Fluorescence In-Situ Hybridization (FISH) Imaging Systems Market - Revenue and Forecast to 2030 (US$ Million)
- 10.4.6.3.1 Overview
- 10.4.6.3.2 South Africa: Fluorescence In-Situ Hybridization (FISH) Imaging Systems Market - Revenue and Forecast to 2030 (US$ Million)
- 10.4.6.3.3 South Africa: Fluorescence In-Situ Hybridization (FISH) Imaging Systems Market, by Product, 2020-2030 (US$ Million)
- 10.4.6.3.3.1 South Africa: Fluorescence In-Situ Hybridization (FISH) Imaging Systems Market, by Instruments, 2020-2030 (US$ Million)
- 10.4.6.3.3.2 South Africa: Fluorescence In-Situ Hybridization (FISH) Imaging Systems Market, by Consumables, 2020-2030 (US$ Million)
- 10.4.6.3.4 South Africa: Fluorescence In-Situ Hybridization (FISH) Imaging Systems Market, by Application, 2020-2030 (US$ Million)
- 10.4.6.3.5 South Africa: Fluorescence In-Situ Hybridization (FISH) Imaging Systems Market, by End User, 2020-2030 (US$ Million)
- 10.4.6.4 Rest of Middle East and Africa: Fluorescence In-Situ Hybridization (FISH) Imaging Systems Market - Revenue and Forecast to 2030 (US$ Million)
- 10.4.6.4.1 Overview
- 10.4.6.4.2 Rest of Middle East and Africa: Fluorescence In-Situ Hybridization (FISH) Imaging Systems Market - Revenue and Forecast to 2030 (US$ Million)
- 10.4.6.4.3 Rest of Middle East and Africa: Fluorescence In-Situ Hybridization (FISH) Imaging Systems Market, by Product, 2020-2030 (US$ Million)
- 10.4.6.4.3.1 Rest of Middle East and Africa: Fluorescence In-Situ Hybridization (FISH) Imaging Systems Market, by Instruments, 2020-2030 (US$ Million)
- 10.4.6.4.3.2 Rest of Middle East and Africa: Fluorescence In-Situ Hybridization (FISH) Imaging Systems Market, by Consumables, 2020-2030 (US$ Million)
- 10.4.6.4.4 Rest of Middle East and Africa: Fluorescence In-Situ Hybridization (FISH) Imaging Systems Market, by Application, 2020-2030 (US$ Million)
- 10.4.6.4.5 Rest of Middle East and Africa: Fluorescence In-Situ Hybridization (FISH) Imaging Systems Market, by End User, 2020-2030 (US$ Million)
- 10.4.6.1 Saudi Arabia: Fluorescence In-Situ Hybridization (FISH) Imaging Systems Market - Revenue and Forecast to 2030 (US$ Million)
- 10.5 South & Central America Fluorescence In-Situ Hybridization (FISH) Imaging Systems Market, Revenue and Forecast to 2030
- 10.5.1 Overview
- 10.5.2 South & Central America Fluorescence In-Situ Hybridization (FISH) Imaging Systems Market Revenue and Forecast to 2030 (US$ Mn)
- 10.5.2.1 South and Central America: Fluorescence In-Situ Hybridization (FISH) Imaging Systems Market, by Instruments, 2020-2030 (US$ Million)
- 10.5.2.2 South and Central America: Fluorescence In-Situ Hybridization (FISH) Imaging Systems Market, by Consumables, 2020-2030 (US$ Million)
- 10.5.3 South and Central America: Fluorescence In-Situ Hybridization (FISH) Imaging Systems Market, by Application, 2020-2030 (US$ Million)
- 10.5.4 South and Central America: Fluorescence In-Situ Hybridization (FISH) Imaging Systems Market, by End User, 2020-2030 (US$ Million)
- 10.5.5 South & Central America Fluorescence In-Situ Hybridization (FISH) Imaging Systems Market by Country
- 10.5.5.1 Brazil
- 10.5.5.1.1 Overview
- 10.5.5.1.2 Brazil Fluorescence In-Situ Hybridization (FISH) Imaging Systems Market Revenue and Forecast to 2030 (US$ Mn)
- 10.5.5.1.3 Brazil: Fluorescence In-Situ Hybridization (FISH) Imaging Systems Market, by Product, 2020-2030 (US$ Million)
- 10.5.5.1.3.1 Brazil: Fluorescence In-Situ Hybridization (FISH) Imaging Systems Market, by Instruments, 2020-2030 (US$ Million)
- 10.5.5.1.3.2 Brazil: Fluorescence In-Situ Hybridization (FISH) Imaging Systems Market, by Consumables, 2020-2030 (US$ Million)
- 10.5.5.1.4 Brazil: Fluorescence In-Situ Hybridization (FISH) Imaging Systems Market, by Application, 2020-2030 (US$ Million)
- 10.5.5.1.5 Brazil: Fluorescence In-Situ Hybridization (FISH) Imaging Systems Market, by End User, 2020-2030 (US$ Million)
- 10.5.5.2 Argentina
- 10.5.5.2.1 Overview
- 10.5.5.2.2 Argentina Fluorescence In-Situ Hybridization (FISH) Imaging Systems Market Revenue and Forecast to 2030 (US$ Mn)
- 10.5.5.2.3 Argentina: Fluorescence In-Situ Hybridization (FISH) Imaging Systems Market, by Product, 2020-2030 (US$ Million)
- 10.5.5.2.3.1 Argentina: Fluorescence In-Situ Hybridization (FISH) Imaging Systems Market, by Instruments, 2020-2030 (US$ Million)
- 10.5.5.2.3.2 Argentina: Fluorescence In-Situ Hybridization (FISH) Imaging Systems Market, by Consumables, 2020-2030 (US$ Million)
- 10.5.5.2.4 Argentina: Fluorescence In-Situ Hybridization (FISH) Imaging Systems Market, by Application, 2020-2030 (US$ Million)
- 10.5.5.2.5 Argentina: Fluorescence In-Situ Hybridization (FISH) Imaging Systems Market, by End User, 2020-2030 (US$ Million)
- 10.5.5.3 Rest of South & Central America
- 10.5.5.3.1 Overview
- 10.5.5.3.2 Rest of South & Central America Fluorescence In-Situ Hybridization (FISH) Imaging Systems Market Revenue and Forecast to 2030 (US$ Mn)
- 10.5.5.3.3 Rest of South & Central America: Fluorescence In-Situ Hybridization (FISH) Imaging Systems Market, by Product, 2020-2030 (US$ Million)
- 10.5.5.3.3.1 Rest of South & Central America: Fluorescence In-Situ Hybridization (FISH) Imaging Systems Market, by Instruments, 2020-2030 (US$ Million)
- 10.5.5.3.3.2 Rest of South & Central America: Fluorescence In-Situ Hybridization (FISH) Imaging Systems Market, by Consumables, 2020-2030 (US$ Million)
- 10.5.5.3.4 Rest of South & Central America: Fluorescence In-Situ Hybridization (FISH) Imaging Systems Market, by Application, 2020-2030 (US$ Million)
- 10.5.5.3.5 Rest of South & Central America: Fluorescence In-Situ Hybridization (FISH) Imaging Systems Market, by End User, 2020-2030 (US$ Million)
- 10.5.5.1 Brazil
11. Fluorescence In-situ Hybridization (FISH) Imaging Systems Market Industry Landscape
- 11.1 Overview
- 11.2 Growth Strategies in the Fluorescence In-situ Hybridization (FISH) Imaging Systems Market
- 11.3 Inorganic Growth Strategies
- 11.3.1 Overview
- 11.4 Organic Growth Strategies
- 11.4.1 Overview
12. Company Profiles
- 12.1 Euroclone SpA
- 12.1.1 Key Facts
- 12.1.2 Business Description
- 12.1.3 Products and Services
- 12.1.4 Financial Overview
- 12.1.5 SWOT Analysis
- 12.1.6 Key Developments
- 12.2 TissueGnostics GmbH
- 12.2.1 Key Facts
- 12.2.2 Business Description
- 12.2.3 Products and Services
- 12.2.4 Financial Overview
- 12.2.5 SWOT Analysis
- 12.2.6 Key Developments
- 12.3 Agilent Technologies Inc
- 12.3.1 Key Facts
- 12.3.2 Business Description
- 12.3.3 Products and Services
- 12.3.4 Financial Overview
- 12.3.5 SWOT Analysis
- 12.3.6 Key Developments
- 12.4 Abnova Taiwan Corp
- 12.4.1 Key Facts
- 12.4.2 Business Description
- 12.4.3 Products and Services
- 12.4.4 Financial Overview
- 12.4.5 SWOT Analysis
- 12.4.6 Key Developments
- 12.5 BioGenex Laboratories Inc
- 12.5.1 Key Facts
- 12.5.2 Business Description
- 12.5.3 Products and Services
- 12.5.4 Financial Overview
- 12.5.5 SWOT Analysis
- 12.5.6 Key Developments
- 12.6 Leica Biosystems Nussloch GmbH
- 12.6.1 Key Facts
- 12.6.2 Business Description
- 12.6.3 Products and Services
- 12.6.4 Financial Overview
- 12.6.5 SWOT Analysis
- 12.6.6 Key Developments
- 12.7 MetaSystems Probes GmbH
- 12.7.1 Key Facts
- 12.7.2 Business Description
- 12.7.3 Products and Services
- 12.7.4 Financial Overview
- 12.7.5 SWOT Analysis
- 12.7.6 Key Developments
- 12.8 Bio-View Ltd
- 12.8.1 Key Facts
- 12.8.2 Business Description
- 12.8.3 Products and Services
- 12.8.4 Financial Overview
- 12.8.5 SWOT Analysis
- 12.8.6 Key Developments
- 12.9 Thermo Fisher Scientific Inc
- 12.9.1 Key Facts
- 12.9.2 Business Description
- 12.9.3 Products and Services
- 12.9.4 Financial Overview
- 12.9.5 SWOT Analysis
- 12.9.6 Key Developments
- 12.10 Applied Spectral Imaging
- 12.10.1 Key Facts
- 12.10.2 Business Description
- 12.10.3 Products and Services
- 12.10.4 Financial Overview
- 12.10.5 SWOT Analysis
- 12.10.6 Key Developments
- 12.11 PerkinElmer Inc
- 12.11.1 Key Facts
- 12.11.2 Business Description
- 12.11.3 Products and Services
- 12.11.4 Financial Overview
- 12.11.5 SWOT Analysis
- 12.11.6 Key Developments
13. Appendix
- 13.1 About Us
- 13.2 Glossary of Terms
