|
|
市場調査レポート
商品コード
1452562
アジア太平洋の蛍光In-Situハイブリダイゼーションイメージングシステム市場の2030年までの予測-地域別分析-製品別、用途別、エンドユーザー別Asia Pacific Fluorescence In-Situ Hybridization Imaging Systems Market Forecast to 2030 - Regional Analysis - By Product, Application, and End User |
||||||
|
|||||||
|
|||||||

| アジア太平洋の蛍光In-Situハイブリダイゼーションイメージングシステム市場の2030年までの予測-地域別分析-製品別、用途別、エンドユーザー別 |
|
出版日: 2024年01月04日
発行: The Insight Partners
ページ情報: 英文 106 Pages
納期: 即納可能
|

全表示
- 概要
- 図表
- 目次
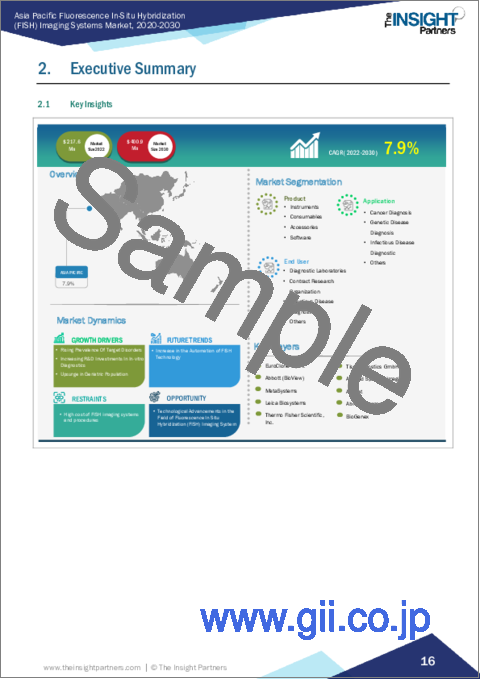
アジア太平洋の蛍光In-Situハイブリダイゼーションイメージングシステム市場は、2022年の2億1,760万米ドルから2030年には4億90万米ドルに成長すると予測されています。2022年から2030年までのCAGRは7.9%と推定されます。
体外診断への研究開発投資の増加がアジア太平洋の蛍光In-Situハイブリダイゼーションイメージングシステム市場を後押し
アジア太平洋の蛍光In-Situハイブリダイゼーションイメージングシステム市場は、体外診断(IVD)関連の研究開発(R&D)活動への継続的な投資によって牽引されています。細胞環境内の特定のDNA配列を可視化するユニークな機能を持つFISH技術は、現代の診断エコシステムにおいて、特に遺伝性疾患や希少疾患の検出において重要な手順として浮上しています。IVDにおける研究開発資金の急増は、研究者が合理化された自動化をサポートする機能を備えた強化された画質を提供する最先端のプラットフォームを作成することを可能にすることにより、蛍光In-Situハイブリダイゼーションイメージングシステムにおける変革的な進歩を触媒し、より正確で迅速な診断プロセスに結実させました。PNA FISHは、ペプチド核酸(PNA)プローブを用いてFISHを行う新しい診断法であり、従来の染色手順の容易さとPNAプローブの卓越した性能を組み合わせることで、伝染性疾患の迅速かつ正確な診断を可能にします。
アジア太平洋の蛍光In-Situハイブリダイゼーションイメージングシステム市場概要
アジア太平洋の蛍光In-Situハイブリダイゼーションイメージングシステム市場は、予測期間中に最も高いCAGRを記録すると予想されます。この地域市場は、各国のがん有病率の高さ、医療機器業界を改善するための政府の取り組み、堅調な医療機器製造などの要因により、今後数年間で急成長が見込まれています。インドネシア、インド、中国のデリバリーセンターが、この地域のアウトソーシングサービスをサポートしています。さらに、遺伝性疾患や感染症の増加により、アジア太平洋の蛍光In-Situハイブリダイゼーションイメージングシステム市場の成長は著しく拡大しています。
アジア太平洋の蛍光In-Situハイブリダイゼーションイメージングシステム市場の収益と2030年までの予測(金額)
アジア太平洋の蛍光In-Situハイブリダイゼーションイメージングシステム市場のセグメンテーション
アジア太平洋の蛍光In-Situハイブリダイゼーションイメージングシステム市場は、製品、用途、エンドユーザー、国別に区分されます。
製品別では、アジア太平洋の蛍光In-Situハイブリダイゼーションイメージングシステム市場は、機器、消耗品、付属品、ソフトウェアに区分されます。消耗品セグメントは、2022年のアジア太平洋蛍光In-Situハイブリダイゼーションイメージングシステム市場で最大のシェアを占めました。
用途別では、アジア太平洋の蛍光In-Situハイブリダイゼーションイメージングシステム市場は、がん診断、遺伝病診断、感染症診断、その他に区分されます。2022年のアジア太平洋蛍光In-Situハイブリダイゼーションイメージングシステム市場では、がん診断セグメントが最大のシェアを占めています。
エンドユーザー別では、アジア太平洋の蛍光In-Situハイブリダイゼーションイメージングシステム市場は、診断ラボ、契約研究機関、製薬・バイオテクノロジー企業、その他に区分されます。2022年のアジア太平洋蛍光In-Situハイブリダイゼーションイメージングシステム市場では、診断ラボセグメントが最大のシェアを占めています。
国別では、アジア太平洋蛍光In-Situハイブリダイゼーションイメージング市場は、中国、日本、インド、韓国、オーストラリア、その他のアジア太平洋に区分されます。2022年のアジア太平洋蛍光In-Situハイブリダイゼーションイメージングシステム市場は中国が支配的でした。
Euroclone SpA、Tissuegnostics Gmbh、Agilent Technologies Inc、Abnova Taiwan Corp、Biogenex Laboratories Inc、Leica Biosystems Nussloch Gmbh、Metasystems Probes Gmbh、Bio-View Ltd、Thermo Fisher Scientific Incは、アジア太平洋の蛍光In-Situハイブリダイゼーションイメージングシステム市場で事業展開している大手企業の一部です。
目次
第1章 イントロダクション
第2章 エグゼクティブサマリー
- 主要な洞察
第3章 調査手法
- 調査範囲
- 2次調査
- 1次調査
第4章 アジア太平洋の蛍光In-Situハイブリダイゼーションイメージングシステム市場-主要産業力学
- 主要市場の促進要因
- 対象疾患の有病率の上昇
- 体外診断への研究開発投資の増加
- 主要市場抑制要因
- 蛍光In-Situハイブリダイゼーションイメージングシステムと手順の高コスト
- 主要市場機会
- 蛍光In-Situハイブリダイゼーションイメージングの技術進歩
- 今後の動向
- 蛍光In-Situハイブリダイゼーションイメージング技術の自動化とデジタル化
- 影響分析
第5章 蛍光In-Situハイブリダイゼーションイメージングシステム市場:アジア太平洋市場分析
- アジア太平洋の蛍光In-Situハイブリダイゼーションイメージングシステム市場収益、2022~2030年
第6章 アジア太平洋の蛍光In-Situハイブリダイゼーションイメージングシステム市場~2030年までの収益と予測:製品別
- イントロダクション
- アジア太平洋の蛍光In-Situハイブリダイゼーションイメージングシステム市場2022年・2030年売上高シェア(%):製品別
- 機器
- 消耗品
- 付属品
- ソフトウェア
第7章 アジア太平洋の蛍光In-Situハイブリダイゼーションイメージングシステム市場:収益と2030年までの予測:用途別
- イントロダクション
- アジア太平洋の蛍光In-Situハイブリダイゼーションイメージングシステム市場:2022年・2030年売上高シェア(%):用途別
- がん診断
- 遺伝子疾患診断
- 感染症診断
- その他
第8章 アジア太平洋の蛍光In-Situハイブリダイゼーションイメージングシステム市場:収益と2030年までの予測:エンドユーザー別
- イントロダクション
- アジア太平洋蛍光In-Situハイブリダイゼーションイメージングシステム市場、2022年・2030年売上高シェア(%):エンドユーザー別
- 診断ラボ
- 契約研究機関
- 製薬会社とバイオテクノロジー企業
- その他
第9章 アジア太平洋の蛍光In-Situハイブリダイゼーションイメージングシステム市場:国別分析
- 中国
- 日本
- インド
- オーストラリア
- 韓国
- その他のアジア太平洋
第10章 アジア太平洋の蛍光In-Situハイブリダイゼーションイメージングシステム市場業界情勢
- イントロダクション
- アジア太平洋の蛍光In-Situハイブリダイゼーションイメージングシステム市場における成長戦略
- 無機的成長戦略
- 有機的成長戦略
第11章 企業プロファイル
- TissueGnostics GmbH
- Agilent Technologies Inc
- Abnova Taiwan Corp
- BioGenex Laboratories Inc
- Leica Biosystems Nussloch GmbH
- MetaSystems Probes GmbH
- Bio-View Ltd
- Thermo Fisher Scientific Inc
- PerkinElmer Inc
- Euroclone SpA
第12章 付録
List Of Tables
- Table 1. Asia Pacific Fluorescence In-Situ Hybridization (FISH) Imaging Systems Market Segmentation
- Table 2. China Fluorescence In-Situ Hybridization (FISH) Imaging Systems Market, by Product- Revenue and Forecast to 2030 (US$ Million)
- Table 3. China Fluorescence In-Situ Hybridization (FISH) Imaging Systems Market, by Instruments - Revenue and Forecast to 2030 (US$ Million)
- Table 4. China Fluorescence In-Situ Hybridization (FISH) Imaging Systems Market, by Consumables - Revenue and Forecast to 2030 (US$ Million)
- Table 5. China Fluorescence In-Situ Hybridization (FISH) Imaging Systems Market, by Application - Revenue and Forecast to 2030 (US$ Million)
- Table 6. China Fluorescence In-Situ Hybridization (FISH) Imaging Systems Market, by End User - Revenue and Forecast to 2030 (US$ Million)
- Table 7. Japan Fluorescence In-Situ Hybridization (FISH) Imaging Systems Market, by Product- Revenue and Forecast to 2030 (US$ Million)
- Table 8. Japan Fluorescence In-Situ Hybridization (FISH) Imaging Systems Market, by Instruments - Revenue and Forecast to 2030 (US$ Million)
- Table 9. Japan Fluorescence In-Situ Hybridization (FISH) Imaging Systems Market, by Consumables - Revenue and Forecast to 2030 (US$ Million)
- Table 10. Japan Fluorescence In-Situ Hybridization (FISH) Imaging Systems Market, by Application - Revenue and Forecast to 2030 (US$ Million)
- Table 11. Japan Fluorescence In-Situ Hybridization (FISH) Imaging Systems Market, by End User - Revenue and Forecast to 2030 (US$ Million)
- Table 12. India Fluorescence In-Situ Hybridization (FISH) Imaging Systems Market, by Product- Revenue and Forecast to 2030 (US$ Million)
- Table 13. India Fluorescence In-Situ Hybridization (FISH) Imaging Systems Market, by Instruments - Revenue and Forecast to 2030 (US$ Million)
- Table 14. India Fluorescence In-Situ Hybridization (FISH) Imaging Systems Market, by Consumables - Revenue and Forecast to 2030 (US$ Million)
- Table 15. India Fluorescence In-Situ Hybridization (FISH) Imaging Systems Market, by Application - Revenue and Forecast to 2030 (US$ Million)
- Table 16. India Fluorescence In-Situ Hybridization (FISH) Imaging Systems Market, by End User - Revenue and Forecast to 2030 (US$ Million)
- Table 17. Australia Fluorescence In-Situ Hybridization (FISH) Imaging Systems Market, by Product- Revenue and Forecast to 2030 (US$ Million)
- Table 18. Australia Fluorescence In-Situ Hybridization (FISH) Imaging Systems Market, by Instruments - Revenue and Forecast to 2030 (US$ Million)
- Table 19. Australia Fluorescence In-Situ Hybridization (FISH) Imaging Systems Market, by Consumables - Revenue and Forecast to 2030 (US$ Million)
- Table 20. Australia Fluorescence In-Situ Hybridization (FISH) Imaging Systems Market, by Application - Revenue and Forecast to 2030 (US$ Million)
- Table 21. Australia Fluorescence In-Situ Hybridization (FISH) Imaging Systems Market, by End User - Revenue and Forecast to 2030 (US$ Million)
- Table 22. South Korea Fluorescence In-Situ Hybridization (FISH) Imaging Systems Market, by Product- Revenue and Forecast to 2030 (US$ Million)
- Table 23. South Korea Fluorescence In-Situ Hybridization (FISH) Imaging Systems Market, by Instruments - Revenue and Forecast to 2030 (US$ Million)
- Table 24. South Korea Fluorescence In-Situ Hybridization (FISH) Imaging Systems Market, by Consumables - Revenue and Forecast to 2030 (US$ Million)
- Table 25. South Korea Fluorescence In-Situ Hybridization (FISH) Imaging Systems Market, by Application - Revenue and Forecast to 2030 (US$ Million)
- Table 26. South Korea Fluorescence In-Situ Hybridization (FISH) Imaging Systems Market, by End User - Revenue and Forecast to 2030 (US$ Million)
- Table 27. Rest of Asia Pacific Fluorescence In-Situ Hybridization (FISH) Imaging Systems Market, by Product- Revenue and Forecast to 2030 (US$ Million)
- Table 28. Rest of Asia Pacific Fluorescence In-Situ Hybridization (FISH) Imaging Systems Market, by Instruments - Revenue and Forecast to 2030 (US$ Million)
- Table 29. Rest of Asia Pacific Fluorescence In-Situ Hybridization (FISH) Imaging Systems Market, by Consumables - Revenue and Forecast to 2030 (US$ Million)
- Table 30. Rest of Asia Pacific Fluorescence In-Situ Hybridization (FISH) Imaging Systems Market, by Application - Revenue and Forecast to 2030 (US$ Million)
- Table 31. Rest of Asia Pacific Fluorescence In-Situ Hybridization (FISH) Imaging Systems Market, by End User - Revenue and Forecast to 2030 (US$ Million)
- Table 32. Recent Inorganic Growth Strategies in the Asia Pacific Fluorescence In-Situ Hybridization (FISH) Imaging Systems Market
- Table 33. Recent Organic Growth Strategies in the Asia Pacific Fluorescence In-Situ Hybridization (FISH) Imaging Systems Market
- Table 34. Glossary of Terms, Asia Pacific Fluorescence In-Situ Hybridization (FISH) Imaging Systems Market
List Of Figures
- Figure 1. Asia Pacific Fluorescence In-Situ Hybridization (FISH) Imaging Systems Market Segmentation, By Country
- Figure 2. Asia Pacific Fluorescence In-Situ Hybridization (FISH) Imaging Systems Market - Key Industry Dynamics
- Figure 3. Impact Analysis of Drivers and Restraints
- Figure 4. Asia Pacific Fluorescence In-Situ Hybridization (FISH) Imaging Systems Market Revenue (US$ Mn), 2022 - 2030
- Figure 5. Asia Pacific Fluorescence In-Situ Hybridization (FISH) Imaging Systems Market Revenue Share, by Product 2022 & 2030 (%)
- Figure 6. Instruments: Asia Pacific Fluorescence In-Situ Hybridization (FISH) Imaging Systems Market - Revenue and Forecast to 2030 (US$ Million)
- Figure 7. Consumables: Asia Pacific Fluorescence In-Situ Hybridization (FISH) Imaging Systems Market - Revenue and Forecast to 2030 (US$ Million)
- Figure 8. Accessories: Asia Pacific Fluorescence In-Situ Hybridization (FISH) Imaging Systems Market - Revenue and Forecast to 2030 (US$ Million)
- Figure 9. Software: Asia Pacific Fluorescence In-Situ Hybridization (FISH) Imaging Systems Market - Revenue and Forecast to 2030 (US$ Million)
- Figure 10. Asia Pacific Fluorescence In-Situ Hybridization (FISH) Imaging Systems Market Revenue Share, by Application 2022 & 2030 (%)
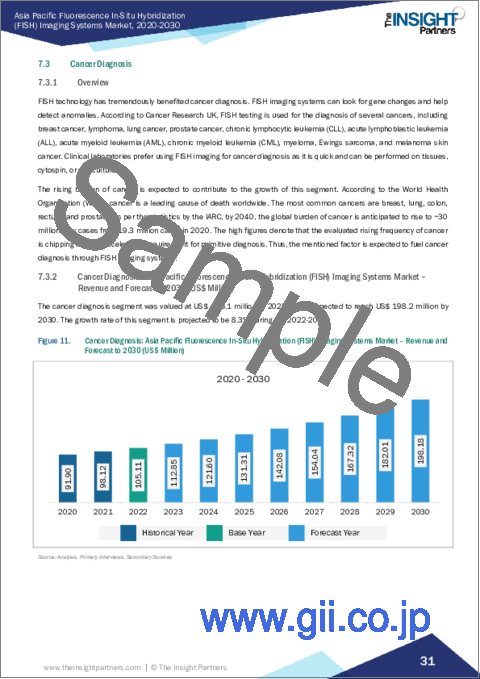
- Figure 11. Cancer Diagnosis: Asia Pacific Fluorescence In-Situ Hybridization (FISH) Imaging Systems Market - Revenue and Forecast to 2030 (US$ Million)
- Figure 12. Genetic Disease Diagnosis: Asia Pacific Fluorescence In-Situ Hybridization (FISH) Imaging Systems Market - Revenue and Forecast to 2030 (US$ Million)
- Figure 13. Infectious Disease Diagnosis: Asia Pacific Fluorescence In-Situ Hybridization (FISH) Imaging Systems Market - Revenue and Forecast to 2030 (US$ Million)
- Figure 14. Others: Asia Pacific Fluorescence In-Situ Hybridization (FISH) Imaging Systems Market - Revenue and Forecast to 2030 (US$ Million)
- Figure 15. Asia Pacific Fluorescence In-Situ Hybridization (FISH) Imaging Systems Market Revenue Share, by End User 2022 & 2030 (%)
- Figure 16. Diagnostic Laboratories: Asia Pacific Fluorescence In-Situ Hybridization (FISH) Imaging Systems Market - Revenue and Forecast to 2030 (US$ Million)
- Figure 17. Contract Research Organization: Asia Pacific Fluorescence In-Situ Hybridization (FISH) Imaging Systems Market - Revenue and Forecast to 2030 (US$ Million)
- Figure 18. Pharmaceutical and Biotechnological Companies: Asia Pacific Fluorescence In-Situ Hybridization (FISH) Imaging Systems Market - Revenue and Forecast to 2030 (US$ Million)
- Figure 19. Others: Asia Pacific Fluorescence In-Situ Hybridization (FISH) Imaging Systems Market - Revenue and Forecast to 2030 (US$ Million)
- Figure 20. Asia Pacific Fluorescence In-Situ Hybridization (FISH) Imaging Systems Market, by Key Country - Revenue (2022) (US$ Million)
- Figure 21. Asia Pacific Fluorescence In-Situ Hybridization (FISH) Imaging Systems Market, by Country, 2022 & 2030 (%)
- Figure 22. China Fluorescence In-Situ Hybridization (FISH) Imaging Systems Market - Revenue and Forecast to 2030 (US$ Million)
- Figure 23. Japan Fluorescence In-Situ Hybridization (FISH) Imaging Systems Market - Revenue and Forecast to 2030 (US$ Million)
- Figure 24. India Fluorescence In-Situ Hybridization (FISH) Imaging Systems Market - Revenue and Forecast to 2030 (US$ Million)
- Figure 25. Australia Fluorescence In-Situ Hybridization (FISH) Imaging Systems Market - Revenue and Forecast to 2030 (US$ Million)
- Figure 26. South Korea Fluorescence In-Situ Hybridization (FISH) Imaging Systems Market - Revenue and Forecast to 2030 (US$ Million)
- Figure 27. Rest of Asia Pacific Fluorescence In-Situ Hybridization (FISH) Imaging Systems Market - Revenue and Forecast to 2030 (US$ Million)
- Figure 28. Growth Strategies in the Asia Pacific Fluorescence In-Situ Hybridization (FISH) Imaging Systems Market
The Asia Pacific fluorescence in-situ hybridization (FISH) imaging systems market is expected to grow from US$ 217.6 million in 2022 to US$ 400.9 million by 2030. It is estimated to grow at a CAGR of 7.9% from 2022 to 2030.
Increasing R&D Investments in In-Vitro Diagnostics Fuel Asia Pacific Fluorescence In-Situ Hybridization (Fish) Imaging Systems Market
The Asia Pacific Fluorescence In-Situ Hybridization (FISH) Imaging Systems Market is driven by continued investments in research and development (R&D) activities related to in-vitro diagnostics (IVD). With its unique capability to visualize specific DNA sequences within cellular environments, the FISH technique has emerged as a key procedure in the modern diagnostics ecosystem, particularly in detecting genetic disorders and rare diseases. An upsurge in R&D funding in IVD has catalyzed transformative advancements in FISH imaging systems by allowing researchers to create cutting-edge platforms providing enhanced image quality with features supporting streamlined automation, culminating in more accurate and rapid diagnostic processes. PNA FISH, a novel diagnostic method that uses FISH with peptide nucleic acid (PNA) probes, combines the ease of traditional staining procedures with the exceptional performance of PNA probes to provide rapid and accurate diagnoses of contagious diseases, which makes PNA FISH suitable for routine application and enables clinical microbiology laboratories to report important information for patient therapy within a time frame that is not possible using classic biochemical methods.
Asia Pacific Fluorescence In-Situ Hybridization (Fish) Imaging Systems Market Overview
The Asia Pacific Asia Pacific Fluorescence In-Situ Hybridization (FISH) Imaging Systems Market is expected to register the highest CAGR during the forecast period. The regional market is expected to grow rapidly in the coming years due to factors such as high cancer prevalence rates in countries, government initiatives to improve the medical device industry, and robust medical device manufacturing. Delivery centers in Indonesia, India, and China typically support outsourcing services in this region. Additionally, the rising cases of genetic disorders and infectious diseases significantly expand the Asia Pacific Fluorescence In-Situ Hybridization (FISH) Imaging Systems Market growth in Asia Pacific.
Asia Pacific Fluorescence In-Situ Hybridization (Fish) Imaging Systems Market Revenue and Forecast to 2030 (US$ Million)
Asia Pacific Fluorescence In-Situ Hybridization (Fish) Imaging Systems Market Segmentation
The Asia Pacific fluorescence in-situ hybridization (FISH) imaging systems market is segmented into product, application, end users and country.
Based on product, the Asia Pacific fluorescence in-situ hybridization (FISH) imaging systems market is segmented into instruments, consumables, accessories, and software. The consumables segment held the largest share of the Asia Pacific fluorescence in-situ hybridization (FISH) imaging systems market in 2022.
In terms of application, the Asia Pacific fluorescence in-situ hybridization (FISH) imaging systems market is segmented into cancer diagnosis, genetic disease diagnosis, infectious disease diagnostic, and others. The cancer diagnosis segment held the largest share of the Asia Pacific fluorescence in-situ hybridization (FISH) imaging systems market in 2022.
Based on end user, the Asia Pacific fluorescence in-situ hybridization (FISH) imaging systems market is segmented into diagnostic laboratories, contract research organizations, pharmaceutical and biotechnological companies, and others. The diagnostic laboratories segment held the largest share of the Asia Pacific fluorescence in-situ hybridization (FISH) imaging systems market in 2022.
By country, the Asia Pacific fluorescence in-situ hybridization (FISH) imaging systems market is segmented int o China, Japan, India, South Korea, Australia, and the Rest of Asia Pacific. The China dominated the Asia Pacific fluorescence in-situ hybridization (FISH) imaging systems market in 2022.
Euroclone SpA, Tissuegnostics Gmbh, Agilent Technologies Inc, Abnova Taiwan Corp, Biogenex Laboratories Inc, Leica Biosystems Nussloch Gmbh, Metasystems Probes Gmbh, Bio-View Ltd, And Thermo Fisher Scientific Inc are some of the leading companies operating in the Asia Pacific fluorescence in-situ hybridization (FISH) imaging systems market.
Table Of Contents
1. Introduction
- 1.1 The Insight Partners Research Report Guidance
- 1.2 Market Segmentation
2. Executive Summary
- 2.1 Key Insights
3. Research Methodology
- 3.1 Coverage
- 3.2 Secondary Research
- 3.3 Primary Research
4. Asia Pacific Fluorescence In-Situ Hybridization (FISH) Imaging Systems Market - Key Industry Dynamics
- 4.1 Key Market Drivers:
- 4.1.1 Rising Prevalence of Target Disorders
- 4.1.2 Increasing R&D Investments in In-Vitro Diagnostics
- 4.2 Key Market Restraints:
- 4.2.1 High Cost of FISH Imaging Systems and Procedures
- 4.3 Key Market Opportunities:
- 4.3.1 Technological Advancements in Fluorescence in Situ Hybridization Imaging
- 4.4 Future Trends:
- 4.4.1 Automation and Digitalization of FISH Imaging Technique
- 4.5 Impact Analysis:
5. Fluorescence In-Situ Hybridization (FISH) Imaging Systems Market - Asia Pacific Market Analysis
- 5.1 Asia Pacific Fluorescence In-Situ Hybridization (FISH) Imaging Systems Market Revenue (US$ Mn), 2022 - 2030
6. Asia Pacific Fluorescence In-Situ Hybridization (FISH) Imaging Systems Market - Revenue and Forecast to 2030 - by Product
- 6.1 Overview
- 6.2 Asia Pacific Fluorescence In-Situ Hybridization (FISH) Imaging Systems Market Revenue Share, by Product 2022 & 2030 (%)
- 6.3 Instruments
- 6.3.1 Overview
- 6.3.2 Instruments: Asia Pacific Fluorescence In-Situ Hybridization (FISH) Imaging Systems Market - Revenue and Forecast to 2030 (US$ Million)
- 6.3.2.1 Instruments: Asia Pacific Fluorescence In-Situ Hybridization (FISH) Imaging Systems Market - Revenue and Forecast to 2030 (US$ Million)
- 6.4 Consumables
- 6.4.1 Overview
- 6.4.2 Consumables: Asia Pacific Fluorescence In-Situ Hybridization (FISH) Imaging Systems Market - Revenue and Forecast to 2030 (US$ Million)
- 6.4.2.1 Consumables: Asia Pacific Fluorescence In-Situ Hybridization (FISH) Imaging Systems Market - Revenue and Forecast to 2030 (US$ Million)
- 6.5 Accessories
- 6.5.1 Overview
- 6.5.2 Accessories: Asia Pacific Fluorescence In-Situ Hybridization (FISH) Imaging Systems Market - Revenue and Forecast to 2030 (US$ Million)
- 6.6 Software
- 6.6.1 Overview
- 6.6.2 Software: Asia Pacific Fluorescence In-Situ Hybridization (FISH) Imaging Systems Market - Revenue and Forecast to 2030 (US$ Million)
7. Asia Pacific Fluorescence In-Situ Hybridization (FISH) Imaging Systems Market - Revenue and Forecast to 2030 - by Application
- 7.1 Overview
- 7.2 Asia Pacific Fluorescence In-Situ Hybridization (FISH) Imaging Systems Market Revenue Share, by Application 2022 & 2030 (%)
- 7.3 Cancer Diagnosis
- 7.3.1 Overview
- 7.3.2 Cancer Diagnosis: Asia Pacific Fluorescence In-Situ Hybridization (FISH) Imaging Systems Market - Revenue and Forecast to 2030 (US$ Million)
- 7.4 Genetic Disease Diagnosis
- 7.4.1 Overview
- 7.4.2 Genetic Disease Diagnosis: Asia Pacific Fluorescence In-Situ Hybridization (FISH) Imaging Systems Market - Revenue and Forecast to 2030 (US$ Million)
- 7.5 Infectious Disease Diagnosis
- 7.5.1 Overview
- 7.5.2 Infectious Disease Diagnosis: Asia Pacific Fluorescence In-Situ Hybridization (FISH) Imaging Systems Market - Revenue and Forecast to 2030 (US$ Million)
- 7.6 Others
- 7.6.1 Overview
- 7.6.2 Others: Asia Pacific Fluorescence In-Situ Hybridization (FISH) Imaging Systems Market - Revenue and Forecast to 2030 (US$ Million)
8. Asia Pacific Fluorescence In-Situ Hybridization (FISH) Imaging Systems Market - Revenue and Forecast to 2030 - by End User
- 8.1 Overview
- 8.2 Asia Pacific Fluorescence In-Situ Hybridization (FISH) Imaging Systems Market Revenue Share, by End User 2022 & 2030 (%)
- 8.3 Diagnostic Laboratories
- 8.3.1 Overview
- 8.3.2 Diagnostic Laboratories: Asia Pacific Fluorescence In-Situ Hybridization (FISH) Imaging Systems Market - Revenue and Forecast to 2030 (US$ Million)
- 8.4 Contract Research Organization
- 8.4.1 Overview
- 8.4.2 Contract Research Organization: Asia Pacific Fluorescence In-Situ Hybridization (FISH) Imaging Systems Market - Revenue and Forecast to 2030 (US$ Million)
- 8.5 Pharmaceutical and Biotechnological Companies
- 8.5.1 Overview
- 8.5.2 Pharmaceutical and Biotechnological Companies: Asia Pacific Fluorescence In-Situ Hybridization (FISH) Imaging Systems Market - Revenue and Forecast to 2030 (US$ Million)
- 8.6 Others
- 8.6.1 Overview
- 8.6.2 Others: Asia Pacific Fluorescence In-Situ Hybridization (FISH) Imaging Systems Market - Revenue and Forecast to 2030 (US$ Million)
9. Asia Pacific Fluorescence In-Situ Hybridization (FISH) Imaging Systems Market - Country Analysis
- 9.1 Asia Pacific Fluorescence In-Situ Hybridization (FISH) Imaging Systems Market
- 9.1.1 Overview
- 9.1.2 Asia Pacific Fluorescence In-Situ Hybridization (FISH) Imaging Systems Market, by Country, 2022 & 2030 (%)
- 9.1.2.1 China Fluorescence In-Situ Hybridization (FISH) Imaging Systems Market - Revenue and Forecast to 2030 (US$ Million)
- 9.1.2.1.1 Overview
- 9.1.2.1.2 China Fluorescence In-Situ Hybridization (FISH) Imaging Systems Market - Revenue and Forecast to 2030 (US$ Million)
- 9.1.2.1.3 China Fluorescence In-Situ Hybridization (FISH) Imaging Systems Market, by Product, 2020-2030 (US$ Million)
- 9.1.2.1.3.1 China Fluorescence In-Situ Hybridization (FISH) Imaging Systems Market, by Instruments, 2020-2030 (US$ Million)
- 9.1.2.1.3.2 China Fluorescence In-Situ Hybridization (FISH) Imaging Systems Market, by Consumables, 2020-2030 (US$ Million)
- 9.1.2.1.4 China Fluorescence In-Situ Hybridization (FISH) Imaging Systems Market, by Application, 2020-2030 (US$ Million)
- 9.1.2.1.5 China Fluorescence In-Situ Hybridization (FISH) Imaging Systems Market, by End User, 2020-2030 (US$ Million)
- 9.1.2.2 Japan Fluorescence In-Situ Hybridization (FISH) Imaging Systems Market - Revenue and Forecast to 2030 (US$ Million)
- 9.1.2.2.1 Overview
- 9.1.2.2.2 Japan Fluorescence In-Situ Hybridization (FISH) Imaging Systems Market - Revenue and Forecast to 2030 (US$ Million)
- 9.1.2.2.3 Japan Fluorescence In-Situ Hybridization (FISH) Imaging Systems Market, by Product, 2020-2030 (US$ Million)
- 9.1.2.2.3.1 Japan Fluorescence In-Situ Hybridization (FISH) Imaging Systems Market, by Instruments, 2020-2030 (US$ Million)
- 9.1.2.2.3.2 Japan Fluorescence In-Situ Hybridization (FISH) Imaging Systems Market, by Consumables, 2020-2030 (US$ Million)
- 9.1.2.2.4 Japan Fluorescence In-Situ Hybridization (FISH) Imaging Systems Market, by Application, 2020-2030 (US$ Million)
- 9.1.2.2.5 Japan Fluorescence In-Situ Hybridization (FISH) Imaging Systems Market, by End User, 2020-2030 (US$ Million)
- 9.1.2.3 India Fluorescence In-Situ Hybridization (FISH) Imaging Systems Market - Revenue and Forecast to 2030 (US$ Million)
- 9.1.2.3.1 Overview
- 9.1.2.3.2 India Fluorescence In-Situ Hybridization (FISH) Imaging Systems Market - Revenue and Forecast to 2030 (US$ Million)
- 9.1.2.3.3 India Fluorescence In-Situ Hybridization (FISH) Imaging Systems Market, by Product, 2020-2030 (US$ Million)
- 9.1.2.3.3.1 India Fluorescence In-Situ Hybridization (FISH) Imaging Systems Market, by Instruments, 2020-2030 (US$ Million)
- 9.1.2.3.3.2 India Fluorescence In-Situ Hybridization (FISH) Imaging Systems Market, by Consumables, 2020-2030 (US$ Million)
- 9.1.2.3.4 India Fluorescence In-Situ Hybridization (FISH) Imaging Systems Market, by Application, 2020-2030 (US$ Million)
- 9.1.2.3.5 India Fluorescence In-Situ Hybridization (FISH) Imaging Systems Market, by End User, 2020-2030 (US$ Million)
- 9.1.2.4 Australia Fluorescence In-Situ Hybridization (FISH) Imaging Systems Market - Revenue and Forecast to 2030 (US$ Million)
- 9.1.2.4.1 Overview
- 9.1.2.4.2 Australia Fluorescence In-Situ Hybridization (FISH) Imaging Systems Market - Revenue and Forecast to 2030 (US$ Million)
- 9.1.2.4.3 Australia Fluorescence In-Situ Hybridization (FISH) Imaging Systems Market, by Product, 2020-2030 (US$ Million)
- 9.1.2.4.3.1 Australia Fluorescence In-Situ Hybridization (FISH) Imaging Systems Market, by Instruments, 2020-2030 (US$ Million)
- 9.1.2.4.3.2 Australia Fluorescence In-Situ Hybridization (FISH) Imaging Systems Market, by Consumables, 2020-2030 (US$ Million)
- 9.1.2.4.4 Australia Fluorescence In-Situ Hybridization (FISH) Imaging Systems Market, by Application, 2020-2030 (US$ Million)
- 9.1.2.4.5 Australia Fluorescence In-Situ Hybridization (FISH) Imaging Systems Market, by End User, 2020-2030 (US$ Million)
- 9.1.2.5 South Korea Fluorescence In-Situ Hybridization (FISH) Imaging Systems Market - Revenue and Forecast to 2030 (US$ Million)
- 9.1.2.5.1 Overview
- 9.1.2.5.2 South Korea Fluorescence In-Situ Hybridization (FISH) Imaging Systems Market - Revenue and Forecast to 2030 (US$ Million)
- 9.1.2.5.3 South Korea Fluorescence In-Situ Hybridization (FISH) Imaging Systems Market, by Product, 2020-2030 (US$ Million)
- 9.1.2.5.3.1 South Korea Fluorescence In-Situ Hybridization (FISH) Imaging Systems Market, by Instruments, 2020-2030 (US$ Million)
- 9.1.2.5.3.2 South Korea Fluorescence In-Situ Hybridization (FISH) Imaging Systems Market, by Consumables, 2020-2030 (US$ Million)
- 9.1.2.5.4 South Korea Fluorescence In-Situ Hybridization (FISH) Imaging Systems Market, by Application, 2020-2030 (US$ Million)
- 9.1.2.5.5 South Korea Fluorescence In-Situ Hybridization (FISH) Imaging Systems Market, by End User, 2020-2030 (US$ Million)
- 9.1.2.6 Rest of Asia Pacific Fluorescence In-Situ Hybridization (FISH) Imaging Systems Market - Revenue and Forecast to 2030 (US$ Million)
- 9.1.2.6.1 Overview
- 9.1.2.6.2 Rest of Asia Pacific Fluorescence In-Situ Hybridization (FISH) Imaging Systems Market - Revenue and Forecast to 2030 (US$ Million)
- 9.1.2.6.3 Rest of Asia Pacific Fluorescence In-Situ Hybridization (FISH) Imaging Systems Market, by Product, 2020-2030 (US$ Million)
- 9.1.2.6.3.1 Rest of Asia Pacific Fluorescence In-Situ Hybridization (FISH) Imaging Systems Market, by Instruments, 2020-2030 (US$ Million)
- 9.1.2.6.3.2 Rest of Asia Pacific Fluorescence In-Situ Hybridization (FISH) Imaging Systems Market, by Consumables, 2020-2030 (US$ Million)
- 9.1.2.6.4 Rest of Asia Pacific Fluorescence In-Situ Hybridization (FISH) Imaging Systems Market, by Application, 2020-2030 (US$ Million)
- 9.1.2.6.5 Rest of Asia Pacific Fluorescence In-Situ Hybridization (FISH) Imaging Systems Market, by End User, 2020-2030 (US$ Million)
- 9.1.2.1 China Fluorescence In-Situ Hybridization (FISH) Imaging Systems Market - Revenue and Forecast to 2030 (US$ Million)
10. Asia Pacific Fluorescence In-Situ Hybridization (FISH) Imaging Systems Market Industry Landscape
- 10.1 Overview
- 10.2 Growth Strategies in the Asia Pacific Fluorescence In-Situ Hybridization (FISH) Imaging Systems Market
- 10.3 Inorganic Growth Strategies
- 10.3.1 Overview
- 10.4 Organic Growth Strategies
- 10.4.1 Overview
11. Company Profiles
- 11.1 TissueGnostics GmbH
- 11.1.1 Key Facts
- 11.1.2 Business Description
- 11.1.3 Products and Services
- 11.1.4 Financial Overview
- 11.1.5 SWOT Analysis
- 11.1.6 Key Developments
- 11.2 Agilent Technologies Inc
- 11.2.1 Key Facts
- 11.2.2 Business Description
- 11.2.3 Products and Services
- 11.2.4 Financial Overview
- 11.2.5 SWOT Analysis
- 11.2.6 Key Developments
- 11.3 Abnova Taiwan Corp
- 11.3.1 Key Facts
- 11.3.2 Business Description
- 11.3.3 Products and Services
- 11.3.4 Financial Overview
- 11.3.5 SWOT Analysis
- 11.3.6 Key Developments
- 11.4 BioGenex Laboratories Inc
- 11.4.1 Key Facts
- 11.4.2 Business Description
- 11.4.3 Products and Services
- 11.4.4 Financial Overview
- 11.4.5 SWOT Analysis
- 11.4.6 Key Developments
- 11.5 Leica Biosystems Nussloch GmbH
- 11.5.1 Key Facts
- 11.5.2 Business Description
- 11.5.3 Products and Services
- 11.5.4 Financial Overview
- 11.5.5 SWOT Analysis
- 11.5.6 Key Developments
- 11.6 MetaSystems Probes GmbH
- 11.6.1 Key Facts
- 11.6.2 Business Description
- 11.6.3 Products and Services
- 11.6.4 Financial Overview
- 11.6.5 SWOT Analysis
- 11.6.6 Key Developments
- 11.7 Bio-View Ltd
- 11.7.1 Key Facts
- 11.7.2 Business Description
- 11.7.3 Products and Services
- 11.7.4 Financial Overview
- 11.7.5 SWOT Analysis
- 11.7.6 Key Developments
- 11.8 Thermo Fisher Scientific Inc
- 11.8.1 Key Facts
- 11.8.2 Business Description
- 11.8.3 Products and Services
- 11.8.4 Financial Overview
- 11.8.5 SWOT Analysis
- 11.8.6 Key Developments
- 11.9 PerkinElmer Inc
- 11.9.1 Key Facts
- 11.9.2 Business Description
- 11.9.3 Products and Services
- 11.9.4 Financial Overview
- 11.9.5 SWOT Analysis
- 11.9.6 Key Developments
- 11.10 Euroclone SpA
- 11.10.1 Key Facts
- 11.10.2 Business Description
- 11.10.3 Products and Services
- 11.10.4 Financial Overview
- 11.10.5 SWOT Analysis
- 11.10.6 Key Developments
12. Appendix
- 12.1 About Us
- 12.2 Glossary of Terms
