|
|
市場調査レポート
商品コード
1226873
アジア太平洋地域の3Dアバターソリューション市場の2028年までの予測- 地域別分析- コンポーネント、モデル、エンドユーザー別Asia Pacific 3D Avatar Solution Market Forecast to 2028 - COVID-19 Impact and Regional Analysis - by Component (Solution and Services), Model (Stylized, Realistic, and Futuristic), and End User (Media and Entertainment, Healthcare, Fashion, and Others) |
||||||
|
|
|||||||


| アジア太平洋地域の3Dアバターソリューション市場の2028年までの予測- 地域別分析- コンポーネント、モデル、エンドユーザー別 |
|
出版日: 2023年02月13日
発行: The Insight Partners
ページ情報: 英文 91 Pages
納期: 即納可能
|
- 全表示
- 概要
- 図表
- 目次
アジア太平洋地域の3Dアバターソリューション市場は、2022年の2,546万米ドルから2028年には1億4,206万米ドルに成長すると予測されます。2022年から2028年までのCAGRは33.2%と推定されています。
ゲーム業界における3Dアバターの統合がアジア太平洋地域の3Dアバターソリューション市場を牽引する
スマートフォンの急速な普及とインターネットの高い普及率に伴い、ゲーム産業は過去10年間にこの地域全体で大きな成長を遂げました。世界銀行が発表したデータによると、人口の40%以上がさまざまなビデオゲームに興じています。ビデオゲームに携わる人々の増加により、ゲーム開発会社はインタラクティブなゲームを開発するために、AR、VR、メタバース、NFT、ブロックチェーンなどの先進技術に投資するよう影響を受けています。多くのゲーム開発会社は、プレイヤーにリアルで未来的なゲーム体験を提供するために、これらの技術を採用しています。例えば、2022年には、No Man's Sky、God of War、Horizon Forbidden Westなどのゲームが発売されました。さらに、FIFA、PUBG、Fortniteなどのマルチプレーヤーゲームの採用が人口の間で拡大しています。また、ゲーム業界は様々なファッションブランドとコラボレーションし、製品を紹介しています。ゲームプラットフォームでは、プレイヤーは自分のアバターを作り、ファッションショップから服を購入して、カスタマイズした外見を作ることができます。例えば、2021年9月、バレンシアガはゲームプラットフォーム「フォートナイト」上に仮想店舗を開設し、プレイヤーにアバターのカスタマイズされた外観を提供しており、ファッション愛好家である新規プレイヤーを引き付けています。したがって、人口の間で技術的に高度なゲームの導入が進んでいることが、ゲーム業界における3Dアバターソリューションの需要を高めており、これが予測期間中のアジア太平洋地域の3Dアバターソリューション市場の成長を促進すると予想されます。
アジア太平洋地域の3Dアバターソリューション市場の概要
アジア太平洋地域の3Dアバターソリューション市場は、オーストラリア、中国、インド、日本、韓国、その他アジア太平洋地域に区分されます。調査によると、この地域は30億人以上のゲーマーで構成されています。この地域では、プロチームによるROG Masters Asia Pacificのようなゲームトーナメントの導入が増加しています。さらに、インターネットの普及、スマートフォンの普及、若年人口の増加が、同地域でのビデオゲームの普及を促進しています。そのため、PCおよびモバイルゲーム開発会社は、この地域で大きな市場機会を得ています。彼らは、プレイヤーにリアルなゲーム体験を提供するために、先進的な技術を導入しています。このように、上記の要因がゲーム業界における3Dアバターの需要を押し上げ、アジア太平洋地域の3Dアバターソリューション市場の成長に寄与しているのです。
アジア太平洋地域の3Dアバターソリューション市場の収益と2028年までの予測(US$Million)
アジア太平洋地域の3Dアバターソリューション市場のセグメント化
アジア太平洋地域の3Dアバターソリューション市場は、コンポーネント、モデル、エンドユーザー、国によって区分されます。
コンポーネントに基づき、アジア太平洋地域の3Dアバターソリューション市場は、ソリューションとサービスに二分されます。2022年の市場シェアは、ソリューションセグメントがより大きなシェアを占めています。
モデルに基づき、アジア太平洋地域の3Dアバターソリューション市場は、スタイライズド、リアリスティック、フューチャリスティックに分類されます。2022年には、スタイライズドセグメントが最も大きな市場シェアを占めています。
エンドユーザー別に見ると、アジア太平洋地域の3Dアバターソリューション市場は、メディア・エンターテインメント、ヘルスケア、ファッション、その他に分類されます。ファッション分野は2022年に最大の市場シェアを占めました。
国別では、アジア太平洋地域の3Dアバターソリューション市場は、中国、インド、日本、韓国、オーストラリア、その他アジア太平洋地域に分類されます。地域別分析では、2022年の市場シェアは中国が独占しています。
Bodygee AG、Osensus GmbH、Polyga Inc、Texel Inc LLC、TG3D Studio Incは、アジア太平洋地域の3Dアバターソリューション市場で事業を展開している主要企業です。
目次
第1章 イントロダクション
第2章 重要なポイント
第3章 調査手法
- カバレッジ
- 2次調査
- 1次調査
第4章 アジア太平洋地域の3Dアバターソリューション市場情勢
- 市場概要
- アジア太平洋地域のPEST分析
- エコシステム分析
- 専門家の見解
第5章 アジア太平洋地域の3Dアバターソリューション市場- 主な市場力学
- 市場促進要因
- ファッション業界におけるメタバースや3Dアバターなどの先端技術の採用
- 新しい3Dアバターソリューションの開発台数増加
- 市場抑制要因
- 実店舗での買い物を好む傾向の強まり
- 市場機会
- ヘルスケア業界における3Dアバター技術の採用
- 今後の動向
- ゲーム業界における3Dアバターの統合
- 促進要因と抑制要因の影響分析
第6章 3Dアバターソリューション市場- アジア太平洋地域分析
- アジア太平洋地域の3Dアバターソリューション市場の概要
- アジア太平洋地域の3Dアバターソリューション市場の収益と予測・分析
第7章 アジア太平洋地域の3Dアバターソリューション市場分析:コンポーネント別
- アジア太平洋地域の3Dアバターソリューション市場:コンポーネント別(2021年・2028年)
- ソリューション
- サービス
第8章 アジア太平洋地域の3Dアバターソリューションの市場分析:モデル別
- アジア太平洋地域の3Dアバターソリューション市場:モデル別(2021年・2028年)
- スタイライズド
- リアリスティック
- フューチャリスティック
第9章 アジア太平洋地域の3Dアバターソリューションの市場分析:エンドユーザー別
- アジア太平洋地域の3Dアバターソリューション市場:エンドユーザー別(2021年・2028年)
- メディア・エンターテインメント
- ヘルスケア
- ファッション
- その他
第10章 アジア太平洋地域の3Dアバターソリューション市場:国別分析
- アジア太平洋地域
- オーストラリア
- 中国
- インド
- 日本
- 韓国
- その他アジア太平洋地域
第11章 業界情勢
- 市場の取り組み
- 新製品開発
第12章 企業プロファイル
- Texel Inc LLC
- Osensus GmbH
- Bodygee AG
- Polyga Inc
- TG3D Studio Inc
第13章 付録
List Of Tables
- Table 1. Asia Pacific 3D Avatar Solution Market Revenue and Forecast to 2028 (US$ Million)
- Table 2. Australia: 3D Avatar Solution Market, By Component - Revenue and Forecast to 2028 (US$ Million)
- Table 3. Australia: 3D Avatar Solution Market, by Model - Revenue and Forecast to 2028 (US$ Million)
- Table 4. Australia: 3D Avatar Solution Market, by End User - Revenue and Forecast to 2028 (US$ Million)
- Table 5. China: 3D Avatar Solution Market, By Component - Revenue and Forecast to 2028 (US$ Million)
- Table 6. China: 3D Avatar Solution Market, by Model - Revenue and Forecast to 2028 (US$ Million)
- Table 7. China: 3D Avatar Solution Market, by End User - Revenue and Forecast to 2028 (US$ Million)
- Table 8. India: 3D Avatar Solution Market, By Component - Revenue and Forecast to 2028 (US$ Million)
- Table 9. India: 3D Avatar Solution Market, by Model - Revenue and Forecast to 2028 (US$ Million)
- Table 10. India: 3D Avatar Solution Market, by End User - Revenue and Forecast to 2028 (US$ Million)
- Table 11. Japan: 3D Avatar Solution Market, By Component - Revenue and Forecast to 2028 (US$ Million)
- Table 12. Japan: 3D Avatar Solution Market, by Model - Revenue and Forecast to 2028 (US$ Million)
- Table 13. Japan: 3D Avatar Solution Market, by End User - Revenue and Forecast to 2028 (US$ Million)
- Table 14. South Korea: 3D Avatar Solution Market, By Component - Revenue and Forecast to 2028 (US$ Million)
- Table 15. South Korea: 3D Avatar Solution Market, by Model - Revenue and Forecast to 2028 (US$ Million)
- Table 16. South Korea: 3D Avatar Solution Market, by End User - Revenue and Forecast to 2028 (US$ Million)
- Table 17. Rest of Asia Pacific: 3D Avatar Solution Market, By Component - Revenue and Forecast to 2028 (US$ Million)
- Table 18. Rest of Asia Pacific: 3D Avatar Solution Market, by Model - Revenue and Forecast to 2028 (US$ Million)
- Table 19. Rest of Asia Pacific: 3D Avatar Solution Market, by End User - Revenue and Forecast to 2028 (US$ Million)
- Table 20. List of Abbreviation
List Of Figures
- Figure 1. Asia Pacific 3D Avatar Solution Market Segmentation
- Figure 2. Asia Pacific 3D Avatar Solution Market Segmentation - By Country
- Figure 3. Asia Pacific 3D Avatar Solution Market Overview
- Figure 4. Asia Pacific 3D Avatar Solution Market, by Component
- Figure 5. Asia Pacific 3D Avatar Solution Market, by Country
- Figure 6. Asia Pacific - PEST Analysis
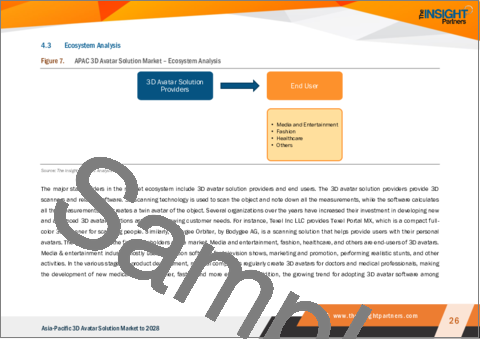
- Figure 7. Asia Pacific 3D Avatar Solution Market - Ecosystem Analysis
- Figure 8. Asia Pacific 3D Avatar Solution Market: Impact Analysis of Drivers and Restraints
- Figure 9. Asia Pacific 3D Avatar Solution Market Revenue Forecast and Analysis (US$ Million)
- Figure 10. Asia Pacific 3D Avatar Solution Market, By Component (2021 & 2028)
- Figure 11. Solution: Asia Pacific 3D Avatar Solution Market Revenue and Forecast to 2028 (US$ Million)
- Figure 12. Services: Asia Pacific 3D Avatar Solution Market Revenue and Forecast to 2028 (US$ Million)
- Figure 13. Asia Pacific 3D Avatar Solution Market, By Model (2021 & 2028)
- Figure 14. Stylized: Asia Pacific 3D Avatar Solution Market Revenue and Forecast to 2028 (US$ Million)
- Figure 15. Realistic: Asia Pacific 3D Avatar Solution Market Revenue and Forecast to 2028 (US$ Million)
- Figure 16. Futuristic: Asia Pacific 3D Avatar Solution Market Revenue and Forecast to 2028 (US$ Million)
- Figure 17. Asia Pacific 3D Avatar Solution Market, By End User (2021 & 2028)
- Figure 18. Media and Entertainment: Asia Pacific 3D Avatar Solution Market Revenue and Forecast to 2028 (US$ Million)
- Figure 19. Healthcare: Asia Pacific 3D Avatar Solution Market Revenue and Forecast to 2028 (US$ Million)
- Figure 20. Fashion: Asia Pacific 3D Avatar Solution Market Revenue and Forecast to 2028 (US$ Million)
- Figure 21. Others: Asia Pacific 3D Avatar Solution Market Revenue and Forecast to 2028 (US$ Million)
- Figure 22. Asia Pacific: 3D Avatar Solution Market, by Key Country - Revenue (2021) (US$ 'Million)
- Figure 23. Asia Pacific: 3D Avatar Solution Market Revenue Share, by Key Country (2021 & 2028)
- Figure 24. Australia: 3D Avatar Solution Market - Revenue and Forecast to 2028 (US$ Million)
- Figure 25. China: 3D Avatar Solution Market - Revenue and Forecast to 2028 (US$ Million)
- Figure 26. India: 3D Avatar Solution Market - Revenue and Forecast to 2028 (US$ Million)
- Figure 27. Japan: 3D Avatar Solution Market - Revenue and Forecast to 2028 (US$ Million)
- Figure 28. South Korea: 3D Avatar Solution Market - Revenue and Forecast to 2028 (US$ Million)
- Figure 29. Rest of Asia Pacific: 3D Avatar Solution Market - Revenue and Forecast to 2028 (US$ Million)
The Asia Pacific 3D avatar solution market is expected to grow from US$ 25.46 million in 2022 to US$ 142.06 million by 2028. It is estimated to grow at a CAGR of 33.2% from 2022 to 2028.
Integration of 3D Avatars in Gaming Industry is Driving Asia Pacific 3D Avatar Solution Market
With the rapid adoption of smartphones and high internet penetration, the gaming industry has experienced significant growth across the region over the last decade. According to data published by the World Bank, more than 40% of the population is engaged in playing various video games. The rising number of people involved in playing video games is influencing game developers to invest in advanced technologies such as AR, VR, metaverse, NFTs, and blockchain for developing interactive games. Many game-developing companies are adopting these technologies to offer players a realistic and futuristic gaming experience. For instance, 2022 experienced the launch of games such as No Man's Sky, God of War, and Horizon Forbidden West. Further, the adoption of multi-player games such as FIFA, PUBG, and Fortnite has been growing among the population. The gaming industry is also collaborating with various fashion brands to showcase its products. The gaming platforms enable the players to build their own avatars and buy clothes from fashion stores for a customized appearance. For instance, in September 2021, Balenciaga launched its virtual store on Fortnite, the gaming platform, to offer players a customized look for their avatars, which is attracting new players who are fashion enthusiasts. Therefore, the rising adoption of technologically advanced games among the population is increasing the demand for 3D avatar solutions in the gaming industry, which is expected to fuel the growth of the Asia Pacific 3D avatar solution market over the forecast period.
Asia Pacific 3D Avatar Solution Market Overview
The Asia Pacific 3D avatar solution market is segmented into Australia, China, India, Japan, South Korea, and rest of Asia Pacific. According to the research study, the region consists of more than 3 billion gamers. The region has experienced a rise in the adoption of gaming tournaments such as ROG Masters Asia Pacific between professional teams. Moreover, the increasing penetration of the internet, the rising adoption of smartphones, and the growing young population are driving the adoption of video games across the region. Hence, PC and mobile game developers are experiencing a huge market opportunity across the region. They are adopting advanced technologies to offer a realistic gaming experience to the players. Thus, the above-mentioned factors are boosting the demand for 3D avatars across the gaming industry, thereby contributing to the Asia Pacific 3D avatar solution market growth.
Asia Pacific 3D Avatar Solution Market Revenue and Forecast to 2028 (US$ Million)
Asia Pacific 3D Avatar Solution Market Segmentation
The Asia Pacific 3D avatar solution market is segmented based on component, model, end user, and country.
Based on component, the Asia Pacific 3D avatar solution market is bifurcated into solution and services. The solution segment held a larger market share in 2022.
Based on model, the Asia Pacific 3D avatar solution market is segmented into stylized, realistic, and futuristic. The stylized segment held the largest market share in 2022.
Based on end user, the Asia Pacific 3D avatar solution market is segmented into media and entertainment, healthcare, fashion, and others. The fashion segment held the largest market share in 2022.
Based on country, the Asia Pacific 3D avatar solution market has been categorized into China, India, Japan, South Korea, Australia, and rest of Asia Pacific. Our regional analysis states that China dominated the market share in 2022.
Bodygee AG, Osensus GmbH, Polyga Inc, Texel Inc LLC, and TG3D Studio Inc are the leading companies operating in the Asia Pacific 3D avatar solution market.
Reasons to Buy:
- Save and reduce time carrying out entry-level research by identifying the growth, size, leading players, and segments in the Asia Pacific 3D avatar solution market.
- Highlights key business priorities in order to assist companies to realign their business strategies
- The key findings and recommendations highlight crucial progressive industry trends in the Asia Pacific 3D avatar solution market, thereby allowing players across the value chain to develop effective long-term strategies
- Develop/modify business expansion plans by using substantial growth offering developed and emerging markets
- Scrutinize in-depth Asia Pacific market trends and outlook coupled with the factors driving the 3D avatar solution market, as well as those hindering it
- Enhance the decision-making process by understanding the strategies that underpin commercial interest with respect to client products, segmentation, pricing, and distribution
Table Of Contents
1. Introduction
- 1.1 Study Scope
- 1.2 The Insight Partners Research Report Guidance
- 1.3 Market Segmentation
2. Key Takeaways
3. Research Methodology
- 3.1 Coverage
- 3.2 Secondary Research
- 3.3 Primary Research
4. Asia Pacific 3D Avatar Solution Market Landscape
- 4.1 Market Overview
- 4.2 Asia Pacific PEST Analysis
- 4.3 Ecosystem Analysis
- 4.4 Expert Opinions
5. Asia Pacific 3D Avatar Solution Market - Key Market Dynamics
- 5.1 Market Drivers
- 5.1.1 Adoption of Advanced Technology like Metaverse and 3D Avatar in Fashion Industry
- 5.1.2 Rise in Development of New 3D Avatar Solutions
- 5.2 Market Restraints
- 5.2.1 High Preference of Shopping from of Brick and Mortar Stores
- 5.3 Market Opportunities
- 5.3.1 Adoption of 3D Avatar Technology by Healthcare Industry
- 5.4 Future Trends
- 5.4.1 Integration of 3D Avatars in Gaming Industry
- 5.5 Impact Analysis of Drivers and Restraints
6. 3D Avatar Solution Market - Asia Pacific Analysis
- 6.1 Asia Pacific 3D Avatar Solution Market Overview
- 6.2 Asia Pacific 3D Avatar Solution Market Revenue Forecast and Analysis
7. Asia Pacific 3D Avatar Solution Market Analysis - By Component
- 7.1 Overview
- 7.2 Asia Pacific 3D Avatar Solution Market, By Component (2021 & 2028)
- 7.3 Solution
- 7.3.1 Overview
- 7.3.2 Solution: 3D Avatar Solution Market Revenue and Forecast to 2028 (US$ Million)
- 7.4 Services
- 7.4.1 Overview
- 7.4.2 Services: 3D Avatar Solution Market Revenue and Forecast to 2028 (US$ Million)
8. Asia Pacific 3D Avatar Solution Market Analysis - By Model
- 8.1 Overview
- 8.2 Asia Pacific 3D Avatar Solution Market, By Model (2021 & 2028)
- 8.3 Stylized
- 8.3.1 Overview
- 8.3.2 Stylized: 3D Avatar Solution Market Revenue and Forecast to 2028 (US$ Million)
- 8.4 Realistic
- 8.4.1 Overview
- 8.4.2 Realistic: 3D Avatar Solution Market Revenue and Forecast to 2028 (US$ Million)
- 8.5 Futuristic
- 8.5.1 Overview
- 8.5.2 Futuristic: 3D Avatar Solution Market Revenue and Forecast to 2028 (US$ Million)
9. Asia Pacific 3D Avatar Solution Market Analysis - By End User
- 9.1 Overview
- 9.2 Asia Pacific 3D Avatar Solution Market, By End User (2021 & 2028)
- 9.3 Media and Entertainment
- 9.3.1 Overview
- 9.3.2 Media and Entertainment: 3D Avatar Solution Market Revenue and Forecast to 2028 (US$ Million)
- 9.4 Healthcare
- 9.4.1 Overview
- 9.4.2 Healthcare: 3D Avatar Solution Market Revenue and Forecast to 2028 (US$ Million)
- 9.5 Fashion
- 9.5.1 Overview
- 9.5.2 Fashion: 3D Avatar Solution Market Revenue and Forecast to 2028 (US$ Million)
- 9.6 Others
- 9.6.1 Overview
- 9.6.2 Others: 3D Avatar Solution Market Revenue and Forecast to 2028 (US$ Million)
10. Asia Pacific 3D Avatar Solution Market - Country Analysis
- 10.1 Overview
- 10.1.1 Asia Pacific: 3D Avatar Solution Market, by Key Country
- 10.1.1.1 Australia: 3D Avatar Solution Market - Revenue and Forecast to 2028 (US$ Million)
- 10.1.1.1.1 Australia: 3D Avatar Solution Market, By Component
- 10.1.1.1.2 Australia: 3D Avatar Solution Market, by Model
- 10.1.1.1.3 Australia: 3D Avatar Solution Market, by End User
- 10.1.1.2 China: 3D Avatar Solution Market - Revenue and Forecast to 2028 (US$ Million)
- 10.1.1.2.1 China: 3D Avatar Solution Market, By Component
- 10.1.1.2.2 China: 3D Avatar Solution Market, by Model
- 10.1.1.2.3 China: 3D Avatar Solution Market, by End User
- 10.1.1.3 India: 3D Avatar Solution Market - Revenue and Forecast to 2028 (US$ Million)
- 10.1.1.3.1 India: 3D Avatar Solution Market, By Component
- 10.1.1.3.2 India: 3D Avatar Solution Market, by Model
- 10.1.1.3.3 India: 3D Avatar Solution Market, by End User
- 10.1.1.4 Japan: 3D Avatar Solution Market - Revenue and Forecast to 2028 (US$ Million)
- 10.1.1.4.1 Japan: 3D Avatar Solution Market, By Component
- 10.1.1.4.2 Japan: 3D Avatar Solution Market, by Model
- 10.1.1.4.3 Japan: 3D Avatar Solution Market, by End User
- 10.1.1.5 South Korea: 3D Avatar Solution Market - Revenue and Forecast to 2028 (US$ Million)
- 10.1.1.5.1 South Korea: 3D Avatar Solution Market, By Component
- 10.1.1.5.2 South Korea: 3D Avatar Solution Market, by Model
- 10.1.1.5.3 South Korea: 3D Avatar Solution Market, by End User
- 10.1.1.6 Rest of Asia Pacific: 3D Avatar Solution Market - Revenue and Forecast to 2028 (US$ Million)
- 10.1.1.6.1 Rest of Asia Pacific: 3D Avatar Solution Market, By Component
- 10.1.1.6.2 Rest of Asia Pacific: 3D Avatar Solution Market, by Model
- 10.1.1.6.3 Rest of Asia Pacific: 3D Avatar Solution Market, by End User
- 10.1.1.1 Australia: 3D Avatar Solution Market - Revenue and Forecast to 2028 (US$ Million)
- 10.1.1 Asia Pacific: 3D Avatar Solution Market, by Key Country
11. Industry Landscape
- 11.1 Overview
- 11.2 Market Initiative
- 11.3 New Product Development
12. Company Profiles
- 12.1 Texel Inc LLC
- 12.1.1 Key Facts
- 12.1.2 Business Description
- 12.1.3 Products and Services
- 12.1.4 Financial Overview
- 12.1.5 SWOT Analysis
- 12.1.6 Key Developments
- 12.2 Osensus GmbH
- 12.2.1 Key Facts
- 12.2.2 Business Description
- 12.2.3 Products and Services
- 12.2.4 Financial Overview
- 12.2.5 SWOT Analysis
- 12.2.6 Key Developments
- 12.3 Bodygee AG
- 12.3.1 Key Facts
- 12.3.2 Business Description
- 12.3.3 Products and Services
- 12.3.4 Financial Overview
- 12.3.5 SWOT Analysis
- 12.3.6 Key Developments
- 12.4 Polyga Inc
- 12.4.1 Key Facts
- 12.4.2 Business Description
- 12.4.3 Products and Services
- 12.4.4 Financial Overview
- 12.4.5 SWOT Analysis
- 12.4.6 Key Developments
- 12.5 TG3D Studio Inc
- 12.5.1 Key Facts
- 12.5.2 Business Description
- 12.5.3 Products and Services
- 12.5.4 Financial Overview
- 12.5.5 SWOT Analysis
- 12.5.6 Key Developments
13. Appendix
- 13.1 About The Insight Partners
- 13.2 Word Index