|
|
市場調査レポート
商品コード
1226824
中東・アフリカのガンマ線スペクトロスコピーの2028年までの市場予測-地域別分析-タイプ別、エンドユーザー別Middle East & Africa Gamma Ray Spectroscopy Market Forecast to 2028 - COVID-19 Impact and Regional Analysis - by Type (Hardware, Software, and Services) and End-User (Space Research, Nuclear Facilities, and Mineral Exploration) |
||||||
|
|
|||||||


| 中東・アフリカのガンマ線スペクトロスコピーの2028年までの市場予測-地域別分析-タイプ別、エンドユーザー別 |
|
出版日: 2023年01月30日
発行: The Insight Partners
ページ情報: 英文 100 Pages
納期: 即納可能
|
- 全表示
- 概要
- 図表
- 目次
中東・アフリカのガンマ線スペクトロスコピー市場は、2022年の4,633万米ドルから2028年には5,923万米ドルに成長すると予測されています。2022年から2028年までのCAGRは4.2%で成長すると推定されています。
軽量ガンマ線スペクトロメーターの使用が中東・アフリカのガンマ線スペクトロスコピー市場を後押し
軽量ガンマ線分光計は、無人航空機(UAV)に搭載してフィールド分光に使用することができます。空中重力基準センサー(GRS)の測定値は、地中の放射性核種濃度の測定に利用できます。GRSセンサーの応用を成功させるためには、濃度の絶対値を正しく測定することが必要です。地上からの高さを正しく測定するためには、空中ガンマ線データで放射性核種の絶対濃度を決定する必要があります。小型UAV放射線モニタリングシステム用に、軽量のCeBr3ガンマ線スペクトロメーターが開発されました。開発後に何度か試運転を行い、高いエネルギー分解能を生み出すことで、最終的にユーザーが実質的なデータを取得できるようになりました。各社は、エンドユーザー産業における様々な用途に対応するため、軽量ガンマ線スペクトロメーターの提供を開始しました。例えば、Geo-Matching社は、UAV用のガンマ線検出器であるMS-1000を提供しています。このように、UAVにガンマ線スペクトロメーターが多く採用されていることは、地域全体のガンマ線スペクトロスコピーメーカーに有利な成長機会をもたらし、中東・アフリカのガンマ線スペクトロスコピー市場を牽引しています。
市場概要
中東・アフリカのガンマ線スペクトロスコピー市場は、南アフリカ、サウジアラビア、UAE、Rest of 中東・アフリカに区分されます。この地域の国々は、主に石油・ガス産業で活躍していますが、現在、各国政府は鉱物探査に力を入れています。例えば、2021年12月、サウジアラビア政府は、同国の土壌に存在する鉱物に関する情報を収集するためにRS-700ガンマ線分光装置を使用しました。前述の国々の政府は、この地域のガンマ線分光法市場の成長にプラスの影響を与えるイニシアチブをもたらすと予想されます。
中東・アフリカのガンマ線スペクトロスコピー市場の収益と2028年までの予測(金額)
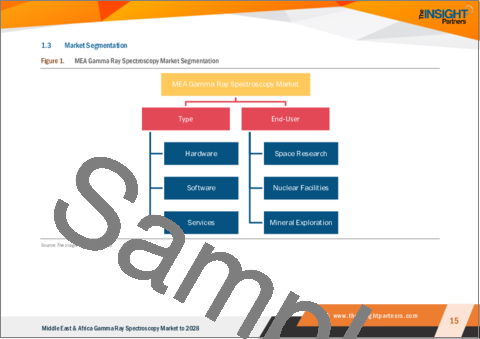
中東・アフリカのガンマ線スペクトロスコピー市場のセグメント化
中東・アフリカのガンマ線スペクトロスコピー市場は、タイプ、エンドユーザー、国に基づいてセグメント化されます。
タイプ別では、中東・アフリカのガンマ線スペクトロスコピー市場は、ハードウェア、ソフトウェア、サービスに区分けされます。2022年の市場シェアは、ハードウェア分野が最大です。
エンドユーザーに基づいて、中東・アフリカのガンマ線スペクトロスコピー市場は、宇宙研究、原子力施設、鉱物探査に区分されます。2022年には、原子力施設分野が最大の市場シェアを占めました。
国別に見ると、中東・アフリカのガンマ線スペクトロスコピー市場は、UAE、サウジアラビア、南アフリカ、中東・アフリカの残りの地域に分類されます。地域別分析では、UAEが2022年の市場シェアを独占しています。
AMETEK Inc.、ANTECH、ATOMTEX、CAEN S.p.A.、Linde Plc、Mirion Technologies、Inc、NATS、Inc、NUVIATech Instruments、Sander Geophysics Limitedは、中東・アフリカのガンマ線スペクトロスコピー市場で活動している主要企業です。
目次
第1章 イントロダクション
第2章 重要なポイント
第3章 調査手法
- カバレッジ
- 2次調査
- 1次調査
第4章 中東・アフリカのガンマ線スペクトロスコピー市場の展望
- 市場概要
- 中東・アフリカのPEST分析
- エコシステム分析
- 専門家の見解
第5章 中東・アフリカのガンマ線スペクトロスコピー市場- 主要な市場力学
- 市場促進要因
- 医療業界におけるガンマ線への嗜好の高まり
- HPGe検出器の使用率上昇
- 市場抑制要因
- 消費者の健康に対するガンマ線の悪影響
- 市場機会
- ガンマ線スペクトロメーターの軽量化
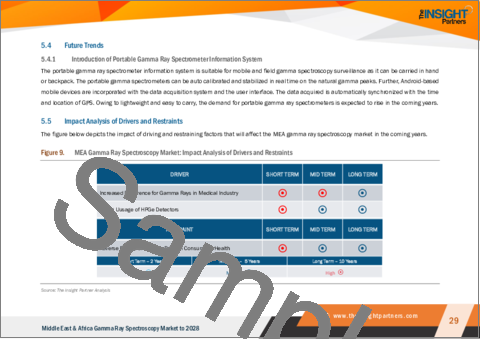
- 今後の動向
- ポータブルガンマ線スペクトロメーター情報システムのイントロダクション
- 促進要因と抑制要因の影響分析
第6章 ガンマ線スペクトロスコピー市場-中東・アフリカ分析
- 中東・アフリカのガンマ線スペクトロスコピー市場の概要
第7章 中東・アフリカのガンマ線スペクトロスコピー市場分析:タイプ別
- 中東・アフリカのガンマ線スペクトロスコピー市場内訳:タイプ別(2021年、2028年)
- ハードウェア
- ソフトウェア
- サービス
第8章 中東・アフリカのガンマ線スペクトロスコピーの市場分析:エンドユーザー別
- 中東・アフリカのガンマ線スペクトロスコピー市場内訳:エンドユーザー別(2021年、2028年)
- 宇宙開発施設
- 原子力施設
- 鉱物探査
第9章 中東・アフリカのガンマ線スペクトロスコピー市場:国別分析
- 中東・アフリカ
- 南アフリカ
- サウジアラビア
- UAE
- 中東・アフリカの残りの地域
第10章 業界情勢
- マーケットイニシアティブ
- 合併・買収
- 新製品開発
第11章 企業プロファイル
- CAEN S.p.A.
- Mirion Technologies, Inc.
- AMETEK Inc.
- Linde Plc
- Sander Geophysics Limited
- NUVIATech Instruments
- ANTECH
- NATS, Inc.
- ATOMTEX
第12章 付録
List Of Tables
- Table 1. MEA Gamma Ray Spectroscopy Market - Revenue and Forecast to 2028 (US$ Million)
- Table 2. MEA: Gamma Ray Spectroscopy Market- by Key Country - Revenue and Forecast to 2028 (US$ Million)
- Table 3. South Africa: Gamma Ray Spectroscopy Market- by Type -Revenue and Forecast to 2028 (US$ Million)
- Table 4. South Africa: Gamma Ray Spectroscopy Market- by End-User -Revenue and Forecast to 2028 (US$ Million)
- Table 5. Saudi Arabia: Gamma Ray Spectroscopy Market- by Type -Revenue and Forecast to 2028 (US$ Million)
- Table 6. Saudi Arabia: Gamma Ray Spectroscopy Market- by End-User -Revenue and Forecast to 2028 (US$ Million)
- Table 7. UAE: Gamma Ray Spectroscopy Market- by Type -Revenue and Forecast to 2028 (US$ Million)
- Table 8. UAE: Gamma Ray Spectroscopy Market - by End-User -Revenue and Forecast to 2028 (US$ Million)
- Table 9. Rest of MEA: Gamma Ray Spectroscopy Market- by Type -Revenue and Forecast to 2028 (US$ Million)
- Table 10. Rest of MEA: Gamma Ray Spectroscopy Market- by End-User -Revenue and Forecast to 2028 (US$ Million)
- Table 11. List of Abbreviation
List Of Figures
- Figure 1. MEA Gamma Ray Spectroscopy Market Segmentation
- Figure 2. MEA Gamma Ray Spectroscopy Market Segmentation - By Country
- Figure 3. MEA Gamma Ray Spectroscopy Market Overview
- Figure 4. MEA Gamma Ray Spectroscopy Market, By Type
- Figure 5. MEA Gamma Ray Spectroscopy Market, By Country
- Figure 6. MEA: PEST Analysis
- Figure 7. MEA Gamma Ray Spectroscopy Market - Ecosystem Analysis
- Figure 8. Expert Opinion
- Figure 9. MEA Gamma Ray Spectroscopy Market: Impact Analysis of Drivers and Restraints
- Figure 10. MEA Gamma Ray Spectroscopy Market Revenue and Forecast to 2028 (US$ Million)
- Figure 11. MEA Gamma Ray Spectroscopy Market Breakdown, By Type (2021 and 2028)
- Figure 12. MEA Hardware: Gamma Ray Spectroscopy Market Revenue and Forecast to 2028 (US$ Million)
- Figure 13. MEA Software: Gamma Ray Spectroscopy Market Revenue and Forecast to 2028 (US$ Million)
- Figure 14. MEA Services: Gamma Ray Spectroscopy Market Revenue and Forecast to 2028 (US$ Million)
- Figure 15. MEA Gamma Ray Spectroscopy Market Breakdown, By End-User (2021 and 2028)
- Figure 16. MEA Space Research: Gamma Ray Spectroscopy Market Revenue and Forecast to 2028 (US$ Million)
- Figure 17. MEA Nuclear Facilities: Gamma Ray Spectroscopy Market Revenue and Forecast to 2028 (US$ Million)
- Figure 18. MEA Mineral Exploration: Gamma Ray Spectroscopy Market Revenue and Forecast to 2028 (US$ Million)
- Figure 19. MEA: Gamma Ray Spectroscopy Market, by Key Country - Revenue (2021) (US$ 'Million)
- Figure 20. MEA: Gamma Ray Spectroscopy Market Revenue Share, By Key Country (2021 and 2028)
- Figure 21. South Africa: Gamma Ray Spectroscopy Market - Revenue and Forecast to 2028 (US$ Million)
- Figure 22. Saudi Arabia: Gamma Ray Spectroscopy Market - Revenue and Forecast to 2028 (US$ Million)
- Figure 23. UAE: Gamma Ray Spectroscopy Market - Revenue and Forecast to 2028 (US$ Million)
- Figure 24. Rest of MEA: Gamma Ray Spectroscopy Market - Revenue and Forecast to 2028 (US$ Million)
The MEA gamma ray spectroscopy market is expected to grow from US$ 46.33 million in 2022 to US$ 59.23 million by 2028. It is estimated to grow at a CAGR of 4.2% from 2022 to 2028.
Use of Lightweight Gamma Ray Spectrometers Fuels the MEA Gamma Ray Spectroscopy Market
The lightweight gamma ray spectrometers can be used in unmanned aerial vehicles (UAVs) for field spectroscopy. The airborne gravitational reference sensor (GRS) measurements can be utilized to determine radionuclide concentrations in the ground. For the GRS sensors' successful applications, the correct measurement of absolute values of concentrations is necessary. For the correct measurement of height from the ground, the airborne gamma ray data must determine the absolute radionuclide concentrations. A lightweight CeBr3 gamma ray spectrometer was developed for the small UAV radiation monitoring systems. Several trial runs were conducted post development, which resulted in generating high energy resolution that ultimately helped users gain substantial data. The companies started offering lightweight gamma ray spectrometers due to its varied applications in end-user industries. For instance, Geo-Matching offers MS-1000, a gamma ray detector for UAVs. Thus, the high adoption of gamma ray spectrometers in UAVs bring in lucrative growth opportunities for the gamma ray spectroscopy manufacturers across the region, thereby driving the MEA gamma ray spectroscopy market .
Market Overview
The MEA gamma ray spectroscopy market is segmented into South Africa, Saudi Arabia, the UAE, and the Rest of MEA. The countries in the region are mostly active in the oil & gas industry; however, the governments are now focusing on mineral exploration. For instance, in December 2021, the government of Saudi Arabia used RS-700 gamma ray spectroscopy devices to collect information about the minerals present in the country's soil. The governments of the aforesaid countries are expected to bring initiatives that will positively influence the gamma ray spectroscopy market growth in the region.
MEA Gamma Ray Spectroscopy Market Revenue and Forecast to 2028 (US$ Million)
MEA Gamma Ray Spectroscopy Market Segmentation
The MEA gamma ray spectroscopy market is segmented based on type, end-user, and country.
Based on type, the MEA gamma ray spectroscopy market is segmented into hardware, software, and services. The hardware segment held the largest market share in 2022.
Based on end-user, the MEA gamma ray spectroscopy market is segmented into space research, nuclear facilities, and mineral exploration. The nuclear facilities segment held the largest market share in 2022.
Based on country, the MEA gamma ray spectroscopy market has been categorized into the UAE, Saudi Arabia, South Africa, and the Rest of MEA. Our regional analysis states that the UAE dominated the market share in 2022.
AMETEK Inc.; ANTECH; ATOMTEX; CAEN S.p.A.; Linde Plc; Mirion Technologies, Inc.; NATS, Inc.; NUVIATech Instruments; and Sander Geophysics Limited are the leading companies operating in the MEA gamma ray spectroscopy market.
Reasons to Buy:
- Save and reduce time carrying out entry-level research by identifying the growth, size, leading players, and segments in the MEA gamma ray spectroscopy market.
- Highlights key business priorities in order to assist companies to realign their business strategies
- The key findings and recommendations highlight crucial progressive industry trends in the MEA gamma ray spectroscopy market, thereby allowing players across the value chain to develop effective long-term strategies
- Develop/modify business expansion plans by using substantial growth offering developed and emerging markets
- Scrutinize in-depth MEA market trends and outlook coupled with the factors driving the gamma ray spectroscopy market, as well as those hindering it
- Enhance the decision-making process by understanding the strategies that underpin commercial interest with respect to client products, segmentation, pricing, and distribution
Table Of Contents
1. Introduction
- 1.1 Study Scope
- 1.2 The Insight Partners Research Report Guidance
- 1.3 Market Segmentation
2. Key Takeaways
3. Research Methodology
- 3.1 Coverage
- 3.2 Secondary Research
- 3.3 Primary Research
4. MEA Gamma Ray Spectroscopy Market Landscape
- 4.1 Market Overview
- 4.2 MEA PEST Analysis
- 4.3 Ecosystem Analysis
- 4.4 Expert Opinion
5. MEA Gamma Ray Spectroscopy Market - Key Market Dynamics
- 5.1 Market Drivers
- 5.1.1 Increased Preference for Gamma Rays in Medical Industry
- 5.1.2 Rising Usage of HPGe Detectors
- 5.2 Market Restraints
- 5.2.1 Adverse Effects of Gamma Rays on Consumer's Health
- 5.3 Market Opportunities
- 5.3.1 Use of Lightweight Gamma Ray Spectrometers
- 5.4 Future Trends
- 5.4.1 Introduction of Portable Gamma Ray Spectrometer Information System
- 5.5 Impact Analysis of Drivers and Restraints
6. Gamma Ray Spectroscopy Market - MEA Analysis
- 6.1 MEA Gamma Ray Spectroscopy Market Overview
- 6.2 MEA Gamma Ray Spectroscopy Market Revenue and Forecast to 2028 (US$ Million)
7. MEA Gamma Ray Spectroscopy Market Analysis - By Type
- 7.1 Overview
- 7.2 MEA Gamma Ray Spectroscopy Market Breakdown, By Type (2021 and 2028)
- 7.3 Hardware
- 7.3.1 Overview
- 7.3.2 Hardware: Gamma Ray Spectroscopy Market Revenue and Forecast to 2028 (US$ Million)
- 7.4 Software
- 7.4.1 Overview
- 7.4.2 Software: Gamma Ray Spectroscopy Market Revenue and Forecast to 2028 (US$ Million)
- 7.5 Services
- 7.5.1 Overview
- 7.5.2 Services: Gamma Ray Spectroscopy Market Revenue and Forecast to 2028 (US$ Million)
8. MEA Gamma Ray Spectroscopy Market Analysis - By End-User
- 8.1 Overview
- 8.2 MEA Gamma Ray Spectroscopy Market Breakdown, By End-User (2021 and 2028)
- 8.3 Space Research
- 8.3.1 Overview
- 8.3.2 Space Research: Gamma Ray Spectroscopy Market Revenue and Forecast to 2028 (US$ Million)
- 8.4 Nuclear Facilities
- 8.4.1 Overview
- 8.4.2 Nuclear Facilities: Gamma Ray Spectroscopy Market Revenue and Forecast to 2028 (US$ Million)
- 8.5 Mineral Exploration
- 8.5.1 Overview
- 8.5.2 Mineral Exploration: Gamma Ray Spectroscopy Market Revenue and Forecast to 2028 (US$ Million)
9. MEA Gamma Ray Spectroscopy Market - Country Analysis
- 9.1 Overview
- 9.1.1 MEA: Gamma Ray Spectroscopy Market- by Key Country
- 9.1.1.1 South Africa: Gamma Ray Spectroscopy Market - Revenue and Forecast to 2028 (US$ Million)
- 9.1.1.1.1 South Africa: Gamma Ray Spectroscopy Market- by Type
- 9.1.1.1.2 South Africa: Gamma Ray Spectroscopy Market- by End-User
- 9.1.1.2 Saudi Arabia: Gamma Ray Spectroscopy Market - Revenue and Forecast to 2028 (US$ Million)
- 9.1.1.2.1 Saudi Arabia: Gamma Ray Spectroscopy Market- by Type
- 9.1.1.2.2 Saudi Arabia: Gamma Ray Spectroscopy Market- by End-User
- 9.1.1.3 UAE: Gamma Ray Spectroscopy Market - Revenue and Forecast to 2028 (US$ Million)
- 9.1.1.3.1 UAE: Gamma Ray Spectroscopy Market- by Type
- 9.1.1.3.2 UAE: Gamma Ray Spectroscopy Market - by End-User
- 9.1.1.4 Rest of MEA: Gamma Ray Spectroscopy Market - Revenue and Forecast to 2028 (US$ Million)
- 9.1.1.4.1 Rest of MEA: Gamma Ray Spectroscopy Market- by Type
- 9.1.1.4.2 Rest of MEA: Gamma Ray Spectroscopy Market- by End-User
- 9.1.1.1 South Africa: Gamma Ray Spectroscopy Market - Revenue and Forecast to 2028 (US$ Million)
- 9.1.1 MEA: Gamma Ray Spectroscopy Market- by Key Country
10. Industry Landscape
- 10.1 Overview
- 10.2 Market Initiative
- 10.3 Merger and Acquisition
- 10.4 New Product Development
11. Company Profiles
- 11.1 CAEN S.p.A.
- 11.1.1 Key Facts
- 11.1.2 Business Description
- 11.1.3 Products and Services
- 11.1.4 Financial Overview
- 11.1.5 SWOT Analysis
- 11.1.6 Key Developments
- 11.2 Mirion Technologies, Inc.
- 11.2.1 Key Facts
- 11.2.2 Business Description
- 11.2.3 Products and Services
- 11.2.4 Financial Overview
- 11.2.5 SWOT Analysis
- 11.2.6 Key Developments
- 11.3 AMETEK Inc.
- 11.3.1 Key Facts
- 11.3.2 Business Description
- 11.3.3 Products and Services (Offerings of AMETEK, Inc.)
- 11.3.4 Products and Services (Offerings of Amptek -a subsidiary of AMETEK, Inc.)
- 11.3.5 Financial Overview
- 11.3.6 SWOT Analysis
- 11.3.7 Key Developments
- 11.4 Linde Plc
- 11.4.1 Key Facts
- 11.4.2 Business Description
- 11.4.3 Products and Services
- 11.4.4 Financial Overview
- 11.4.5 SWOT Analysis
- 11.4.6 Key Developments
- 11.5 Sander Geophysics Limited
- 11.5.1 Key Facts
- 11.5.2 Business Description
- 11.5.3 Products and Services
- 11.5.4 Financial Overview
- 11.5.5 SWOT Analysis
- 11.5.6 Key Developments
- 11.6 NUVIATech Instruments
- 11.6.1 Key Facts
- 11.6.2 Business Description
- 11.6.3 Products and Services
- 11.6.4 Financial Overview
- 11.6.5 SWOT Analysis
- 11.6.6 Key Developments
- 11.7 ANTECH
- 11.7.1 Key Facts
- 11.7.2 Business Description
- 11.7.3 Products and Services
- 11.7.4 Financial Overview
- 11.7.5 SWOT Analysis
- 11.7.6 Key Developments
- 11.8 NATS, Inc.
- 11.8.1 Key Facts
- 11.8.2 Business Description
- 11.8.3 Products and Services
- 11.8.4 Financial Overview
- 11.8.5 SWOT Analysis
- 11.8.6 Key Developments
- 11.9 ATOMTEX
- 11.9.1 Key Facts
- 11.9.2 Business Description
- 11.9.3 Products and Services
- 11.9.4 Financial Overview
- 11.9.5 SWOT Analysis
- 11.9.6 Key Developments
12. Appendix
- 12.1 About The Insight Partners
- 12.2 Word Index