|
|
市場調査レポート
商品コード
1206403
南米のガンマ線スペクトロスコピーの2028年までの市場予測- 地域別分析- タイプ別(ハードウェア、ソフトウェア、サービス)、エンドユーザー別(宇宙開発施設、原子力施設、鉱物探査)South America Gamma Ray Spectroscopy Market Forecast to 2028 - COVID-19 Impact and Regional Analysis - by Type (Hardware, Software, and Services) and End-User (Space Research, Nuclear Facilities, and Mineral Exploration) |
||||||
|
|
|||||||


| 南米のガンマ線スペクトロスコピーの2028年までの市場予測- 地域別分析- タイプ別(ハードウェア、ソフトウェア、サービス)、エンドユーザー別(宇宙開発施設、原子力施設、鉱物探査) |
|
出版日: 2023年01月17日
発行: The Insight Partners
ページ情報: 英文 94 Pages
納期: 即納可能
|
- 全表示
- 概要
- 図表
- 目次
南米のガンマ線スペクトロスコピー市場は、2022年の2,886万米ドルから2028年には3,481万米ドルに成長すると予測されています。2022年から2028年までのCAGRは3.2%と推定されています。
軽量ガンマ線スペクトロメーターの使用が南米のガンマ線スペクトロスコピー市場を牽引する
軽量ガンマ線スペクトロメーターは、無人航空機(UAV)に搭載してフィールド分光に使用することができます。空中重力基準センサー(GRS)の測定値は、地中の放射性核種濃度の測定に活用することができます。GRSセンサーの応用を成功させるためには、濃度の絶対値を正しく測定することが必要です。地上からの高さを正しく測定するためには、空中ガンマ線データで放射性核種の絶対濃度を決定する必要があります。小型UAV放射線モニタリングシステム用に、軽量のCeBr3ガンマ線スペクトロメーターが開発されました。開発後に何度か試運転を行い、高いエネルギー分解能を生み出すことで、最終的にユーザーが実質的なデータを取得できるようになりました。各社は、エンドユーザー産業における様々な用途に対応するため、軽量ガンマ線スペクトロメーターの提供を開始しました。例えば、Geo-Matching社は、UAV用のガンマ線検出器であるMS-1000を提供しています。このように、UAVにガンマ線スペクトロメーターが多く採用されていることは、有利な成長機会をもたらし、予測期間中の南米のガンマ線スペクトロスコピー市場を牽引しています。
南米のガンマ線スペクトロスコピー市場の概要
南米のガンマ線スペクトロスコピー市場は、ブラジル、アルゼンチン、Rest of 南米に区分されます。ブラジルは2020年に2番目に大きな鉄鉱石生産国でした。チリとアルゼンチンは、世界のリチウムの埋蔵量の60%までを保有しています。ガンマ線スペクトロスコピーは、ポーフィリー銅や巨大硫化物といった物質の抽出に大きな役割を果たします。例えば、2022年6月、ブラボー・マイニング社のルアンガ白金族金属プロジェクトが、ブラジル政府から「戦略的鉱物プロジェクト」に選定されました。このようなプロジェクトでは、鉱物の正確な位置を検出するためにガンマ線スペクトロスコピーが必要となります。ブラジルは、航空宇宙産業や研究産業が盛んな国として知られています。2022年6月、ブラジル宇宙庁とアマゾンウェブサービス(AWS)は、電離層調査やその他多くのプロジェクトに取り組む戦略的協定を締結しました。両者の合意により、相当数のガンマ線スペクトロメーターが需要されることが予想され、今後数年間、南米地域のガンマ線スペクトロスコピー市場をさらに強化することが期待されます。
南米のガンマ線スペクトロスコピー市場の収益と2028年までの予測(金額)
南米のガンマ線スペクトロスコピー市場のセグメンテーション
南米のガンマ線スペクトロスコピー市場は、タイプ、エンドユーザー、国に基づいてセグメント化されます。
タイプ別では、南米のガンマ線スペクトロスコピー市場は、ハードウェア、ソフトウェア、サービスに区分されます。2022年の市場シェアは、ハードウェア分野が最も大きいです。
エンドユーザーに基づいて、南米のガンマ線スペクトロスコピー市場は、宇宙研究、原子力施設、鉱物探査に区分されます。2022年には、原子力施設分野が最大の市場シェアを占めました。
国別では、南米のガンマ線スペクトロスコピー市場は、ブラジル、アルゼンチン、その他の南米に分類されます。地域別分析では、2022年にブラジルが市場シェアを独占しています。
AMETEK Inc.、ANTECH、ATOMTEX、CAEN S.p.A.、Linde Plc、Mirion Technologies、Inc、NATS、およびSander Geophysics Limitedは、南米のガンマ線スペクトロスコピー市場で活動している主要企業です。
目次
第1章 イントロダクション
第2章 重要なポイント
第3章 調査手法
- カバレッジ
- 2次調査
- 1次調査
第4章 ガンマ線スペクトロスコピーの市場情勢
- 市場概要
- 南米のPEST分析
- エコシステム分析
- 専門家の見解
第5章 南米のガンマ線スペクトロスコピー市場-主要の市場力学
- 市場促進要因
- 医療分野でのガンマ線に対する好みの高まり
- HPGe検出器の使用率上昇
- 市場抑制要因
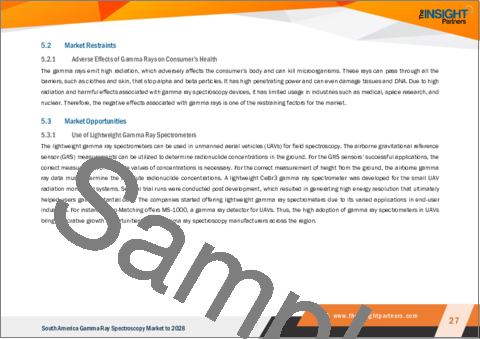
- 消費者の健康に対するガンマ線の悪影響
- 市場機会
- ガンマ線スペクトロメーターの軽量化
- 今後の動向
- ポータブルガンマ線スペクトロメーター情報システムのイントロダクション
- 促進要因と抑制要因の影響分析
第6章 ガンマ線スペクトロスコピー市場- 南米分析
- 南米のガンマ線スペクトロスコピー市場の概要
第7章 南米のガンマ線スペクトロスコピー市場分析- タイプ別
- 南米のガンマ線スペクトロスコピー市場内訳、タイプ別(2021年、2028年)
- ハードウェア
- ソフトウェア
- サービス
第8章 南米のガンマ線スペクトロスコピーの市場分析:エンドユーザー別
- 南米のガンマ線スペクトロスコピー市場の内訳:エンドユーザー別(2021年、2028年)
- 宇宙開発施設
- 原子力施設
- 鉱物探査
第9章 南米のガンマ線スペクトロスコピー市場:国別分析
- 南米
- ブラジル
- アルゼンチン
- その他南米諸国
第10章 業界情勢
- 市場への取り組み
- 合併・買収
- 新製品開発
第11章 企業プロファイル
- CAEN S.p.A.
- Mirion Technologies, Inc.
- AMETEK Inc.
- Linde Plc
- Sander Geophysics Limited
- ANTECH
- NATS, Inc.
- ATOMTEX
第12章 付録
List Of Tables
- Table 1. SAM Gamma Ray Spectroscopy Market - Revenue and Forecast to 2028 (US$ Million)
- Table 2. SAM: Gamma Ray Spectroscopy Market- by Key Country - Revenue and Forecast to 2028 (US$ Million)
- Table 3. Brazil: Gamma Ray Spectroscopy Market- by Type -Revenue and Forecast to 2028 (US$ Million)
- Table 4. Brazil: Gamma Ray Spectroscopy Market- by End-User -Revenue and Forecast to 2028 (US$ Million)
- Table 5. Argentina: Gamma Ray Spectroscopy Market- by Type -Revenue and Forecast to 2028 (US$ Million)
- Table 6. Argentina: Gamma Ray Spectroscopy Market- by End-User -Revenue and Forecast to 2028 (US$ Million)
- Table 7. Rest of SAM: Gamma Ray Spectroscopy Market- by Type-Revenue and Forecast to 2028 (US$ Million)
- Table 8. Rest of SAM: Gamma Ray Spectroscopy Market- by End-User -Revenue and Forecast to 2028 (US$ Million)
- Table 9. List of Abbreviation
List Of Figures
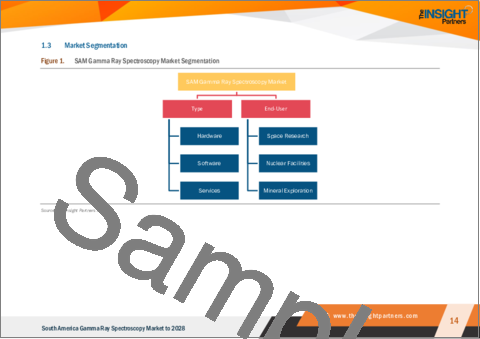
- Figure 1. SAM Gamma Ray Spectroscopy Market Segmentation
- Figure 2. SAM Gamma Ray Spectroscopy Market Segmentation - By Country
- Figure 3. SAM Gamma Ray Spectroscopy Market Overview
- Figure 4. SAM Gamma Ray Spectroscopy Market, By Type
- Figure 5. SAM Gamma Ray Spectroscopy Market, By Country
- Figure 6. SAM: PEST Analysis
- Figure 7. SAM Gamma Ray Spectroscopy Market - Ecosystem Analysis
- Figure 8. Expert Opinion
- Figure 9. SAM Gamma Ray Spectroscopy Market: Impact Analysis of Drivers and Restraints
- Figure 10. SAM Gamma Ray Spectroscopy Market Revenue and Forecast to 2028 (US$ Million)
- Figure 11. SAM Gamma Ray Spectroscopy Market Breakdown, By Type (2021 and 2028)
- Figure 12. SAM Hardware: Gamma Ray Spectroscopy Market Revenue and Forecast to 2028 (US$ Million)
- Figure 13. SAM Software: Gamma Ray Spectroscopy Market Revenue and Forecast to 2028 (US$ Million)
- Figure 14. SAM Services: Gamma Ray Spectroscopy Market Revenue and Forecast to 2028 (US$ Million)
- Figure 15. SAM Gamma Ray Spectroscopy Market Breakdown, By End-User (2021 and 2028)
- Figure 16. SAM Space Research: Gamma Ray Spectroscopy Market Revenue and Forecast to 2028 (US$ Million)
- Figure 17. SAM Nuclear Facilities: Gamma Ray Spectroscopy Market Revenue and Forecast to 2028 (US$ Million)
- Figure 18. SAM Mineral Exploration: Gamma Ray Spectroscopy Market Revenue and Forecast to 2028 (US$ Million)
- Figure 19. SAM: Gamma Ray Spectroscopy Market, by Key Country - Revenue (2021) (US$ 'Million)
- Figure 20. SAM: Gamma Ray Spectroscopy Market Revenue Share, By Key Country (2021 and 2028)
- Figure 21. Brazil: Gamma Ray Spectroscopy Market - Revenue and Forecast to 2028 (US$ Million)
- Figure 22. Argentina: Gamma Ray Spectroscopy Market - Revenue and Forecast to 2028 (US$ Million)
- Figure 23. Rest of SAM: Gamma Ray Spectroscopy Market - Revenue and Forecast to 2028 (US$ Million)
The SAM gamma ray spectroscopy market is expected to grow from US$ 28.86 million in 2022 to US$ 34.81 million by 2028. It is estimated to grow at a CAGR of 3.2% from 2022 to 2028.
Use of Lightweight Gamma Ray Spectrometers is Driving the SAM Gamma Ray Spectroscopy Market
The lightweight gamma ray spectrometers can be used in unmanned aerial vehicles (UAVs) for field spectroscopy. The airborne gravitational reference sensor (GRS) measurements can be utilized to determine radionuclide concentrations in the ground. For the GRS sensors' successful applications, the correct measurement of absolute values of concentrations is necessary. For the correct measurement of height from the ground, the airborne gamma ray data must determine the absolute radionuclide concentrations. A lightweight CeBr3 gamma ray spectrometer was developed for the small UAV radiation monitoring systems. Several trial runs were conducted post development, which resulted in generating high energy resolution that ultimately helped users gain substantial data. The companies started offering lightweight gamma ray spectrometers due to its varied applications in end-user industries. For instance, Geo-Matching offers MS-1000, a gamma ray detector for UAVs. Thus, the high adoption of gamma ray spectrometers in UAVs bring in lucrative growth opportunities, thereby driving the SAM gamma ray spectroscopy market during forecast period.
SAM Gamma Ray Spectroscopy Market Overview
The SAM gamma ray spectroscopy market is segmented into Brazil, Argentina, and the Rest of SAM. Brazil was the second-largest iron ore producer in 2020. Chile and Argentina hold up to 60% of the global reserve of lithium in the world. Gamma ray spectroscopy plays a major role in extracting materials such as porphyry copper and massive sulfides. For instance, in June 2022, Bravo Mining Corporation's Luanga platinum group metals project was selected as a "Strategic Mineral Project" by the Government of Brazil. For such projects, gamma ray spectroscopy will be needed to detect the exact location of minerals. Brazil is known for its aerospace and research industries. In June 2022, the Brazilian Space Agency and Amazon Web Services (AWS) signed a strategic agreement where they will be working on ionosphere research and many other projects. The agreement among the two entities is expected to demand a significant number of gamma ray spectrometers, which is further expected to bolster the gamma ray spectroscopy market in the SAM region over the next few years.
SAM Gamma Ray Spectroscopy Market Revenue and Forecast to 2028 (US$ Million)
SAM Gamma Ray Spectroscopy Market Segmentation
The SAM gamma ray spectroscopy market is segmented based on type, end-user, and country.
Based on type, the SAM gamma ray spectroscopy market is segmented into hardware, software, and services. The hardware segment held the largest market share in 2022.
Based on end-user, the SAM gamma ray spectroscopy market is segmented into space research, nuclear facilities, and mineral exploration. The nuclear facilities segment held the largest market share in 2022.
Based on country, the SAM gamma ray spectroscopy market has been categorized into Brazil, Argentina, and the Rest of SAM. Our regional analysis states that Brazil dominated the market share in 2022.
AMETEK Inc.; ANTECH; ATOMTEX; CAEN S.p.A.; Linde Plc; Mirion Technologies, Inc.; NATS, Inc.; and Sander Geophysics Limited are the leading companies operating in the SAM gamma ray spectroscopy market.
Reasons to Buy:
- Save and reduce time carrying out entry-level research by identifying the growth, size, leading players, and segments in the SAM gamma ray spectroscopy market.
- Highlights key business priorities in order to assist companies to realign their business strategies
- The key findings and recommendations highlight crucial progressive industry trends in the SAM gamma ray spectroscopy market, thereby allowing players across the value chain to develop effective long-term strategies
- Develop/modify business expansion plans by using substantial growth offering developed and emerging markets
- Scrutinize in-depth SAM market trends and outlook coupled with the factors driving the gamma ray spectroscopy market, as well as those hindering it
- Enhance the decision-making process by understanding the strategies that underpin commercial interest with respect to client products, segmentation, pricing, and distribution
Table Of Contents
1. Introduction
- 1.1 Study Scope
- 1.2 The Insight Partners Research Report Guidance
- 1.3 Market Segmentation
2. Key Takeaways
3. Research Methodology
- 3.1 Coverage
- 3.2 Secondary Research
- 3.3 Primary Research
4. SAM Gamma Ray Spectroscopy Market Landscape
- 4.1 Market Overview
- 4.2 SAM PEST Analysis
- 4.3 Ecosystem Analysis
- 4.4 Expert Opinion
5. SAM Gamma Ray Spectroscopy Market - Key Market Dynamics
- 5.1 Market Drivers
- 5.1.1 Increased Preference for Gamma Rays in Medical Industry
- 5.1.2 Rising Usage of HPGe Detectors
- 5.2 Market Restraints
- 5.2.1 Adverse Effects of Gamma Rays on Consumer's Health
- 5.3 Market Opportunities
- 5.3.1 Use of Lightweight Gamma Ray Spectrometers
- 5.4 Future Trends
- 5.4.1 Introduction of Portable Gamma Ray Spectrometer Information System
- 5.5 Impact Analysis of Drivers and Restraints
6. Gamma Ray Spectroscopy Market - SAM Analysis
- 6.1 SAM Gamma Ray Spectroscopy Market Overview
- 6.2 SAM Gamma Ray Spectroscopy Market Revenue and Forecast to 2028 (US$ Million)
7. SAM Gamma Ray Spectroscopy Market Analysis - By Type
- 7.1 Overview
- 7.2 SAM Gamma Ray Spectroscopy Market Breakdown, By Type (2021 and 2028)
- 7.3 Hardware
- 7.3.1 Overview
- 7.3.2 Hardware: Gamma Ray Spectroscopy Market Revenue and Forecast to 2028 (US$ Million)
- 7.4 Software
- 7.4.1 Overview
- 7.4.2 Software: Gamma Ray Spectroscopy Market Revenue and Forecast to 2028 (US$ Million)
- 7.5 Services
- 7.5.1 Overview
- 7.5.2 Services: Gamma Ray Spectroscopy Market Revenue and Forecast to 2028 (US$ Million)
8. SAM Gamma Ray Spectroscopy Market Analysis - By End-User
- 8.1 Overview
- 8.2 SAM Gamma Ray Spectroscopy Market Breakdown, By End-User (2021 and 2028)
- 8.3 Space Research
- 8.3.1 Overview
- 8.3.2 Space Research: Gamma Ray Spectroscopy Market Revenue and Forecast to 2028 (US$ Million)
- 8.4 Nuclear Facilities
- 8.4.1 Overview
- 8.4.2 Nuclear Facilities: Gamma Ray Spectroscopy Market Revenue and Forecast to 2028 (US$ Million)
- 8.5 Mineral Exploration
- 8.5.1 Overview
- 8.5.2 Mineral Exploration: Gamma Ray Spectroscopy Market Revenue and Forecast to 2028 (US$ Million)
9. SAM Gamma Ray Spectroscopy Market - Country Analysis
- 9.1 Overview
- 9.1.1 SAM: Gamma Ray Spectroscopy Market- by Key Country
- 9.1.1.1 Brazil: Gamma Ray Spectroscopy Market - Revenue and Forecast to 2028 (US$ Million)
- 9.1.1.1.1 Brazil: Gamma Ray Spectroscopy Market- by Type
- 9.1.1.1.2 Brazil: Gamma Ray Spectroscopy Market- by End-User
- 9.1.1.2 Argentina: Gamma Ray Spectroscopy Market - Revenue and Forecast to 2028 (US$ Million)
- 9.1.1.2.1 Argentina: Gamma Ray Spectroscopy Market- by Type
- 9.1.1.2.2 Argentina: Gamma Ray Spectroscopy Market- by End-User
- 9.1.1.3 Rest of SAM: Gamma Ray Spectroscopy Market - Revenue and Forecast to 2028 (US$ Million)
- 9.1.1.3.1 Rest of SAM: Gamma Ray Spectroscopy Market- by Type
- 9.1.1.3.2 Rest of SAM: Gamma Ray Spectroscopy Market- by End-User
- 9.1.1.1 Brazil: Gamma Ray Spectroscopy Market - Revenue and Forecast to 2028 (US$ Million)
- 9.1.1 SAM: Gamma Ray Spectroscopy Market- by Key Country
10. Industry Landscape
- 10.1 Overview
- 10.2 Market Initiative
- 10.3 Merger and Acquisition
- 10.4 New Product Development
11. Company Profiles
- 11.1 CAEN S.p.A.
- 11.1.1 Key Facts
- 11.1.2 Business Description
- 11.1.3 Products and Services
- 11.1.4 Financial Overview
- 11.1.5 SWOT Analysis
- 11.1.6 Key Developments
- 11.2 Mirion Technologies, Inc.
- 11.2.1 Key Facts
- 11.2.2 Business Description
- 11.2.3 Products and Services
- 11.2.4 Financial Overview
- 11.2.5 SWOT Analysis
- 11.2.6 Key Developments
- 11.3 AMETEK Inc.
- 11.3.1 Key Facts
- 11.3.2 Business Description
- 11.3.3 Products and Services (Offerings of AMETEK, Inc.)
- 11.3.4 Products and Services (Offerings of Amptek -a subsidiary of AMETEK, Inc.)
- 11.3.5 Financial Overview
- 11.3.6 SWOT Analysis
- 11.3.7 Key Developments
- 11.4 Linde Plc
- 11.4.1 Key Facts
- 11.4.2 Business Description
- 11.4.3 Products and Services
- 11.4.4 Financial Overview
- 11.4.5 SWOT Analysis
- 11.4.6 Key Developments
- 11.5 Sander Geophysics Limited
- 11.5.1 Key Facts
- 11.5.2 Business Description
- 11.5.3 Products and Services
- 11.5.4 Financial Overview
- 11.5.5 SWOT Analysis
- 11.5.6 Key Developments
- 11.6 ANTECH
- 11.6.1 Key Facts
- 11.6.2 Business Description
- 11.6.3 Products and Services
- 11.6.4 Financial Overview
- 11.6.5 SWOT Analysis
- 11.6.6 Key Developments
- 11.7 NATS, Inc.
- 11.7.1 Key Facts
- 11.7.2 Business Description
- 11.7.3 Products and Services
- 11.7.4 Financial Overview
- 11.7.5 SWOT Analysis
- 11.7.6 Key Developments
- 11.8 ATOMTEX
- 11.8.1 Key Facts
- 11.8.2 Business Description
- 11.8.3 Products and Services
- 11.8.4 Financial Overview
- 11.8.5 SWOT Analysis
- 11.8.6 Key Developments
12. Appendix
- 12.1 About The Insight Partners
- 12.2 Word Index