|
|
市場調査レポート
商品コード
1141914
ガンマ線分光法の2028年までの市場予測-世界分析- タイプ別(ハードウェア、ソフトウェア、サービス)、エンドユーザー別(宇宙研究、原子力施設、鉱物探査)Gamma Ray Spectroscopy Market Forecast to 2028 - COVID-19 Impact and Global Analysis - by Type (Hardware, Software, and Services), End-User (Space Research, Nuclear Facilities, and Mineral Exploration) |
||||||
|
|
|||||||


| ガンマ線分光法の2028年までの市場予測-世界分析- タイプ別(ハードウェア、ソフトウェア、サービス)、エンドユーザー別(宇宙研究、原子力施設、鉱物探査) |
|
出版日: 2022年09月30日
発行: The Insight Partners
ページ情報: 英文 153 Pages
納期: 即納可能
|
- 全表示
- 概要
- 図表
- 目次
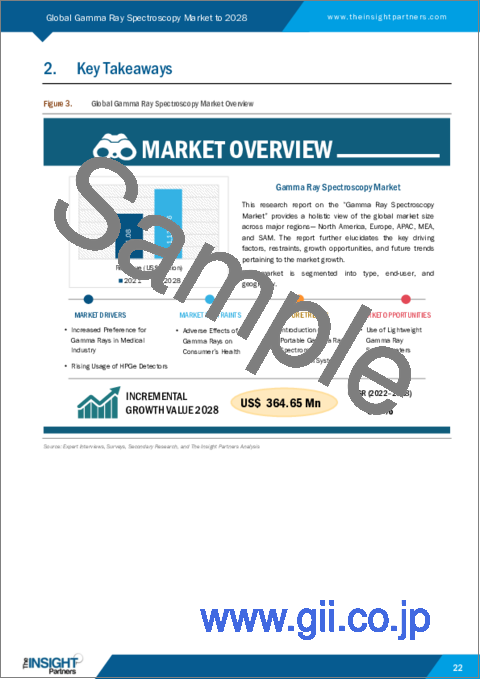
ガンマ線分光法市場は、2022年の7億6561万米ドルから2028年には11億3026万米ドルに成長すると予測されています。2022年から2028年までのCAGRは6.7%と推定される
ガンマ線分光法は、高速かつ非破壊の分析技術であり、試料の複数の放射性同位元素を同定するために使用されます。放射性同位体から発生するガンマ線の測定エネルギーと既知のエネルギーを比較し、放射性同位体の同一性を判断します。ガンマ線分光法は、宇宙研究、原子力施設、鉱物探査などの用途で必要とされています。ガンマ線分光法の市場規模は、組織や癌細胞などの破壊に使用されるため、医療業界における需要の増加により拡大すると予想されます。
ゲルマニウムとシリコンベースの検出器は、ガンマ線検出のための実績あるソリューションであり、ガンマ線検出器の測定能力を向上させました。HPGe検出器は、シリコンと比較してゲルマニウムの放射線に対する効率が高いため、ガンマ線スペクトロスコピーに最適なソリューションの1つと考えられています。これは、ゲルマニウムの原子番号がシリコンよりもはるかに高く、電子と正孔のペアを作るのに必要な平均エネルギー、すなわち2.9eVがシリコンよりも低く、3.6eVであるためです。ゲルマニウムは、厚さが数センチという繊細な物質です。そのため、ガンマ線の全吸収検出器として使用することができます。したがって、HPGe検出器の使用量の増加が、ガンマ線分光法市場の成長に寄与しています。
COVID-19パンデミックがガンマ線分光法市場成長に与える影響
経済協力開発機構(OECD)によると、COVID-19パンデミックは、中国、インド、オーストラリア、日本、およびアジア太平洋地域の他の主要経済国に悪影響を与えました。COVID-19の大流行は、この地域の経済やサプライチェーンに長期にわたって影響を及ぼしました。例えば、2020年の第1四半期と第2四半期には、東アジアの電子機器製造部門(ベトナム、韓国、マレーシア、タイ)は、パンデミックのためにサプライチェーンの混乱に直面しました。2020年の最終四半期には、アジア太平洋地域は宇宙技術と地理空間情報産業に焦点を当て、この分野でガンマ線分光装置が必要とされる事例があっています。例えば、2021年、The Ministry of Financeの年間予算の通り、インドは宇宙省に18億6000万米ドルを割り当て、ロケットの製造、技術移転、宇宙製品の販売などを行っています。このような事例は、ガンマ線分光法の市場規模を高めると思われます。
2021年から2022年にかけて、インドを中心とした原子力産業の成長により、ガンマ線分光装置が高い需要を受けると予想されます。例えば、2021年6月にCAEN S.p.A(電源システムおよびフロントエンド/データのプロバイダー)は、CAEN S.p.A India Private Limitedとしてインド子会社の拡大を発表しました。このような原子力モジュールの開発は、今後数年間のガンマ線分光法市場の拡大に寄与するものと思われます。
米国国立科学財団、米国エネルギー省、メキシコのConsejo Nacional de Ciencia y Tecnologia(CONACYT)は、高高度水チェレンコフ(HAWC)観測所を運営しています。これは高エネルギー電磁波を検出するガンマ線天体物理学施設であり、世界各地にある他のガンマ線観測施設を補完するものでもあります。さらに、この地域には、AMETEK Inc、Mirion Technologies, Inc、Sander Geophysics Limitedなど、著名なガンマ線分光法市場のプレーヤーが存在します。
欧州委員会(EU)は、EUの供給セキュリティ、レジリエンス、半導体ベースの技術およびアプリケーションにおける技術的リーダーシップを確保するために、様々な政策を提案しています。2021年、EUは複数のガンマスペクトロメータを使用してプルトニウムとウランのガンマスペクトルのサンプルを記録し、データ評価のためのプログラムを開発しました。
中国、台湾、韓国などのアジア太平洋諸国は、電子機器や半導体の製造に最も積極的に取り組んでいます。Shenzhen Jiechuangfeng Technology Co., LtdやTaixng Suxig Co., Ltdなどの企業が、ガンマ線分光法市場の有名プレイヤーとして名を連ねています。
中東・アフリカでは、各国が投資や戦略的な取り組みに注力しており、今後数年間はガンマ線スペクトロスコピー装置の需要を促進する可能性があります。例えば、2020年、ビジョン2030の改革課題の一環として、サウジアラビアは宇宙プログラムに21億米ドルを投資する計画を発表しました。このような投資や戦略的イニシアチブは、予測期間中にガンマ線分光法市場を牽引すると予想されます。
さらに、2020年1月には、中南米とカリブ海諸国の15の州規制機関の代表者が集まり、放射線からの保護と安全に関する課題を特定しました。さらに、メンバーは、放射線安全インフラを強化するための具体的なプロジェクト活動を導入することを決定しました。このような活動は、同地域のガンマ線スペクトロスコピー市場を支えるものと期待されています。
CAEN S.p.A.;Mirion Technologies, Inc;AMETEK Inc;Linde PLC;Sander Geophysics Limited;NVIATech instruments;ANTECH;NATS, Inc;Geomatrix Earth Science Ltd;およびATOMTEXは、ガンマ線分光法市場のいくつかのプレーヤーです。市場プレイヤーは、競争力を維持するために有機的および無機的な成長戦略に従っています。例えば、2021年11月、ATOMTEXとLARSA Scientificは、International Laboratory and Analytical Exhibition ArabLABでブースを共有しました。スタンドのゲストは、主に以下の実験装置-AT1320Cガンマ活性モニター、AT1315ガンマベータスペクトロメーター、AT1329サンプルカウンター、フィールドAT6101DRスペクトロメーター、静止エリアモニター-AT2327アラーム線量計に興味を示していました。
ガンマ線分光法の全体的な市場規模は、一次情報と二次情報の両方を使用して導き出されています。調査プロセスを開始するにあたり、ガンマ線スペクトロスコピー市場に関連する質的および量的情報を得るために、内外の情報源を用いて徹底的な二次調査を実施しました。このプロセスは、すべての市場セグメントに関するガンマ線分光法市場規模の概要と予測を得るという目的も兼ねています。また、業界関係者やコメンテーターは、データを検証し、より分析的な洞察を得るために、複数の一次インタビューを実施しています。市場調査に通常参加するのは、ガンマ線分光法市場を専門とする副社長、事業開発マネージャー、市場情報マネージャー、国内販売マネージャー、評価専門家、調査アナリスト、キーオピニオンリーダーなどの外部コンサルタントです。
目次
第1章 イントロダクション
- 調査範囲
- インサイトパートナーズの調査報告書ガイダンス
- 市場セグメンテーション
第2章 重要なポイント
第3章 調査手法
- 対象範囲
- 2次調査
- 1次調査
第4章 ガンマ線分光法市場の情勢
- 市場概要
- PEST分析
- 北米
- 欧州
- アジア太平洋地域
- 中東・アフリカ
- 南米
- エコシステム分析
- 専門家の見解
- 競合ベンチマーキング
第5章 ガンマ線分光法市場- 主要な市場力学
- 市場促進要因
- 医療業界におけるガンマ線に対する嗜好の高まり
- HPGeディテクタの使用率上昇
- 市場抑制要因
- ガンマ線が消費者の健康に与える悪影響
- 市場機会
- 軽量なガンマ線分光計の使用
- 今後の動向
- ポータブルガンマ線分光計の情報システムのイントロダクション
- 促進要因と抑制要因の影響度分析
第6章 ガンマ線分光法市場- 世界分析
- ガンマ線スペクトロスコピーの世界概要
- 市場のポジショニング-主要5社
第7章 ガンマ線分光法市場- タイプ別
- 市場概要
- ガンマ線分光法の市場内訳(タイプ別)(2021年、2028年
- ハードウェア
- ソフトウェア
- サービス
第8章 ガンマ線分光法市場- エンドユーザー別
- ガンマ線分光法市場内訳(エンドユーザー別)(2021年、2028年
- 宇宙調査
- 原子力施設
- 鉱物探査
第9章 ガンマ線分光法市場- 地域別分析
- 北米
- 米国
- カナダ
- メキシコ
- 欧州
- ドイツ
- フランス
- イタリア
- 英国
- ロシア
- その他欧州
- APAC
- 中国
- インド
- 日本
- 韓国
- オーストラリア
- APACのその他諸国
- MEA
- 南アフリカ
- サウジアラビア
- UAE
- MEAの残りの地域
- 南米
- ブラジル
- アルゼンチン
- その他の南米地域
第10章 ガンマ線分光法市場-COVID-19影響度分析
- 北米
- 欧州
- アジア太平洋地域
- 中東とアフリカ
- 南米
第11章 業界の情勢
- マーケットイニシアティブ
- 合併・買収
- 新製品開発
第12章 企業プロファイル
- CAEN S.p.A.
- Mirion Technologies, Inc.
- AMETEK Inc.
- Linde Plc
- Sander Geophysics Limited
- NUVIATech Instruments
- ANTECH
- NATS, Inc.
- Geomatrix Earth Science Ltd
- ATOMTEX
第13章 付録
- The Insight Partners について
- 単語索引
List Of Tables
- Table 1. Gamma Ray Spectroscopy Market - Revenue and Forecast to 2028 (US$ Million)
- Table 2. North America Gamma Ray Spectroscopy Market, Revenue and Forecast To 2028 - By Type (US$ Million)
- Table 3. North America Gamma Ray Spectroscopy Market, Revenue and Forecast To 2028 - By End-User (US$ Million)
- Table 4. North America Gamma Ray Spectroscopy Market, Revenue and Forecast To 2028 - By Country (US$ Million)
- Table 5. US Gamma Ray Spectroscopy Market, Revenue and Forecast to 2028 - By Type (US$ Million)
- Table 6. US Gamma Ray Spectroscopy Market, Revenue and Forecast to 2028 - By End-User (US$ Million)
- Table 7. Canada Gamma Ray Spectroscopy Market, Revenue and Forecast to 2028 - By Type (US$ Million)
- Table 8. Canada Gamma Ray Spectroscopy Market, Revenue and Forecast to 2028 - By End-User (US$ Million)
- Table 9. Mexico Gamma Ray Spectroscopy Market, Revenue and Forecast to 2028 - By Type (US$ Million)
- Table 10. Mexico Gamma Ray Spectroscopy Market, Revenue and Forecast to 2028 - By End-User (US$ Million)
- Table 11. Europe Gamma Ray Spectroscopy Market, Revenue and Forecast To 2028 - By Type (US$ Million)
- Table 12. Europe Gamma Ray Spectroscopy Market, Revenue and Forecast To 2028 - By End-User (US$ Million)
- Table 13. Europe Gamma Ray Spectroscopy Market, Revenue and Forecast To 2028 - By Country (US$ Million)
- Table 14. Germany Gamma Ray Spectroscopy Market, Revenue and Forecast to 2028 - By Type (US$ Million)
- Table 15. Germany Gamma Ray Spectroscopy Market, Revenue and Forecast to 2028 - By End-User (US$ Million)
- Table 16. France Gamma Ray Spectroscopy Market, Revenue and Forecast to 2028 - By Type (US$ Million)
- Table 17. France Gamma Ray Spectroscopy Market, Revenue and Forecast to 2028 - By End-User (US$ Million)
- Table 18. Italy Gamma Ray Spectroscopy Market, Revenue and Forecast to 2028 - By Type (US$ Million)
- Table 19. Italy Gamma Ray Spectroscopy Market, Revenue and Forecast to 2028 - By End-User (US$ Million)
- Table 20. UK Gamma Ray Spectroscopy Market, Revenue and Forecast to 2028 - By Type (US$ Million)
- Table 21. UK Gamma Ray Spectroscopy Market, Revenue and Forecast to 2028 - By End-User (US$ Million)
- Table 22. Russia Gamma Ray Spectroscopy Market, Revenue and Forecast to 2028 - By Type (US$ Million)
- Table 23. Russia Gamma Ray Spectroscopy Market, Revenue and Forecast to 2028 - By End-User (US$ Million)
- Table 24. Rest of Europe Gamma Ray Spectroscopy Market, Revenue and Forecast to 2028 - By Type (US$ Million)
- Table 25. Rest of Europe Gamma Ray Spectroscopy Market, Revenue and Forecast to 2028 - By End-User (US$ Million)
- Table 26. APAC Gamma Ray Spectroscopy Market, Revenue and Forecast To 2028 - By Type (US$ Million)
- Table 27. APAC Gamma Ray Spectroscopy Market, Revenue and Forecast To 2028 - By End-User (US$ Million)
- Table 28. APAC Gamma Ray Spectroscopy Market, Revenue and Forecast To 2028 - By Country (US$ Million)
- Table 29. China Gamma Ray Spectroscopy Market, Revenue and Forecast to 2028 - By Type (US$ Million)
- Table 30. China Gamma Ray Spectroscopy Market, Revenue and Forecast to 2028 - By End-User (US$ Million)
- Table 31. India Gamma Ray Spectroscopy Market, Revenue and Forecast to 2028 - By Type (US$ Million)
- Table 32. India Gamma Ray Spectroscopy Market, Revenue and Forecast to 2028 - By End-User (US$ Million)
- Table 33. Japan Gamma Ray Spectroscopy Market, Revenue and Forecast to 2028 - By Type (US$ Million)
- Table 34. Japan Gamma Ray Spectroscopy Market, Revenue and Forecast to 2028 - By End-User (US$ Million)
- Table 35. South Korea Gamma Ray Spectroscopy Market, Revenue and Forecast to 2028 - By Type (US$ Million)
- Table 36. South Korea Gamma Ray Spectroscopy Market, Revenue and Forecast to 2028 - By End-User (US$ Million)
- Table 37. Australia Gamma Ray Spectroscopy Market, Revenue and Forecast to 2028 - By Type (US$ Million)
- Table 38. Australia Gamma Ray Spectroscopy Market, Revenue and Forecast to 2028 - By End-User (US$ Million)
- Table 39. Rest of APAC Gamma Ray Spectroscopy Market, Revenue and Forecast to 2028 - By Type (US$ Million)
- Table 40. Rest of APAC Gamma Ray Spectroscopy Market, Revenue and Forecast to 2028 - By End-User (US$ Million)
- Table 41. MEA: Gamma Ray Spectroscopy Market- by Type- Revenue and Forecast to 2028 (US$ Million)
- Table 42. MEA: Gamma Ray Spectroscopy Market- by End-User - Revenue and Forecast to 2028 (US$ Million)
- Table 43. MEA: Gamma Ray Spectroscopy Market- by Key Country - Revenue and Forecast to 2028 (US$ Million)
- Table 44. South Africa: Gamma Ray Spectroscopy Market- by Type -Revenue and Forecast to 2028 (US$ Million)
- Table 45. South Africa: Gamma Ray Spectroscopy Market- by End-User -Revenue and Forecast to 2028 (US$ Million)
- Table 46. Saudi Arabia: Gamma Ray Spectroscopy Market- by Type -Revenue and Forecast to 2028 (US$ Million)
- Table 47. Saudi Arabia: Gamma Ray Spectroscopy Market- by End-User -Revenue and Forecast to 2028 (US$ Million)
- Table 48. UAE: Gamma Ray Spectroscopy Market- by Type -Revenue and Forecast to 2028 (US$ Million)
- Table 49. UAE: Gamma Ray Spectroscopy Market - by End-User -Revenue and Forecast to 2028 (US$ Million)
- Table 50. Rest of MEA: Gamma Ray Spectroscopy Market- by Type -Revenue and Forecast to 2028 (US$ Million)
- Table 51. Rest of MEA: Gamma Ray Spectroscopy Market- by End-User -Revenue and Forecast to 2028 (US$ Million)
- Table 52. SAM: Gamma Ray Spectroscopy Market- by Type - Revenue and Forecast to 2028 (US$ Million)
- Table 53. SAM: Gamma Ray Spectroscopy Market- by End-User - Revenue and Forecast to 2028 (US$ Million)
- Table 54. SAM: Gamma Ray Spectroscopy Market- by Key Country - Revenue and Forecast to 2028 (US$ Million)
- Table 55. Brazil: Gamma Ray Spectroscopy Market- by Type -Revenue and Forecast to 2028 (US$ Million)
- Table 56. Brazil: Gamma Ray Spectroscopy Market- by End-User -Revenue and Forecast to 2028 (US$ Million)
- Table 57. Argentina: Gamma Ray Spectroscopy Market- by Type -Revenue and Forecast to 2028 (US$ Million)
- Table 58. Argentina: Gamma Ray Spectroscopy Market- by End-User -Revenue and Forecast to 2028 (US$ Million)
- Table 59. Rest of SAM: Gamma Ray Spectroscopy Market- by Type-Revenue and Forecast to 2028 (US$ Million)
- Table 60. Rest of SAM: Gamma Ray Spectroscopy Market- by End-User -Revenue and Forecast to 2028 (US$ Million)
- Table 61. List of Abbreviation
List Of Figures
- Figure 1. Gamma Ray Spectroscopy Market Segmentation
- Figure 2. Gamma Ray Spectroscopy Market Segmentation - By Geography
- Figure 3. Global Gamma Ray Spectroscopy Market Overview
- Figure 4. Hardware Segment held the largest share in 2021
- Figure 5. Nuclear Facilities Segment held the largest share in 2021
- Figure 6. North America held the largest share in 2021
- Figure 7. North America: PEST Analysis
- Figure 8. Europe: PEST Analysis
- Figure 9. Asia Pacific: PEST Analysis
- Figure 10. Middle East & Africa: PEST Analysis
- Figure 11. South America: PEST Analysis
- Figure 12. Gamma Ray Spectroscopy Market - Ecosystem Analysis
- Figure 13. Expert Opinion
- Figure 14. Impact Analysis of Drivers and Restraints
- Figure 15. Gamma Ray Spectroscopy Market - Geographic Analysis
- Figure 16. Gamma Ray Spectroscopy Market Revenue and Forecast to 2028 (US$ Million)
- Figure 17. Gamma Ray Spectroscopy Market Breakdown, By Type (2021 and 2028)
- Figure 18. Hardware: Gamma Ray Spectroscopy Market Revenue and Forecast to 2028 (US$ Million)
- Figure 19. Software: Gamma Ray Spectroscopy Market Revenue and Forecast to 2028 (US$ Million)
- Figure 20. Services: Gamma Ray Spectroscopy Market Revenue and Forecast to 2028 (US$ Million)
- Figure 21. Gamma Ray Spectroscopy Market Breakdown, By End-User (2021 and 2028)
- Figure 22. Space Research: Gamma Ray Spectroscopy Market Revenue and Forecast to 2028 (US$ Million)
- Figure 23. Nuclear Facilities: Gamma Ray Spectroscopy Market Revenue and Forecast to 2028 (US$ Million)
- Figure 24. Mineral Exploration: Gamma Ray Spectroscopy Market Revenue and Forecast to 2028 (US$ Million)
- Figure 25. Gamma Ray Spectroscopy Market Revenue Share, By Region (2021 and 2028)
- Figure 26. North America Gamma Ray Spectroscopy Market, Revenue and Forecast to 2028 (US$ Million)
- Figure 27. North America Gamma Ray Spectroscopy Market Breakdown, By Type, 2021 & 2028 (%)
- Figure 28. North America Gamma Ray Spectroscopy Market Breakdown, By End-User, 2021 & 2028 (%)
- Figure 29. North America Gamma Ray Spectroscopy Market Breakdown, by Country, 2021 & 2028 (%)
- Figure 30. US Gamma Ray Spectroscopy Market, Revenue and Forecast to 2028 (US$ Million)
- Figure 31. Canada Gamma Ray Spectroscopy Market, Revenue and Forecast to 2028 (US$ Million)
- Figure 32. Mexico Gamma Ray Spectroscopy Market, Revenue and Forecast to 2028 (US$ Million)
- Figure 33. Europe Gamma Ray Spectroscopy Market, Revenue and Forecast To 2028 (US$ Million)
- Figure 34. Europe Gamma Ray Spectroscopy Market Breakdown, By Type, 2021 & 2028 (%)
- Figure 35. Europe Gamma Ray Spectroscopy Market Breakdown, By End-User, 2021 & 2028 (%)
- Figure 36. Europe Gamma Ray Spectroscopy Market Breakdown, by Country, 2021 & 2028(%)
- Figure 37. Germany Gamma Ray Spectroscopy Market, Revenue and Forecast to 2028 (US$ Million)
- Figure 38. France Gamma Ray Spectroscopy Market, Revenue and Forecast to 2028 (US$ Million)
- Figure 39. Italy Gamma Ray Spectroscopy Market, Revenue and Forecast to 2028 (US$ Million)
- Figure 40. UK Gamma Ray Spectroscopy Market, Revenue and Forecast to 2028 (US$ Million)
- Figure 41. Russia Gamma Ray Spectroscopy Market, Revenue and Forecast to 2028 (US$ Million)
- Figure 42. Rest of Europe Gamma Ray Spectroscopy Market, Revenue and Forecast to 2028 (US$ Million)
- Figure 43. APAC Gamma Ray Spectroscopy Market, Revenue and Forecast To 2028 (US$ Million)
- Figure 44. APAC Gamma Ray Spectroscopy Market Breakdown, By Type, 2021 & 2028 (%)
- Figure 45. APAC Gamma Ray Spectroscopy Market Breakdown, By End-User, 2021 & 2028 (%)
- Figure 46. APAC Gamma Ray Spectroscopy Market Breakdown, by Country, 2021 & 2028 (%)
- Figure 47. China Gamma Ray Spectroscopy Market, Revenue and Forecast To 2028 (US$ Million)
- Figure 48. India Gamma Ray Spectroscopy Market, Revenue and Forecast To 2028 (US$ Million)
- Figure 49. Japan Gamma Ray Spectroscopy Market, Revenue and Forecast To 2028 (US$ Million)
- Figure 50. South Korea Gamma Ray Spectroscopy Market, Revenue and Forecast To 2028 (US$ Million)
- Figure 51. Australia Gamma Ray Spectroscopy Market, Revenue and Forecast To 2028 (US$ Million)
- Figure 52. Rest of APAC Gamma Ray Spectroscopy Market, Revenue and Forecast To 2028 (US$ Million)
- Figure 53. MEA: Gamma Ray Spectroscopy Market - Revenue and Forecast to 2028 (US$ Million)
- Figure 54. MEA: Gamma Ray Spectroscopy Market Revenue Share, By Type (2021 and 2028)
- Figure 55. MEA: Gamma Ray Spectroscopy Market Revenue Share, By End-User (2021 and 2028)
- Figure 56. MEA: Gamma Ray Spectroscopy Market Revenue Share, By Key Country (2021 and 2028)
- Figure 57. South Africa: Gamma Ray Spectroscopy Market - Revenue and Forecast to 2028 (US$ Million)
- Figure 58. Saudi Arabia: Gamma Ray Spectroscopy Market - Revenue and Forecast to 2028 (US$ Million)
- Figure 59. UAE: Gamma Ray Spectroscopy Market - Revenue and Forecast to 2028 (US$ Million)
- Figure 60. Rest of MEA: Gamma Ray Spectroscopy Market - Revenue and Forecast to 2028 (US$ Million)
- Figure 61. SAM: Gamma Ray Spectroscopy Market - Revenue and Forecast to 2028 (US$ Million)
- Figure 62. SAM: Gamma Ray Spectroscopy Market Revenue Share, By Type (2021 and 2028)
- Figure 63. SAM: Gamma Ray Spectroscopy Market Revenue Share, By End-User (2021 and 2028)
- Figure 64. SAM: Gamma Ray Spectroscopy Market Revenue Share, By Key Country (2021 and 2028)
- Figure 65. Brazil: Gamma Ray Spectroscopy Market - Revenue and Forecast to 2028 (US$ Million)
- Figure 66. Argentina: Gamma Ray Spectroscopy Market - Revenue and Forecast to 2028 (US$ Million)
- Figure 67. Rest of SAM: Gamma Ray Spectroscopy Market - Revenue and Forecast to 2028 (US$ Million)
- Figure 68. Impact of COVID-19 Pandemic in North American Country Markets
- Figure 69. Impact of COVID-19 Pandemic in Europe Country Markets
- Figure 70. Impact of COVID-19 Pandemic in Asia Pacific Country Markets
- Figure 71. Impact of COVID-19 Pandemic in Middle East and Africa Country Markets
- Figure 72. Impact of COVID-19 Pandemic in South America Country Markets
The gamma ray spectroscopy market is expected to grow from US$ 765.61 million in 2022 to US$ 1,130.26 million by 2028. It is estimated to grow at a CAGR of 6.7% from 2022 to 2028
Gamma ray spectroscopy is a fast and nondestructive analytical technique that is used to identify several radioactive isotopes of the sample. The measured energy and known energy of gamma rays, which are produced by radioisotopes, are compared to determine the identity of an emitter. Gamma ray spectroscopy is required in applications such as space research, nuclear facilities, and mineral exploration. The gamma ray spectroscopy market size is expected to grow due to its increased demand in the medical industry as the technique is used to destroy tissues, and cancerous cells, among others.
Germanium and silicon-based detectors are a proven solution for gamma ray detection and have improved the measurement capability of gamma ray detectors. The HPGe detectors are considered one of the best solutions for gamma ray spectroscopy due to germanium's high efficiency for radiation compared to silicon. This is because germanium's atomic number is much higher than silicon and its average energy, i.e., 2.9 eV, which is necessary to create an electron-hole pair, is lower than silicon, i.e., 3.6 eV. Germanium has a sensitive thickness of centimeters. Thus, it can be used as a total absorption detector for gamma rays. Hence, the increased usage of HPGe detectors is contributing to the gamma ray spectroscopy market growth.
Impact of COVID-19 Pandemic on Gamma Ray Spectroscopy Market Growth
According to the Organization for Economic Co-operation and Development (OECD), the COVID-19 pandemic adversely affected China, India, Australia, Japan, and other major economies in Asia Pacific. The COVID-19 pandemic had prolonged effects on the region's economy and supply chains. For instance, in Q1 and Q2 of 2020, The East Asian electronic manufacturing units-Vietnam, South Korea, Malaysia, and Thailand-faced supply chain disruption due to the pandemic. In the last quarter of 2020, Asian Pacific focused on space technology and the geospatial information industry, as there were instances where gamma-ray spectroscopy devices were in demand in this sector. For example, in 2021, as per The Ministry of Finance's annual budget, India allocated US$ 1.86 billion to the Department of Space to produce the launch vehicle, transfer technologies, and market space products. Such instances are likely to enhance the gamma ray spectroscopy market size.
In 2022, gamma-ray spectroscopy devices are expected to receive high demand from the growing nuclear energy industry, especially in India, from 2021 to 2022. For instance, in June 2021, CAEN S.p.A (a provider of the power supply systems and front-end/data) announced the expansion of its Indian subsidiary as CAEN S.p.A India Private Limited. Such developments in nuclear modules are likely to contribute to the expansion of the gamma ray spectroscopy market in the coming years.
The US National Science Foundation, the US Department of Energy, and Consejo Nacional de Ciencia y Tecnologia (CONACYT), Mexico, are operating a High-Altitude Water Cherenkov (HAWC) observatory. It is a gamma ray astrophysics facility to detect high-energy electromagnetic radiation, and it also complements several other observatories for gamma rays around the world. Further, the region has the presence of several prominent gamma ray spectroscopy market players, including AMETEK Inc; Mirion Technologies, Inc.; and Sander Geophysics Limited.
The European Commission (EU) has proposed various policies to ensure the EU's supply security, resilience, and technological leadership in semiconductor-based technologies and applications. In 2021, the EU recorded samples of gamma spectra of plutonium and uranium using several gamma spectrometers to develop programs for data evaluation.
Asia Pacific countries, such as China, Taiwan, and South Korea, are most actively involved in manufacturing electronics and semiconductors. Companies, such as Shenzhen Jiechuangfeng Technology Co., Ltd and Taixng Suxig Co., Ltd., are among the well-recognized gamma ray spectroscopy market players.
In the Middle East and Africa, the countries are focusing on investments and strategic initiatives that are likely to drive demand for gamma-ray spectroscopy devices over the next few years. For instance, in 2020, as a part of the Vision 2030 reform agenda, Saudi Arabia announced its plan to invest US$ 2.1 Bn in the space program. Such investments and strategic initiatives are anticipated to drive the gamma ray spectroscopy market during the forecast period.
Further, in January 2020, the representatives of South & Central America and the Caribbean's 15-member state regulatory bodies met to identify the challenges concerning protection and safety from radiation. Further, the members decided to introduce concrete project activities to strengthen the radiation safety infrastructure. Such activities are expected to support the gamma ray spectroscopy market in the region.
CAEN S.p.A.; Mirion Technologies, Inc.; AMETEK Inc; Linde PLC; Sander Geophysics Limited; NVIATech instruments; ANTECH; NATS, Inc.; Geomatrix Earth Science Ltd; and ATOMTEX are a few gamma ray spectroscopy market players. The market players are following organic and inorganic growth strategies to sustain the competitive edge. For instance, in November 2021, ATOMTEX and LARSA Scientific shared a stand at the International Laboratory and Analytical Exhibition ArabLAB. Guests of the stand were mostly interested in the following laboratory equipment - AT1320C Gamma Activity Monitor, AT1315 Gamma Beta Spectrometer, AT1329 Sample Counter, field AT6101DR Spectrometer, and stationary area monitors - AT2327 Alarm Dosimeter.
The overall size of the gamma ray spectroscopy market has been derived using both primary and secondary sources. To begin the research process, exhaustive secondary research has been conducted using internal and external sources to obtain qualitative and quantitative information related to the gamma ray spectroscopy market. The process also serves the purpose of obtaining an overview and forecast of the gamma ray spectroscopy market size with respect to all market segments. Also, industry participants and commentators have conducted multiple primary interviews to validate the data and gain more analytical insights. Participants typically involved in the market study include VPs, business development managers, market intelligence managers, national sales managers, external consultants, such as valuation experts, research analysts, and key opinion leaders, specializing in the gamma ray spectroscopy market.
Reasons to Buy:
Save and reduce time carrying out entry-level research by identifying the growth, size, leading players, and segments in the global gamma ray spectroscopy market
Highlights key business priorities in order to assist companies to realign their business strategies
The key findings and recommendations highlight crucial progressive industry trends in the global gamma ray spectroscopy market, thereby allowing players across the value chain to develop effective long-term strategies
Develop/modify business expansion plans by using substantial growth offering developed and emerging markets
Scrutinize in-depth regional market trends and outlook coupled with the factors driving the market, as well as those hindering it
Enhance the decision-making process by understanding the strategies that underpin commercial interest with respect to client products, segmentation, pricing, and distribution
Table Of Contents
1. Introduction
- 1.1 Study Scope
- 1.2 The Insight Partners Research Report Guidance
- 1.3 Market Segmentation
2. Key Takeaways
3. Research Methodology
- 3.1 Coverage
- 3.2 Secondary Research
- 3.3 Primary Research
4. Gamma Ray Spectroscopy Market Landscape
- 4.1 Market Overview
- 4.2 PEST Analysis
- 4.2.1 North America
- 4.2.2 Europe
- 4.2.3 Asia Pacific
- 4.2.4 Middle East & Africa
- 4.2.5 South America
- 4.3 Ecosystem Analysis
- 4.4 Expert Opinion
- 4.5 Competitive Benchmarking
5. Gamma Ray Spectroscopy Market - Key Market Dynamics
- 5.1 Market Drivers
- 5.1.1 Increased Preference for Gamma Rays in Medical Industry
- 5.1.2 Rising Usage of HPGe Detectors
- 5.2 Market Restraints
- 5.2.1 Adverse Effects of Gamma Rays on Consumer's Health
- 5.3 Market Opportunities
- 5.3.1 Use of Lightweight Gamma Ray Spectrometers
- 5.4 Future Trends
- 5.4.1 Introduction of Portable Gamma Ray Spectrometer Information System
- 5.5 Impact Analysis of Drivers and Restraints
6. Gamma Ray Spectroscopy Market - Global Analysis
- 6.1 Gamma Ray Spectroscopy Global Overview
- 6.2 Gamma Ray Spectroscopy Market Revenue and Forecast to 2028 (US$ Million)
- 6.3 Market Positioning - Five Key Players
7. Gamma Ray Spectroscopy Market - Type
- 7.1 Overview
- 7.2 Gamma Ray Spectroscopy Market Breakdown, By Type (2021 and 2028)
- 7.3 Hardware
- 7.3.1 Overview
- 7.3.2 Hardware: Gamma Ray Spectroscopy Market Revenue and Forecast to 2028 (US$ Million)
- 7.4 Software
- 7.4.1 Overview
- 7.4.2 Software: Gamma Ray Spectroscopy Market Revenue and Forecast to 2028 (US$ Million)
- 7.5 Services
- 7.5.1 Overview
- 7.5.2 Services: Gamma Ray Spectroscopy Market Revenue and Forecast to 2028 (US$ Million)
8. Gamma Ray Spectroscopy Market - By End-User
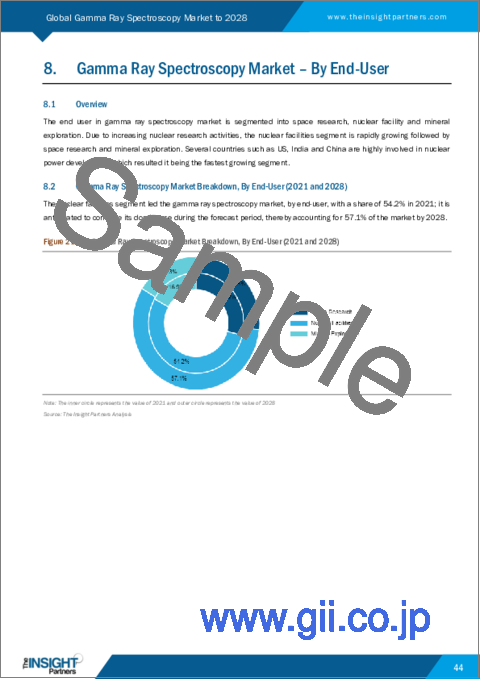
- 8.1 Overview
- 8.2 Gamma Ray Spectroscopy Market Breakdown, By End-User (2021 and 2028)
- 8.3 Space Research
- 8.3.1 Overview
- 8.3.2 Space Research: Gamma Ray Spectroscopy Market Revenue and Forecast to 2028 (US$ Million)
- 8.4 Nuclear Facilities
- 8.4.1 Overview
- 8.4.2 Nuclear Facilities: Gamma Ray Spectroscopy Market Revenue and Forecast to 2028 (US$ Million)
- 8.5 Mineral Exploration
- 8.5.1 Overview
- 8.5.2 Mineral Exploration: Gamma Ray Spectroscopy Market Revenue and Forecast to 2028 (US$ Million)
9. Gamma Ray Spectroscopy Market - Geographic Analysis
- 9.1 Overview
- 9.2 North America: Gamma Ray Spectroscopy Market
- 9.2.1 Overview
- 9.2.2 North America Gamma Ray Spectroscopy Market, Revenue and Forecast to 2028 (US$ Million)
- 9.2.3 North America Gamma Ray Spectroscopy Market Breakdown, By Type
- 9.2.4 North America Gamma Ray Spectroscopy Market Breakdown, By End-User
- 9.2.5 North America Gamma Ray Spectroscopy Market Breakdown, by Country
- 9.2.5.1 US Gamma Ray Spectroscopy Market, Revenue and Forecast to 2028
- 9.2.5.1.1 US Gamma Ray Spectroscopy Market Breakdown, By Type
- 9.2.5.1.2 US Gamma Ray Spectroscopy Market Breakdown, By End-User
- 9.2.5.2 Canada Gamma Ray Spectroscopy Market, Revenue and Forecast to 2028
- 9.2.5.2.1 Canada Gamma Ray Spectroscopy Market Breakdown, By Type
- 9.2.5.2.2 Canada Gamma Ray Spectroscopy Market Breakdown, By End-User
- 9.2.5.3 Mexico Gamma Ray Spectroscopy Market, Revenue and Forecast to 2028
- 9.2.5.3.1 Mexico Gamma Ray Spectroscopy Market Breakdown, By Type
- 9.2.5.3.2 Mexico Gamma Ray Spectroscopy Market Breakdown, By End-User
- 9.2.5.1 US Gamma Ray Spectroscopy Market, Revenue and Forecast to 2028
- 9.3 Europe: Gamma Ray Spectroscopy Market
- 9.3.1 Overview
- 9.3.2 Europe: Gamma Ray Spectroscopy Market Revenue and Forecast to 2028 (US$ Million)
- 9.3.3 Europe Gamma Ray Spectroscopy Market Breakdown, By Type
- 9.3.4 Europe Gamma Ray Spectroscopy Market Breakdown, By End-User
- 9.3.5 Europe Gamma Ray Spectroscopy Market Breakdown, by Country
- 9.3.5.1 Germany Gamma Ray Spectroscopy Market, Revenue and Forecast to 2028
- 9.3.5.1.1 Germany Gamma Ray Spectroscopy Market Breakdown, By Type
- 9.3.5.1.2 Germany Gamma Ray Spectroscopy Market Breakdown, By End-User
- 9.3.5.2 France Gamma Ray Spectroscopy Market, Revenue and Forecast to 2028
- 9.3.5.2.1 France Gamma Ray Spectroscopy Market Breakdown, By Type
- 9.3.5.2.2 France Gamma Ray Spectroscopy Market Breakdown, By End-User
- 9.3.5.3 Italy Gamma Ray Spectroscopy Market, Revenue and Forecast to 2028
- 9.3.5.3.1 Italy Gamma Ray Spectroscopy Market Breakdown, By Type
- 9.3.5.3.2 Italy Gamma Ray Spectroscopy Market Breakdown, By End-User
- 9.3.5.4 UK Gamma Ray Spectroscopy Market, Revenue and Forecast to 2028
- 9.3.5.4.1 UK Gamma Ray Spectroscopy Market Breakdown, By Type
- 9.3.5.4.2 UK Gamma Ray Spectroscopy Market Breakdown, By End-User
- 9.3.5.5 Russia Gamma Ray Spectroscopy Market, Revenue and Forecast to 2028
- 9.3.5.5.1 Russia Gamma Ray Spectroscopy Market Breakdown, By Type
- 9.3.5.5.2 Russia Gamma Ray Spectroscopy Market Breakdown, By End-User
- 9.3.5.6 Rest of Europe Gamma Ray Spectroscopy Market, Revenue and Forecast to 2028
- 9.3.5.6.1 Rest of Europe Gamma Ray Spectroscopy Market Breakdown, By Type
- 9.3.5.6.2 Rest of Europe Gamma Ray Spectroscopy Market Breakdown, By End-User
- 9.3.5.1 Germany Gamma Ray Spectroscopy Market, Revenue and Forecast to 2028
- 9.4 APAC: Gamma Ray Spectroscopy Market
- 9.4.1 Overview
- 9.4.2 APAC Gamma Ray Spectroscopy Market, Revenue and Forecast to 2028 (US$ Million)
- 9.4.3 APAC Gamma Ray Spectroscopy Market Breakdown, By Type
- 9.4.4 APAC Gamma Ray Spectroscopy Market Breakdown, By End-User
- 9.4.5 APAC Gamma Ray Spectroscopy Market Breakdown, by Country
- 9.4.5.1 China Gamma Ray Spectroscopy Market, Revenue and Forecast to 2028 (US$ Million)
- 9.4.5.1.1 China Gamma Ray Spectroscopy Market Breakdown, By Type
- 9.4.5.1.2 China Gamma Ray Spectroscopy Market Breakdown, By End-User
- 9.4.5.2 India Gamma Ray Spectroscopy Market, Revenue and Forecast to 2028 (US$ Million)
- 9.4.5.2.1 India Gamma Ray Spectroscopy Market Breakdown, By Type
- 9.4.5.2.2 India Gamma Ray Spectroscopy Market Breakdown, By End-User
- 9.4.5.3 Japan Gamma Ray Spectroscopy Market, Revenue and Forecast to 2028 (US$ Million)
- 9.4.5.3.1 Japan Gamma Ray Spectroscopy Market Breakdown, By Type
- 9.4.5.3.2 Japan Gamma Ray Spectroscopy Market Breakdown, By End-User
- 9.4.5.4 South Korea Gamma Ray Spectroscopy Market, Revenue and Forecast to 2028 (US$ Million)
- 9.4.5.4.1 South Korea Gamma Ray Spectroscopy Market Breakdown, By Type
- 9.4.5.4.2 South Korea Gamma Ray Spectroscopy Market Breakdown, By End-User
- 9.4.5.5 Australia Gamma Ray Spectroscopy Market, Revenue and Forecast to 2028 (US$ Million)
- 9.4.5.5.1 Australia Gamma Ray Spectroscopy Market Breakdown, By Type
- 9.4.5.5.2 Australia Gamma Ray Spectroscopy Market Breakdown, By End-User
- 9.4.5.6 Rest of APAC Gamma Ray Spectroscopy Market, Revenue and Forecast to 2028 (US$ Million)
- 9.4.5.6.1 Rest of APAC Gamma Ray Spectroscopy Market Breakdown, By Type
- 9.4.5.6.2 Rest of APAC Gamma Ray Spectroscopy Market Breakdown, By End-User
- 9.4.5.1 China Gamma Ray Spectroscopy Market, Revenue and Forecast to 2028 (US$ Million)
- 9.5 MEA: Gamma Ray Spectroscopy Market
- 9.5.1 MEA: Gamma Ray Spectroscopy Market - Revenue and Forecast to 2028 (US$ Million)
- 9.5.2 MEA: Gamma Ray Spectroscopy Market- by Type
- 9.5.3 MEA: Gamma Ray Spectroscopy Market- by End-User
- 9.5.4 MEA: Gamma Ray Spectroscopy Market- by Key Country
- 9.5.4.1 South Africa: Gamma Ray Spectroscopy Market - Revenue and Forecast to 2028 (US$ Million)
- 9.5.4.1.1 South Africa: Gamma Ray Spectroscopy Market- by Type
- 9.5.4.1.2 South Africa: Gamma Ray Spectroscopy Market- by End-User
- 9.5.4.2 Saudi Arabia: Gamma Ray Spectroscopy Market - Revenue and Forecast to 2028 (US$ Million)
- 9.5.4.2.1 Saudi Arabia: Gamma Ray Spectroscopy Market- by Type
- 9.5.4.2.2 Saudi Arabia: Gamma Ray Spectroscopy Market- by End-User
- 9.5.4.3 UAE: Gamma Ray Spectroscopy Market - Revenue and Forecast to 2028 (US$ Million)
- 9.5.4.3.1 UAE: Gamma Ray Spectroscopy Market- by Type
- 9.5.4.3.2 UAE: Gamma Ray Spectroscopy Market - by End-User
- 9.5.4.4 Rest of MEA: Gamma Ray Spectroscopy Market - Revenue and Forecast to 2028 (US$ Million)
- 9.5.4.4.1 Rest of MEA: Gamma Ray Spectroscopy Market- by Type
- 9.5.4.4.2 Rest of MEA: Gamma Ray Spectroscopy Market- by End-User
- 9.5.4.1 South Africa: Gamma Ray Spectroscopy Market - Revenue and Forecast to 2028 (US$ Million)
- 9.6 SAM: Gamma Ray Spectroscopy Market
- 9.6.1 SAM: Gamma Ray Spectroscopy Market - Revenue and Forecast to 2028 (US$ Million)
- 9.6.2 SAM: Gamma Ray Spectroscopy Market- by Type
- 9.6.3 SAM: Gamma Ray Spectroscopy Market- by End-User
- 9.6.4 SAM: Gamma Ray Spectroscopy Market- by Key Country
- 9.6.4.1 Brazil: Gamma Ray Spectroscopy Market - Revenue and Forecast to 2028 (US$ Million)
- 9.6.4.1.1 Brazil: Gamma Ray Spectroscopy Market- by Type
- 9.6.4.1.2 Brazil: Gamma Ray Spectroscopy Market- by End-User
- 9.6.4.2 Argentina: Gamma Ray Spectroscopy Market - Revenue and Forecast to 2028 (US$ Million)
- 9.6.4.2.1 Argentina: Gamma Ray Spectroscopy Market- by Type
- 9.6.4.2.2 Argentina: Gamma Ray Spectroscopy Market- by End-User
- 9.6.4.3 Rest of SAM: Gamma Ray Spectroscopy Market - Revenue and Forecast to 2028 (US$ Million)
- 9.6.4.3.1 Rest of SAM: Gamma Ray Spectroscopy Market- by Type
- 9.6.4.3.2 Rest of SAM: Gamma Ray Spectroscopy Market- by End-User
- 9.6.4.1 Brazil: Gamma Ray Spectroscopy Market - Revenue and Forecast to 2028 (US$ Million)
10. Gamma Ray Spectroscopy Market- COVID-19 Impact Analysis
- 10.1 Overview
- 10.2 North America
- 10.3 Europe
- 10.4 Asia-Pacific
- 10.5 Middle East and Africa
- 10.6 South America
11. Industry Landscape
- 11.1 Overview
- 11.2 Market Initiative
- 11.3 Merger and Acquisition
- 11.4 New Product Development
12. Company Profiles
- 12.1 CAEN S.p.A.
- 12.1.1 Key Facts
- 12.1.2 Business Description
- 12.1.3 Products and Services
- 12.1.4 Financial Overview
- 12.1.5 SWOT Analysis
- 12.1.6 Key Developments
- 12.2 Mirion Technologies, Inc.
- 12.2.1 Key Facts
- 12.2.2 Business Description
- 12.2.3 Products and Services
- 12.2.4 Financial Overview
- 12.2.5 SWOT Analysis
- 12.2.6 Key Developments
- 12.3 AMETEK Inc.
- 12.3.1 Key Facts
- 12.3.2 Business Description
- 12.3.3 Products and Services (Offerings of AMETEK, Inc.)
- 12.3.4 Products and Services (Offerings of Amptek -a subsidiary of AMETEK, Inc.)
- 12.3.5 Financial Overview
- 12.3.6 SWOT Analysis
- 12.3.7 Key Developments
- 12.4 Linde Plc
- 12.4.1 Key Facts
- 12.4.2 Business Description
- 12.4.3 Products and Services
- 12.4.4 Financial Overview
- 12.4.5 SWOT Analysis
- 12.4.6 Key Developments
- 12.5 Sander Geophysics Limited
- 12.5.1 Key Facts
- 12.5.2 Business Description
- 12.5.3 Products and Services
- 12.5.4 Financial Overview
- 12.5.5 SWOT Analysis
- 12.5.6 Key Developments
- 12.6 NUVIATech Instruments
- 12.6.1 Key Facts
- 12.6.2 Business Description
- 12.6.3 Products and Services
- 12.6.4 Financial Overview
- 12.6.5 SWOT Analysis
- 12.6.6 Key Developments
- 12.7 ANTECH
- 12.7.1 Key Facts
- 12.7.2 Business Description
- 12.7.3 Products and Services
- 12.7.4 Financial Overview
- 12.7.5 SWOT Analysis
- 12.7.6 Key Developments
- 12.8 NATS, Inc.
- 12.8.1 Key Facts
- 12.8.2 Business Description
- 12.8.3 Products and Services
- 12.8.4 Financial Overview
- 12.8.5 SWOT Analysis
- 12.8.6 Key Developments
- 12.9 Geomatrix Earth Science Ltd
- 12.9.1 Key Facts
- 12.9.2 Business Description
- 12.9.3 Products and Services
- 12.9.4 Financial Overview
- 12.9.5 SWOT Analysis
- 12.9.6 Key Developments
- 12.10 ATOMTEX
- 12.10.1 Key Facts
- 12.10.2 Business Description
- 12.10.3 Products and Services
- 12.10.4 Financial Overview
- 12.10.5 SWOT Analysis
- 12.10.6 Key Developments
13. Appendix
- 13.1 About The Insight Partners
- 13.2 Word Index