|
|
市場調査レポート
商品コード
1470317
モバイル3Dの世界市場機会と戦略(~2033年)Mobile 3D Global Market Opportunities And Strategies To 2033 |
||||||

|
|||||||
カスタマイズ可能
|
|||||||


| モバイル3Dの世界市場機会と戦略(~2033年) |
|
出版日: 2024年04月16日
発行: The Business Research Company
ページ情報: 英文 291 Pages
納期: 2~3営業日
|

全表示
- 概要
- 目次
世界のモバイル3Dの市場規模は、2018年に108億24万米ドルとなり、2023年までCAGR23.0%超で成長しました。
農村部と都市部におけるインターネット普及率の増加
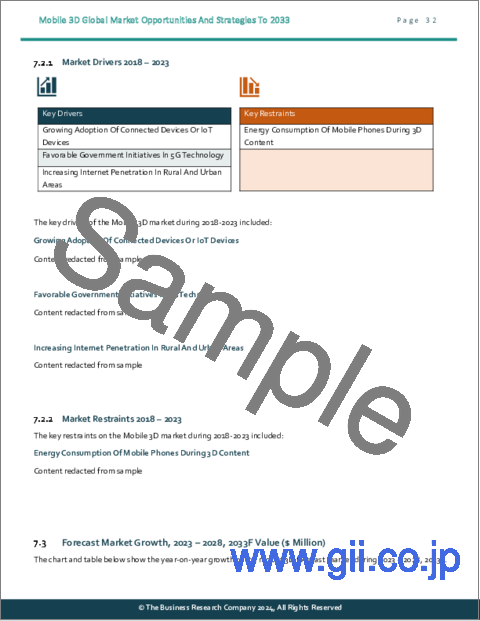
農村部と都市部におけるインターネット普及率の増加がモバイル3D市場の成長を後押ししました。インターネット利用の普及により、モバイル機器向けの3Dゲームやアプリケーションを含むオンラインコンテンツの利用可能性が大幅に拡大しました。より多くの人々がインターネットユーザーとなり、モバイル機器で3D素材に触れ、交流できるようになりました。これらのプラットフォームは、消費者がモバイル3Dアプリを簡単に見つけ、ダウンロードし、インストールできる集中市場として機能し、市場の拡大を促進しています。例えば、シンガポールを拠点とするオンライン・リファレンス・ライブラリーであるDataReportalによると、2022年10月、世界中で合計50億7,000万人がインターネットを利用しており、これは世界総人口の63.5%に相当します。インターネットユーザーも増え続けており、過去12ヶ月で世界の接続人口は1億7,000万人以上増加したとのデータもあります。さらに、インドの金融日刊紙Livemintによると、2022年7月には、インドの農村部の3億5,100万人と都市部の3億4,100万人を含む合計6億9,200万人のアクティブ・インターネットユーザーがインドにいたとのことです。同レポートは、2025年までにインドのインターネットユーザーは9億人になると予測しています。従って、農村部と都市部におけるインターネット普及率の増加が、過去期間におけるモバイル3D市場を牽引しました。
目次
第1章 エグゼクティブサマリー
- モバイル3D-市場の魅力とマクロ経済情勢
第2章 目次
第3章 見出し一覧
第4章 図表一覧
第5章 レポートの構成
第6章 市場の特徴
- 一般的な市場の定義
- 概要
- モバイル3D市場の定義とセグメンテーション
- 市場セグメンテーション:タイプ別
- タブレット
- スマートフォン
- ノートブック
- その他のタイプ
- 市場セグメンテーション:デバイスコンポーネント別
- イメージセンサー
- 3Dディスプレイ
- 市場セグメンテーション:用途別
- アニメーション
- 地図とナビゲーション
- モバイルゲーム
- モバイル広告
- その他の用途
第7章 主要な市場動向
- モバイルスキャナと3Dライトフィールド製品に重点を置いた革新的な製品
- 市場におけるイノベーションを推進するための市場企業間の戦略的パートナーシップとコラボレーション
- 視覚体験のための人工知能(AI)対応デバイスの使用
- 3Dゲーム制作を向上させるAI搭載プラットフォームの開発増加
第8章 モバイル3D市場- マクロ経済シナリオ
- COVID-19によるモバイル3D市場への影響
- ウクライナ戦争がモバイル3D市場に与える影響
- 高インフレがモバイル3D市場に与える影響
第9章 世界の市場規模と成長
- 市場規模
- 市場成長実績(2018年~2023年)
- 市場促進要因(2018年~2023年)
- 市場抑制要因(2018年~2023年)
- 市場成長予測(2023年~2028年、2033年)
- 市場促進要因(2023年~2028年)
- 市場抑制要因(2023年~2028年)
第10章 世界のモバイル3D市場セグメンテーション
- 世界のモバイル3D市場:タイプ別、実績と予測(2018年~2023年、2028年、2033年)
- 世界のモバイル3D市場:デバイスコンポーネント別、実績と予測(2018年~2023年、2028年、2033年)
- 世界のモバイル3D市場:用途別、実績と予測(2018年~2023年、2028年、2033年)
第11章 モバイル3D市場:地域別および国別の分析
- 世界のモバイル3D市場:地域別、実績と予測(2018年~2023年、2028年、2033年)
- 世界のモバイル3D市場:国別、実績と予測(2018年~2023年、2028年、2033年)
第12章 アジア太平洋市場
第13章 西欧市場
第14章 東欧市場
第15章 北米市場
第16章 南米市場
第17章 中東市場
第18章 アフリカ市場
第19章 競合情勢と企業プロファイル
- 企業プロファイル
- Samsung Electronics Co Ltd
- 会社概要
- 製品とサービス
- ビジネス戦略
- 財務概要
- Apple Inc
- 会社概要
- 製品とサービス
- ビジネス戦略
- 財務実績
- Qualcomm Incorporated
- 会社概要
- 製品とサービス
- ビジネス戦略
- 財務概要
- Nvidia Corporation
- 会社概要
- 製品とサービス
- ビジネス戦略
- 財務概要
- Microsoft Corporation
- 会社概要
- 製品とサービス
- ビジネス戦略
- 財務概要
- Leia Inc
- 会社概要
- 製品とサービス
- ビジネス戦略
- 財務概要
第20章 その他の大手企業と革新的企業
- Lenovo Group Ltd
- 会社概要
- 製品とサービス
- ビジネス戦略
- Sony Group Corporation
- 会社概要
- 製品とサービス
- ZTE Corporation
- 会社概要
- 製品とサービス
- ビジネス戦略
- Meta Platforms Inc
- 会社概要
- 製品とサービス
- ビジネス戦略
- Hitachi Ltd
- 会社概要
- 製品とサービス
- ビジネス戦略
- LG Electronics Inc
- 会社概要
- 製品とサービス
- ビジネス戦略
- Goertek Inc
- 会社概要
- 製品とサービス
- ビジネス戦略
- Epic Games, Inc
- 会社概要
- 製品とサービス
- ビジネス戦略
- Sharp Corporation
- 会社概要
- 製品とサービス
- RealD Inc
- 会社概要
- 製品とサービス
第21章 世界のモバイル3D市場:競合ベンチマーキング
第22章 世界のモバイル3D市場:競合ダッシュボード
第23章 主要な合併と買収
- Leia Acquired Dimenco
- Tech Soft 3D Acquired Redway3D
- FARO Technologies Acquired GeoSLAM
- Epic Games Acquired Sketchfab
- Maxon Computer Acquired Forger App
- Unity Software Acquired RestAR
第24章 機会と戦略
- 2028年の世界モバイル3D市場- 最も新しい機会を提供する国
- 2028年の世界モバイル3D市場- 最も新しい機会を提供するセグメント
- 2028年の世界モバイル3D市場- 成長戦略
- 市場動向に基づく戦略
- 競合戦略
第25章 モバイル3D市場:結論・提言
- 結論
- 推奨事項
- 製品
- 場所
- 価格
- プロモーション
- 人々
第26章 付録
Mobile 3D refers to the integration of three-dimensional (3D) technology into mobile devices, such as smartphones, notebooks and tablets. Mobile 3D lets users view and interact with three-dimensional content on portable electronics and mobile devices.
The mobile 3D market consists of sales by entities (organizations, sole traders and partnerships), of mobile 3D that use autostereoscopic displays and may employ eye tracking to aim the 3D effect at the viewer's eye.
The global mobile 3D market was valued at $10,800.24 million in 2018 which grew till 2023 at a compound annual growth rate (CAGR) of more than 23.0%.
Increasing Internet Penetration In Rural And Urban Areas
The increasing internet penetration in rural and urban areas propelled the growth of the mobile 3D market. The proliferation of internet usage has greatly expanded the availability of online content, including 3D games and applications for mobile devices. A wider audience is exposed to and able to interact with 3D material on their mobile devices as more people become internet users. These platforms act as centralized markets where consumers can find, download and install mobile 3D apps with ease, fostering market expansion. For instance, in October 2022, according to DataReportal, a Singapore-based online reference library, a total of 5.07 billion people around the world use the internet, equivalent to 63.5 % of the world's total population. Internet users continue to grow too, with the data indicating that the world's connected population grew by more than 170 million in the past 12 months. Additionally, in July 2022, according to Livemint, an Indian financial daily newspaper, there were a total of 692 million active internet users in India, including 351 million from rural India and 341 from urban areas. The report estimates that there will be 900 million internet users in India by 2025. Therefore, the increasing internet penetration in rural and urban areas drove the mobile 3D market during historic period.
Strategic Partnerships And Collaborations Among Market Players To Drive Innovation In The Market
Major companies in the mobile 3D market are focused on strategic collaboration with the major international mobile manufacturing companies to strengthen their position in the market. Strategic collaborations empower companies to forge alliances with other firms possessing the necessary expertise to transform their latest products and innovations. For instance, in April 2022, Epic Games, Inc., a US-based video game and software developer, in collaboration with Capturing Reality, a Slovakia-based photogrammetry software for creating 3D models and Quixel AB, a Sweden-based photogrammetry company that is used in animated films or video games, launched RealityScan, a brand-new, free 3D scanning application that creates incredibly realistic 3D models from smartphone images. Epic aims to provide access to advanced photogrammetry for artists of all stripes by building on their innovative technologies.
The global mobile 3D market is highly concentrated, with a few large players operating in the market. The top ten competitors in the market made up to 58.0% of the total market in 2022.
Mobile 3D Global Market Opportunities And Strategies To 2033 from The Business Research Company provides the strategists; marketers and senior management with the critical information they need to assess the global mobile 3D market as it emerges from the COVID-19 shut down.
Reasons to Purchase
- Gain a truly global perspective with the most comprehensive report available on this market covering 15 geographies.
- Understand how the market is being affected by the coronavirus and how it is likely to emerge and grow as the impact of the virus abates.
- Create regional and country strategies on the basis of local data and analysis.
- Identify growth segments for investment.
- Outperform competitors using forecast data and the drivers and trends shaping the market.
- Understand customers based on the latest market research findings.
- Benchmark performance against key competitors.
- Utilize the relationships between key data sets for superior strategizing.
- Suitable for supporting your internal and external presentations with reliable high-quality data and analysis.
Where is the largest and fastest-growing market for mobile 3D? How does the market relate to the overall economy; demography and other similar markets? What forces will shape the market going forward? The mobile 3D market global report from The Business Research Company answers all these questions and many more.
The report covers market characteristics; size and growth; segmentation; regional and country breakdowns; competitive landscape; market shares; trends and strategies for this market. It traces the market's history and forecasts market growth by geography. It places the market within the context of the wider mobile 3D market; and compares it with other markets.
The report covers the following chapters
- Introduction and Market Characteristics-
Brief introduction to the segmentations covered in the market, definitions, and explanations about the segment by type, by device component and by application market.
- Key Trends-
Highlights the major trends shaping the global market. This section also highlights likely future developments in the market.
- Macro-Economic Scenario-
The report provides an analysis of the impact of the COVID-19 pandemic, impact of the Russia-Ukraine war and impact of rising inflation on global and regional markets, providing strategic insights for businesses in the mobile 3D market.
- Global Market Size and Growth- Global historic (2018-2023) and forecast (2023-2028, 2033F) market values and drivers and restraints that support and control the growth of the market in the historic and forecast periods.
- Regional Analysis- Historic (2018-2023) and forecast (2023-2028, 2033F) market values and growth and market share comparison by region and country.
- Market Segmentation- Contains the market values (2018-2023) (2023-2028, 2033F) and analysis for each segment by type, by device component and by application market. Historic (2018-2023) and forecast (2023-2028) and (2028-2033) market values and growth and market share comparison by region market.
- Regional Market Size and Growth- Regional market size (2023), historic (2018-2023) and forecast (2023-2028, 2033F) market values and growth and market share comparison of countries within the region. This report includes information on all the regions Asia-Pacific, Western Europe, Eastern Europe, North America, South America, Middle East and Africa and major countries within each region.
- Competitive Landscape- Details on the competitive landscape of the market, estimated market shares and company profiles of the leading players.
- Key Mergers and Acquisitions- Information on recent mergers and acquisitions in the market covered in the report. This section gives key financial details of mergers and acquisitions, which have shaped the market in recent years.
- Market Opportunities And Strategies -Describes market opportunities and strategies based on findings of the research, with information on growth opportunities across countries, segments and strategies to be followed in those markets.
- Conclusions And Recommendations- This section includes recommendations for mobile 3D providers in terms of product/service offerings geographic expansion, marketing strategies and target groups.
- Appendix-
This section includes details on the NAICS codes covered, abbreviations and currencies codes used in this report.
Scope:
Markets Covered:
- 1) By Type: Tablets; Smartphones; Notebooks; Other Types
- 2) By Device Component: Image Sensors; 3D Displays
- 3) By Application: Animations; Maps and Navigation; Mobile Gaming; Mobile Advertisements; Other Applications
- Companies Mentioned: Samsung Electronics Co LLLC; Apple Inc; Qualcomm Incorporation; NVidia Corporation; Microsoft Corporation
- Countries: Australia; China; India; Indonesia; Japan; South Korea; Brazil; Russia; USA; Canada; France, Germany; UK; Italy; Spain.
- Regions: Asia-Pacific; Western Europe; Eastern Europe; North America; South America; Middle East; Africa
- Time-series: Five years historic and ten years forecast.
- Data: Ratios of market size and growth to related markets; GDP proportions; expenditure per capita; mobile 3D indicators comparison.
- Data segmentations: country and regional historic and forecast data; market share of competitors; market segments.
- Sourcing and Referencing: Data and analysis throughout the report is sourced using end notes.
Table of Contents
1 Executive Summary
- 1.1 Mobile 3D - Market Attractiveness And Macro economic Landscape
2 Table Of Contents
3 List Of Tables
4 List Of Figures
5 Report Structure
6 Market Characteristics
- 6.1 General Market Definition
- 6.2 Summary
- 6.3 Mobile 3D Market Definition And Segmentations
- 6.4 Market Segmentation By Type
- 6.4.1 Tablets
- 6.4.2 Smartphones
- 6.4.3 Notebooks
- 6.4.4 Other Types
- 6.5 Market Segmentation By Device Component
- 6.5.1 Image Sensors
- 6.5.2 3D Displays
- 6.6 Market Segmentation By Application
- 6.6.1 Animations
- 6.6.2 Maps And Navigation
- 6.6.3 Mobile Gaming
- 6.6.4 Mobile Advertisements
- 6.6.5 Other Applications
7 Major Market Trends
- 7.1 Innovative Products With Focus On Mobile Scanner And 3D Lightfield Products
- 7.2 Strategic Partnerships And Collaborations Among Market Players To Drive Innovation In The Market
- 7.3 Use Of Artificial Intelligence (AI) Enabled Devices For Visual Experience
- 7.4 Increased Development Of AI-Powered Platforms To Elevate 3D Game Production
8 Mobile 3D Market - Macro Economic Scenario
- 8.1 COVID-19 Impact On The Mobile 3D Market
- 8.2 Impact Of The War In Ukraine On The Mobile 3D Market
- 8.3 Impact Of High Inflation On The Mobile 3D Market
9 Global Market Size and Growth
- 9.1 Market Size
- 9.2 Historic Market Growth, 2018 - 2023, Value ($ Million)
- 9.2.1 Market Drivers 2018 - 2023
- 9.2.2 Market Restraints 2018 - 2023
- 9.3 Forecast Market Growth, 2023 - 2028, 2033F Value ($ Million)
- 9.3.1 Market Drivers 2023 - 2028
- 9.3.2 Market Restraints 2023 - 2028
10 Global Mobile 3D Market Segmentation
- 10.1 Global Mobile 3D Market, Segmentation By Type, Historic And Forecast, 2018 - 2023, 2028F, 2033F, Value ($ Million)
- 10.2 Global Mobile 3D Market, Segmentation By Device Component, Historic And Forecast, 2018 - 2023, 2028F, 2033F, Value ($ Million)
- 10.3 Global Mobile 3D Market, Segmentation By Application, Historic And Forecast, 2018 - 2023, 2028F, 2033F, Value ($ Million)
11 Mobile 3D Market, Regional and Country Analysis
- 11.1 Global Mobile 3D Market, By Region, Historic and Forecast, 2018 - 2023, 2028F, 2033F, Value ($ Million)
- 11.2 Global Mobile 3D Market, By Country, Historic and Forecast, 2018 - 2023, 2028F, 2033F, Value ($ Million)
12 Asia-Pacific Market
- 12.1 Summary
- 12.2 Market Overview
- 12.2.1 Region Information
- 12.2.2 Market Information
- 12.2.3 Background Information
- 12.2.4 Government Initiatives
- 12.2.5 Regulations
- 12.2.6 Regulatory bodies
- 12.2.7 Major Associations
- 12.2.8 Taxes Levied
- 12.2.9 Corporate Tax Structure
- 12.2.10 Investments
- 12.2.11 Major Companies
- 12.3 Asia-Pacific Mobile 3D Market, Segmentation By Type, Historic And Forecast, 2018 - 2023, 2028F, 2033F, Value ($ Million)
- 12.4 Asia-Pacific Mobile 3D Market, Segmentation By Device Component, Historic And Forecast, 2018 - 2023, 2028F, 2033F, Value ($ Million)
- 12.5 Asia-Pacific Mobile 3D Market, Segmentation By Application, Historic And Forecast, 2018 - 2023, 2028F, 2033F, Value ($ Million)
- 12.6 Asia-Pacific Mobile 3D Market: Country Analysis
- 12.7 China Market
- 12.8 Summary
- 12.9 Market Overview
- 12.9.1 Country Information
- 12.9.2 Market Information
- 12.9.3 Background Information
- 12.9.4 Government Initiatives
- 12.9.5 Regulations
- 12.9.6 Regulatory Bodies
- 12.9.7 Major Associations
- 12.9.8 Taxes Levied
- 12.9.9 Corporate Tax Structure
- 12.9.10 Investments
- 12.9.11 Major Companies
- 12.10 China Mobile 3D Market, Segmentation By Type, Historic And Forecast, 2018 - 2023, 2028F, 2033F, Value ($ Million)
- 12.11 China Mobile 3D Market, Segmentation By Device Component, Historic And Forecast, 2018 - 2023, 2028F, 2033F, Value ($ Million)
- 12.12 China Mobile 3D Market, Segmentation By Application, Historic And Forecast, 2018 - 2023, 2028F, 2033F, Value ($ Million)
- 12.13 India Market
- 12.14 India Mobile 3D Market, Segmentation By Type, Historic And Forecast, 2018 - 2023, 2028F, 2033F, Value ($ Million)
- 12.15 India Mobile 3D Market, Segmentation By Device Component, Historic And Forecast, 2018 - 2023, 2028F, 2033F, Value ($ Million)
- 12.16 India Mobile 3D Market, Segmentation By Application, Historic And Forecast, 2018 - 2023, 2028F, 2033F, Value ($ Million)
- 12.17 Japan Market
- 12.18 Japan Mobile 3D Market, Segmentation By Type, Historic And Forecast, 2018 - 2023, 2028F, 2033F, Value ($ Million)
- 12.19 Japan Mobile 3D Market, Segmentation By Device Component, Historic And Forecast, 2018 - 2023, 2028F, 2033F, Value ($ Million)
- 12.20 Japan Mobile 3D Market, Segmentation By Application, Historic And Forecast, 2018 - 2023, 2028F, 2033F, Value ($ Million)
- 12.21 Australia Market
- 12.22 Australia Mobile 3D Market, Segmentation By Type, Historic And Forecast, 2018 - 2023, 2028F, 2033F, Value ($ Million)
- 12.23 Australia Mobile 3D Market, Segmentation By Device Component, Historic And Forecast, 2018 - 2023, 2028F, 2033F, Value ($ Million)
- 12.24 Australia Mobile 3D Market, Segmentation By Application, Historic And Forecast, 2018 - 2023, 2028F, 2033F, Value ($ Million)
- 12.25 Indonesia Market
- 12.26 Indonesia Mobile 3D Market, Segmentation By Type, Historic And Forecast, 2018 - 2023, 2028F, 2033F, Value ($ Million)
- 12.27 Indonesia Mobile 3D Market, Segmentation By Device Component, Historic And Forecast, 2018 - 2023, 2028F, 2033F, Value ($ Million)
- 12.28 Indonesia Mobile 3D Market, Segmentation By Application, Historic And Forecast, 2018 - 2023, 2028F, 2033F, Value ($ Million)
- 12.29 South Korea Market
- 12.30 South Korea Mobile 3D Market, Segmentation By Type, Historic And Forecast, 2018 - 2023, 2028F, 2033F, Value ($ Million)
- 12.31 South Korea Mobile 3D Market, Segmentation By Device Component, Historic And Forecast, 2018 - 2023, 2028F, 2033F, Value ($ Million)
- 12.32 South Korea Mobile 3D Market, Segmentation By Application, Historic And Forecast, 2018 - 2023, 2028F, 2033F, Value ($ Million)
13 Western Europe Market
- 13.1 Summary
- 13.2 Market Overview
- 13.2.1 Region Information
- 13.2.2 Market Information
- 13.2.3 Background Information
- 13.2.4 Government Initiatives
- 13.2.5 Regulations
- 13.2.6 Regulatory bodies
- 13.2.7 Major Associations
- 13.2.8 Taxes Levied
- 13.2.9 Corporate Tax Structure
- 13.2.10 Investments
- 13.2.11 Major companies
- 13.3 Western Europe Mobile 3D Market, Segmentation By Type, Historic And Forecast, 2018 - 2023, 2028F, 2033F, Value ($ Million)
- 13.4 Western Europe Mobile 3D Market, Segmentation By Device Component, Historic And Forecast, 2018 - 2023, 2028F, 2033F, Value ($ Million)
- 13.5 Western Europe Mobile 3D Market, Segmentation By Application, Historic And Forecast, 2018 - 2023, 2028F, 2033F, Value ($ Million)
- 13.6 Western Europe Mobile 3D Market: Country Analysis
- 13.7 UK Market
- 13.8 UK Mobile 3D Market, Segmentation By Type, Historic And Forecast, 2018 - 2023, 2028F, 2033F, Value ($ Million)
- 13.9 UK Mobile 3D Market, Segmentation By Device Component, Historic And Forecast, 2018 - 2023, 2028F, 2033F, Value ($ Million)
- 13.10 UK Mobile 3D Market, Segmentation By Application, Historic And Forecast, 2018 - 2023, 2028F, 2033F, Value ($ Million)
- 13.11 Germany Market
- 13.12 Germany Mobile 3D Market, Segmentation By Type, Historic And Forecast, 2018 - 2023, 2028F, 2033F, Value ($ Million)
- 13.13 Germany Mobile 3D Market, Segmentation By Device Component, Historic And Forecast, 2018 - 2023, 2028F, 2033F, Value ($ Million)
- 13.14 Germany Mobile 3D Market, Segmentation By Application, Historic And Forecast, 2018 - 2023, 2028F, 2033F, Value ($ Million)
- 13.15 France Market
- 13.16 France Mobile 3D Market, Segmentation By Type, Historic And Forecast, 2018 - 2023, 2028F, 2033F, Value ($ Million)
- 13.17 France Mobile 3D Market, Segmentation By Device Component, Historic And Forecast, 2018 - 2023, 2028F, 2033F, Value ($ Million)
- 13.18 France Mobile 3D Market, Segmentation By Application, Historic And Forecast, 2018 - 2023, 2028F, 2033F, Value ($ Million)
- 13.19 Italy Market
- 13.20 Italy Mobile 3D Market, Segmentation By Type, Historic And Forecast, 2018 - 2023, 2028F, 2033F, Value ($ Million)
- 13.21 Italy Mobile 3D Market, Segmentation By Device Component, Historic And Forecast, 2018 - 2023, 2028F, 2033F, Value ($ Million)
- 13.22 Italy Mobile 3D Market, Segmentation By Application, Historic And Forecast, 2018 - 2023, 2028F, 2033F, Value ($ Million)
- 13.23 Spain Market
- 13.24 Spain Mobile 3D Market, Segmentation By Type, Historic And Forecast, 2018 - 2023, 2028F, 2033F, Value ($ Million)
- 13.25 Spain Mobile 3D Market, Segmentation By Device Component, Historic And Forecast, 2018 - 2023, 2028F, 2033F, Value ($ Million)
- 13.26 Spain Mobile 3D Market, Segmentation By Application, Historic And Forecast, 2018 - 2023, 2028F, 2033F, Value ($ Million)
14 Eastern Europe Market
- 14.1 Summary
- 14.2 Market Overview
- 14.2.1 Region Information
- 14.2.2 Market Information
- 14.2.3 Background Information
- 14.2.4 Government Initiatives
- 14.2.5 Regulations
- 14.2.6 Regulatory bodies
- 14.2.7 Major Associations
- 14.2.8 Taxes Levied
- 14.2.9 Corporate Tax Structure
- 14.2.10 Major companies
- 14.3 Eastern Europe Mobile 3D Market, Segmentation By Type, Historic And Forecast, 2018 - 2023, 2028F, 2033F, Value ($ Million)
- 14.4 Eastern Europe Mobile 3D Market, Segmentation By Device Component, Historic And Forecast, 2018 - 2023, 2028F, 2033F, Value ($ Million)
- 14.5 Eastern Europe Mobile 3D Market, Segmentation By Application, Historic And Forecast, 2018 - 2023, 2028F, 2033F, Value ($ Million)
- 14.6 Eastern Europe Mobile 3D Market: Country Analysis
- 14.7 Russia Market
- 14.8 Russia Mobile 3D Market, Segmentation By Type, Historic And Forecast, 2018 - 2023, 2028F, 2033F, Value ($ Million)
- 14.9 Russia Mobile 3D Market, Segmentation By Device Component, Historic And Forecast, 2018 - 2023, 2028F, 2033F, Value ($ Million)
- 14.10 Russia Mobile 3D Market, Segmentation By Application, Historic And Forecast, 2018 - 2023, 2028F, 2033F, Value ($ Million)
15 North America Market
- 15.1 Summary
- 15.2 Market Overview
- 15.2.1 Region Information
- 15.2.2 Market Information
- 15.2.3 Background Information
- 15.2.4 Government Initiatives
- 15.2.5 Regulations
- 15.2.6 Regulatory Bodies
- 15.2.7 Major Associations
- 15.2.8 Taxes Levied
- 15.2.9 Corporate Tax Structure
- 15.2.10 Investments
- 15.2.11 Major Companies
- 15.3 North America Mobile 3D Market, Segmentation By Type, Historic And Forecast, 2018 - 2023, 2028F, 2033F, Value ($ Million)
- 15.4 North America Mobile 3D Market, Segmentation By Device Component, Historic And Forecast, 2018 - 2023, 2028F, 2033F, Value ($ Million)
- 15.5 North America Mobile 3D Market, Segmentation By Application, Historic And Forecast, 2018 - 2023, 2028F, 2033F, Value ($ Million)
- 15.6 North America Mobile 3D Market: Country Analysis
- 15.7 USA Market
- 15.8 Summary
- 15.9 Market Overview
- 15.9.1 Country Information
- 15.9.2 Market Information
- 15.9.3 Background Information
- 15.9.4 Government Initiatives
- 15.9.5 Regulations
- 15.9.6 Regulatory Bodies
- 15.9.7 Major Associations
- 15.9.8 Taxes Levied
- 15.9.9 Corporate Tax Structure
- 15.9.10 Investments
- 15.9.11 Major Companies
- 15.10 USA Mobile 3D Market, Segmentation By Type, Historic And Forecast, 2018 - 2023, 2028F, 2033F, Value ($ Million)
- 15.11 USA Mobile 3D Market, Segmentation By Device Component, Historic And Forecast, 2018 - 2023, 2028F, 2033F, Value ($ Million)
- 15.12 USA Mobile 3D Market, Segmentation By Application, Historic And Forecast, 2018 - 2023, 2028F, 2033F, Value ($ Million)
- 15.13 Canada Market
- 15.14 Canada Mobile 3D Market, Segmentation By Type, Historic And Forecast, 2018 - 2023, 2028F, 2033F, Value ($ Million)
- 15.15 Canada Mobile 3D Market, Segmentation By Device Component, Historic And Forecast, 2018 - 2023, 2028F, 2033F, Value ($ Million)
- 15.16 Canada Mobile 3D Market, Segmentation By Application, Historic And Forecast, 2018 - 2023, 2028F, 2033F, Value ($ Million)
16 South America Market
- 16.1 Summary
- 16.2 Market Overview
- 16.2.1 Region Information
- 16.2.2 Market Information
- 16.2.3 Background Information
- 16.2.4 Government Initiatives
- 16.2.5 Regulations
- 16.2.6 Regulatory Bodies
- 16.2.7 Major Associations
- 16.2.8 Taxes Levied
- 16.2.9 Corporate Tax Structure
- 16.2.10 Investments
- 16.2.11 Major Companies
- 16.3 South America Mobile 3D Market, Segmentation By Type, Historic And Forecast, 2018 - 2023, 2028F, 2033F, Value ($ Million)
- 16.4 South America Mobile 3D Market, Segmentation By Device Component, Historic And Forecast, 2018 - 2023, 2028F, 2033F, Value ($ Million)
- 16.5 South America Mobile 3D Market, Segmentation By Application, Historic And Forecast, 2018 - 2023, 2028F, 2033F, Value ($ Million)
- 16.6 South America Mobile 3D Market: Country Analysis
- 16.7 Brazil Market
- 16.8 Brazil Mobile 3D Market, Segmentation By Type, Historic And Forecast, 2018 - 2023, 2028F, 2033F, Value ($ Million)
- 16.9 Brazil Mobile 3D Market, Segmentation By Device Component, Historic And Forecast, 2018 - 2023, 2028F, 2033F, Value ($ Million)
- 16.10 Brazil Mobile 3D Market, Segmentation By Application, Historic And Forecast, 2018 - 2023, 2028F, 2033F, Value ($ Million)
17 Middle East Market
- 17.1 Summary
- 17.2 Market Overview
- 17.2.1 Region Information
- 17.2.2 Market Information
- 17.2.3 Background Information
- 17.2.4 Government Initiatives
- 17.2.5 Regulations
- 17.2.6 Regulatory Bodies
- 17.2.7 Major Associations
- 17.2.8 Taxes Levied
- 17.2.9 Corporate Tax Structure
- 17.2.10 Investments
- 17.2.11 Major Companies
- 17.3 Middle East Mobile 3D Market, Segmentation By Type, Historic And Forecast, 2018 - 2023, 2028F, 2033F, Value ($ Million)
- 17.4 Middle East Mobile 3D Market, Segmentation By Device Component, Historic And Forecast, 2018 - 2023, 2028F, 2033F, Value ($ Million)
- 17.5 Middle East Mobile 3D Market, Segmentation By Application, Historic And Forecast, 2018 - 2023, 2028F, 2033F, Value ($ Million)
18 Africa Market
- 18.1 Summary
- 18.2 Market Overview
- 18.2.1 Region Information
- 18.2.2 Market Information
- 18.2.3 Background Information
- 18.2.4 Government Initiatives
- 18.2.5 Regulations
- 18.2.6 Regulatory Bodies
- 18.2.7 Major Associations
- 18.2.8 Taxes Levied
- 18.2.9 Corporate Tax Structure
- 18.2.10 Investments
- 18.2.11 Major Companies
- 18.3 Africa Mobile 3D Market, Segmentation By Type, Historic And Forecast, 2018 - 2023, 2028F, 2033F, Value ($ Million)
- 18.4 Africa Mobile 3D Market, Segmentation By Device Component, Historic And Forecast, 2018 - 2023, 2028F, 2033F, Value ($ Million)
- 18.5 Africa Mobile 3D Market, Segmentation By Application, Historic And Forecast, 2018 - 2023, 2028F, 2033F, Value ($ Million)
19 Competitive Landscape and Company Profiles
- 19.1 Company Profiles
- 19.2 Samsung Electronics Co Ltd
- 19.2.1 Company Overview
- 19.2.2 Products And Services
- 19.2.3 Business Strategy
- 19.2.4 Financial Overview
- 19.3 Apple Inc
- 19.3.1 Company Overview
- 19.3.2 Products And Services
- 19.3.3 Business Strategy
- 19.3.4 Financial Performance
- 19.4 Qualcomm Incorporated
- 19.4.1 Company Overview
- 19.4.2 Products And Services
- 19.4.3 Business Strategy
- 19.4.4 Financial Overview
- 19.5 Nvidia Corporation
- 19.5.1 Company Overview
- 19.5.2 Products And Services
- 19.5.3 Business Strategy
- 19.5.4 Financial Overview
- 19.6 Microsoft Corporation
- 19.6.1 Company Overview
- 19.6.2 Products And Services
- 19.6.3 Business Strategy
- 19.6.4 Financial Overview
- 19.7 Leia Inc
- 19.7.1 Company Overview
- 19.7.2 Products And Services
- 19.7.3 Business Strategy
- 19.7.4 Financial Overview
20 Mobile 3D Market Other Major And Innovative Companies
- 20.1 Lenovo Group Ltd
- 20.1.1 Company Overview
- 20.1.2 Products And Services
- 20.1.3 Business Strategy
- 20.2 Sony Group Corporation
- 20.2.1 Company Overview
- 20.2.2 Products And Services
- 20.3 ZTE Corporation
- 20.3.1 Company Overview
- 20.3.2 Products And Services
- 20.3.3 Business Strategy
- 20.4 Meta Platforms Inc
- 20.4.1 Company Overview
- 20.4.2 Products And Services
- 20.4.3 Business Strategy
- 20.5 Hitachi Ltd
- 20.5.1 Company Overview
- 20.5.2 Products And Services
- 20.5.3 Business Strategy
- 20.6 LG Electronics Inc
- 20.6.1 Company Overview
- 20.6.2 Products And Services
- 20.6.3 Business Strategy
- 20.7 Goertek Inc.
- 20.7.1 Company Overview
- 20.7.2 Products And Services
- 20.7.3 Business Strategy
- 20.8 Epic Games, Inc
- 20.8.1 Company Overview
- 20.8.2 Products And Services
- 20.8.3 Business Strategy
- 20.9 Sharp Corporation
- 20.9.1 Company Overview
- 20.9.2 Products And Services
- 20.10 RealD Inc
- 20.10.1 Company Overview
- 20.10.2 Products And Services
21 Global Mobile 3D Market Competitive Benchmarking
22 Global Mobile 3D Market Competitive Dashboard
23 Key Mergers And Acquisitions
- 23.1 Leia Acquired Dimenco
- 23.2 Tech Soft 3D Acquired Redway3D
- 23.3 FARO Technologies Acquired GeoSLAM
- 23.4 Epic Games Acquired Sketchfab
- 23.5 Maxon Computer Acquired Forger App
- 23.6 Unity Software Acquired RestAR
24 Opportunities And Strategies
- 24.1 Global Mobile 3D Market In 2028 - Countries Offering Most New Opportunities
- 24.2 Global Mobile 3D Market In 2028 - Segments Offering Most New Opportunities
- 24.3 Global Mobile 3D Market In 2028 - Growth Strategies
- 24.3.1 Market Trend Based Strategies
- 24.3.2 Competitor Strategies
25 Mobile 3D Market, Conclusions And Recommendations
- 25.1 Conclusions
- 25.2 Recommendations
- 25.2.1 Product
- 25.2.2 Place
- 25.2.3 Price
- 25.2.4 Promotion
- 25.2.5 People
26 Appendix
- 26.1 Geographies Covered
- 26.2 Market Data Sources
- 26.3 Research Methodology
- 26.4 Currencies
- 26.5 The Business Research Company
- 26.6 Copyright and Disclaimer
