|
|
市場調査レポート
商品コード
1776763
炭素回収・貯留市場の2032年までの予測: タイプ別、サービス別、発生源別、技術別、エンドユーザー別、地域別の世界分析Carbon Capture and Storage Market Forecasts to 2032 - Global Analysis By Type, Service (Capture, Transportation and Utilization ), Source, Technology, End User and By Geography |
||||||

|
|||||||
カスタマイズ可能
|
|||||||

| 炭素回収・貯留市場の2032年までの予測: タイプ別、サービス別、発生源別、技術別、エンドユーザー別、地域別の世界分析 |
|
出版日: 2025年07月07日
発行: Stratistics Market Research Consulting
ページ情報: 英文 200+ Pages
納期: 2~3営業日
|

全表示
- 概要
- 図表
- 目次
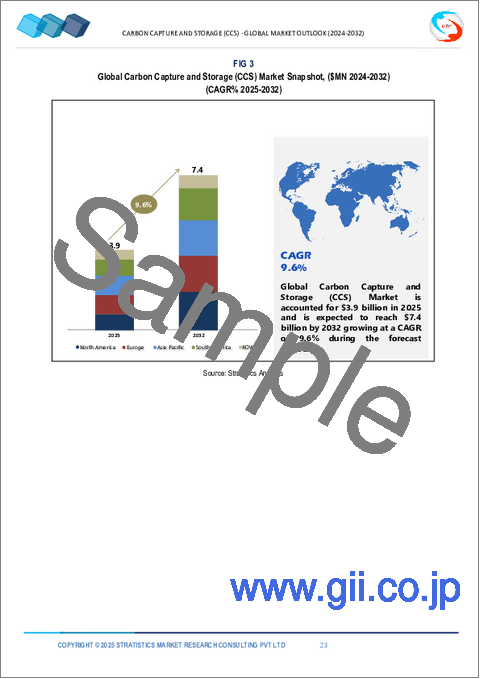
Stratistics MRCによると、世界の炭素回収・貯留(CCS)市場は2025年に39億米ドルを占め、予測期間中のCAGRは9.6%で成長し、2032年には74億米ドルに達する見込みです。
炭素回収・貯留(CCS)は、産業源や発電所から排出される二酸化炭素を大気中に放出する前に回収する気候緩和技術です。二酸化炭素は圧縮され、多くの場合パイプラインで輸送され、枯渇した油田や塩水帯水層などの深い地層に安全に貯蔵されます。このプロセスにより、温室効果ガスの排出が削減され、各部門の脱炭素化が促進されます。CCSは、特にセメントや鉄鋼のような排出削減が困難な産業において、ネットゼロ目標への移行に不可欠なソリューションとして認識されています。
Nature Energy誌の記事によると、炭素回収・貯留(CCS)技術は、発電所や産業資源から排出されるCO2の最大90~95%を除去できるといいます。同じ研究によると、地中貯留サイトには、回収したCO2を最小限の漏洩リスクで数千年間安全に貯留できる可能性があるといいます。
石油増進回収法(EOR)の需要増加
成熟した油田からの生産量を最大化する必要性の高まりが、特にEOR用途でのCCS技術の採用に拍車をかけています。回収したCO2を枯渇した油層に注入することで、石油の抽出効率を向上させると同時に、大気への排出を削減することができます。この2つのメリットは、石油・ガス会社から大きな投資を引き寄せています。さらに、政府のインセンティブや炭素クレジット制度は、EOR戦略にCCSを組み込むことを産業界に促しています。
包括的インフラの欠如
関心が高まっているにもかかわらず、CCS市場は、CO2の回収、輸送、貯蔵のためのインフラが未発達であるために、ハードルに直面しています。パイプライン、圧縮ステーション、地層処分場の建設には、多額の資本と長期計画が必要です。多くの地域では適切な貯留場所に近接していないため、ロジスティクスが複雑化し、コストが増大しています。管轄区域をまたがる規制の分断は、プロジェクトの承認と実施をさらに遅らせる。こうした制約が拡張性を妨げ、CCS技術の普及を遅らせています。
排出削減が困難なセクターの脱炭素化
セメント、鉄鋼、化学などの産業はCO2排出量が最も多く、二酸化炭素排出量削減の圧力が高まっています。CCSはこれらのセクターに実用的なソリューションを提供し、中核的な生産プロセスを見直すことなく排出削減を可能にします。世界のネットゼロ目標が強化される中、CCSは産業界の脱炭素化の要として支持を集めています。技術の進歩により、回収システムはより効率的になり、多様な産業環境に適応できるようになっています。
代替脱炭素技術との競合
直接空気回収、グリーン水素、再生可能エネルギーによる電化といった新たな技術は、資金や政策支援をめぐってCCSと競合しています。これらの代替技術は、運用の複雑さを軽減し、より広範なスケーラビリティを約束することが多く、CCS導入への課題となっています。さらに、利害関係者の中には、CCSを長期的な解決策ではなく、過渡的な解決策と見なす者もおり、これが投資の信頼性に影響する可能性もあります。技術革新が加速する中、CCSはその関連性を維持するために、費用対効果と信頼性を実証する必要があります。
COVID-19の影響:
COVID-19の大流行により、サプライチェーンの中断、労働力不足、政府の優先事項の変更により、CCSプロジェクトのスケジュールは混乱しました。リソースが公衆衛生と経済復興に振り向けられたため、計画されていた事業の多くが延期されました。しかし、この危機はまた、持続可能なインフラと気候変動への耐性の重要性を浮き彫りにしました。北米や欧州などの地域では、パンデミック後の景気刺激策にCCS構想への資金拠出が含まれており、気候目標への新たな取り組みを反映しています。
予測期間中、地中貯留セグメントが最大となる見込み
地中貯留セグメントは、大量のCO2を安全に隔離する能力が実証されているため、予測期間中最大の市場シェアを占めると予想されます。枯渇した石油・ガス貯留層と深部塩水帯水層は、膨大な容量と長期的な封じ込めの可能性を提供します。この方法は、その拡張性と既存のインフラとの互換性から支持されています。規制の枠組みは、ライセンシングやモニタリングのプロトコルを通じて、地中貯留をますますサポートするようになっています。CCSプロジェクトが世界的に拡大するにつれて、地層は永久的なCO2処分のための好ましい選択肢であり続けています。
予測期間中、燃焼後CO2回収分野が最も高いCAGRが見込まれる
予測期間中、燃焼後回収分野は、既存の発電所や産業施設への適応性により、最も高い成長率を示すと予測されます。この技術は、プロセスを大幅に変更することなく排ガスからCO2を除去できるため、改修に最適です。溶媒化学と膜システムにおける技術革新は、捕捉効率を高め、エネルギー損失を削減しています。このセグメントは、特にインフラが老朽化している地域における石炭火力発電やガス火力発電の需要増加から利益を得ています。
最大のシェアを持つ地域:
予測期間中、北米地域は、強固な政策枠組み、技術的リーダーシップ、成熟したエネルギーインフラに起因して、最大の市場シェアを維持すると予想されます。米国とカナダは、EORや産業の脱炭素化に関連したものを含め、大規模なCCSプロジェクトをいくつか立ち上げています。45Q税額控除や官民協力のような連邦政府のインセンティブが導入を後押ししています。この地域のCO2貯留に適した地質学的特性と強力な規制監督により、市場の地位はさらに高まっています。
CAGRが最も高い地域:
予測期間中、アジア太平洋地域は、急速な産業化、エネルギー需要の増加、気候変動への取り組みの増加により、最も高いCAGRを示すと予想されます。中国、インド、日本などの国々は、石炭発電、セメント、鉄鋼生産からの排出を抑制するためにCCSに多額の投資を行っています。政府が支援するパイロット・プログラムや国際パートナーシップが、技術展開を加速させています。この地域の広大な産業基盤と気候変動リスクに対する意識の高まりは、CCS拡大のための肥沃な土壌を作り出しています。
無料カスタマイズサービス:
本レポートをご購読のお客様は、以下の無料カスタマイズオプションのいずれかをご利用いただけます。
- 企業プロファイル
- 追加市場企業の包括的プロファイリング(3社まで)
- 主要企業のSWOT分析(3社まで)
- 地域セグメンテーション
- 顧客の関心に応じた主要国の市場推計・予測・CAGR(注:フィージビリティチェックによる)
- 競合ベンチマーキング
- 製品ポートフォリオ、地理的プレゼンス、戦略的提携に基づく主要企業のベンチマーキング
目次
第1章 エグゼクティブサマリー
第2章 序文
- 概要
- ステークホルダー
- 調査範囲
- 調査手法
- データマイニング
- データ分析
- データ検証
- 調査アプローチ
- 調査資料
- 1次調査資料
- 2次調査情報源
- 前提条件
第3章 市場動向分析
- 促進要因
- 抑制要因
- 機会
- 脅威
- 技術分析
- エンドユーザー分析
- 新興市場
- COVID-19の影響
第4章 ポーターのファイブフォース分析
- 供給企業の交渉力
- 買い手の交渉力
- 代替品の脅威
- 新規参入業者の脅威
- 競争企業間の敵対関係
第5章 世界の炭素回収・貯留(CCS)市場:タイプ別
- 地層貯蔵
- 深層塩水帯水層
- 油田
- ガス田
- 鉱物炭酸化
- 海洋貯蔵
第6章 世界の炭素回収・貯留(CCS)市場:サービス別
- 回収
- 輸送機関
- パイプライン
- 船舶
- トラック/鉄道
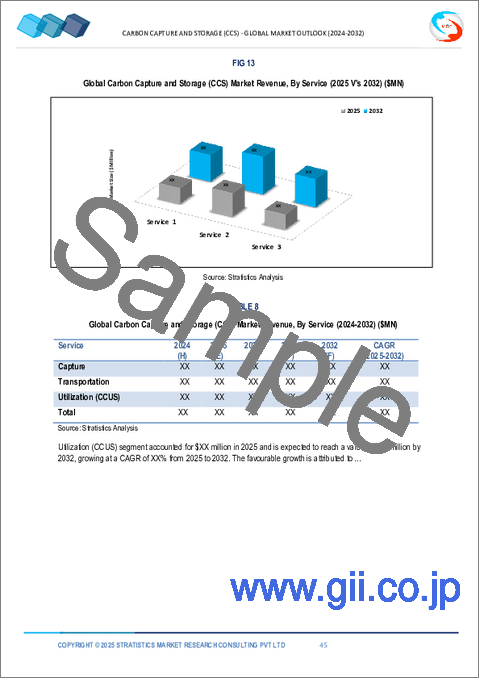
- 有効利用(CCUS)
- 石油増進回収(EOR)
- 化学物質の製造
- 建築資材
- 合成燃料
第7章 世界の炭素回収・貯留(CCS)市場:発生源別
- 石油・ガス
- 化学品・石油化学製品
- セメント
- 鉄鋼
- その他の発生源
第8章 世界の炭素回収・貯留(CCS)市場:技術別
- 燃焼後回収
- 燃焼前回収
- 酸素燃焼
- 直接空気回収(DAC)
- 産業分離
- その他の技術
第9章 世界の炭素回収・貯留(CCS)市場:エンドユーザー別
- 産業施設
- ユーティリティ
- 化学処理
- 鉄鋼
- その他のエンドユーザー
第10章 世界の炭素回収・貯留(CCS)市場:地域別
- 北米
- 米国
- カナダ
- メキシコ
- 欧州
- ドイツ
- 英国
- イタリア
- フランス
- スペイン
- その他欧州
- アジア太平洋
- 日本
- 中国
- インド
- オーストラリア
- ニュージーランド
- 韓国
- その他アジア太平洋地域
- 南米
- アルゼンチン
- ブラジル
- チリ
- その他南米
- 中東・アフリカ
- サウジアラビア
- アラブ首長国連邦
- カタール
- 南アフリカ
- その他中東とアフリカ
第11章 主な発展
- 契約、パートナーシップ、コラボレーション、ジョイントベンチャー
- 買収と合併
- 新製品発売
- 事業拡大
- その他の主要戦略
第12章 企業プロファイリング
- TotalEnergies
- Shell(Royal Dutch Shell)
- Schlumberger Limited
- Mitsubishi Heavy Industries
- Linde plc
- JGC Holdings Corporation
- Honeywell International Inc
- Fluor Corporation
- ExxonMobil
- Equinor ASA
- Climeworks
- Chevron Corporation
- Carbon Engineering
- Carbon Capture Inc.
- BP plc
- Baker Hughes
- Aker Solutions
- Air Liquide
List of Tables
- Table 1 Global Carbon Capture and Storage (CCS) Market Outlook, By Region (2024-2032) ($MN)
- Table 2 Global Carbon Capture and Storage (CCS) Market Outlook, By Type (2024-2032) ($MN)
- Table 3 Global Carbon Capture and Storage (CCS) Market Outlook, By Geological Storage (2024-2032) ($MN)
- Table 4 Global Carbon Capture and Storage (CCS) Market Outlook, By Deep Saline Aquifers (2024-2032) ($MN)
- Table 5 Global Carbon Capture and Storage (CCS) Market Outlook, By Oil Fields (2024-2032) ($MN)
- Table 6 Global Carbon Capture and Storage (CCS) Market Outlook, By Gas Fields (2024-2032) ($MN)
- Table 7 Global Carbon Capture and Storage (CCS) Market Outlook, By Mineral Carbonation (2024-2032) ($MN)
- Table 8 Global Carbon Capture and Storage (CCS) Market Outlook, By Ocean Storage (2024-2032) ($MN)
- Table 9 Global Carbon Capture and Storage (CCS) Market Outlook, By Service (2024-2032) ($MN)
- Table 10 Global Carbon Capture and Storage (CCS) Market Outlook, By Capture (2024-2032) ($MN)
- Table 11 Global Carbon Capture and Storage (CCS) Market Outlook, By Transportation (2024-2032) ($MN)
- Table 12 Global Carbon Capture and Storage (CCS) Market Outlook, By Pipelines (2024-2032) ($MN)
- Table 13 Global Carbon Capture and Storage (CCS) Market Outlook, By Ships (2024-2032) ($MN)
- Table 14 Global Carbon Capture and Storage (CCS) Market Outlook, By Trucks/Rail (2024-2032) ($MN)
- Table 15 Global Carbon Capture and Storage (CCS) Market Outlook, By Utilization (CCUS) (2024-2032) ($MN)
- Table 16 Global Carbon Capture and Storage (CCS) Market Outlook, By Enhanced Oil Recovery (EOR) (2024-2032) ($MN)
- Table 17 Global Carbon Capture and Storage (CCS) Market Outlook, By Production Of Chemicals (2024-2032) ($MN)
- Table 18 Global Carbon Capture and Storage (CCS) Market Outlook, By Building Materials (2024-2032) ($MN)
- Table 19 Global Carbon Capture and Storage (CCS) Market Outlook, By Synthetic Fuels (2024-2032) ($MN)
- Table 20 Global Carbon Capture and Storage (CCS) Market Outlook, By Source (2024-2032) ($MN)
- Table 21 Global Carbon Capture and Storage (CCS) Market Outlook, By Oil & Gas (2024-2032) ($MN)
- Table 22 Global Carbon Capture and Storage (CCS) Market Outlook, By Chemicals & Petrochemicals (2024-2032) ($MN)
- Table 23 Global Carbon Capture and Storage (CCS) Market Outlook, By Cement (2024-2032) ($MN)
- Table 24 Global Carbon Capture and Storage (CCS) Market Outlook, By Iron & Steel (2024-2032) ($MN)
- Table 25 Global Carbon Capture and Storage (CCS) Market Outlook, By Other Sources (2024-2032) ($MN)
- Table 26 Global Carbon Capture and Storage (CCS) Market Outlook, By Technology (2024-2032) ($MN)
- Table 27 Global Carbon Capture and Storage (CCS) Market Outlook, By Post-combustion Capture (2024-2032) ($MN)
- Table 28 Global Carbon Capture and Storage (CCS) Market Outlook, By Pre-combustion Capture (2024-2032) ($MN)
- Table 29 Global Carbon Capture and Storage (CCS) Market Outlook, By Oxy-fuel Combustion (2024-2032) ($MN)
- Table 30 Global Carbon Capture and Storage (CCS) Market Outlook, By Direct Air Capture (DAC) (2024-2032) ($MN)
- Table 31 Global Carbon Capture and Storage (CCS) Market Outlook, By Industrial Separation (2024-2032) ($MN)
- Table 32 Global Carbon Capture and Storage (CCS) Market Outlook, By Other Technologies (2024-2032) ($MN)
- Table 33 Global Carbon Capture and Storage (CCS) Market Outlook, By End User (2024-2032) ($MN)
- Table 34 Global Carbon Capture and Storage (CCS) Market Outlook, By Industrial facilities (2024-2032) ($MN)
- Table 35 Global Carbon Capture and Storage (CCS) Market Outlook, By Utilities (2024-2032) ($MN)
- Table 36 Global Carbon Capture and Storage (CCS) Market Outlook, By Chemical Processing (2024-2032) ($MN)
- Table 37 Global Carbon Capture and Storage (CCS) Market Outlook, By Iron & Steel (2024-2032) ($MN)
- Table 38 Global Carbon Capture and Storage (CCS) Market Outlook, By Other End Users (2024-2032) ($MN)
Note: Tables for North America, Europe, APAC, South America, and Middle East & Africa Regions are also represented in the same manner as above.
According to Stratistics MRC, the Global Carbon Capture and Storage (CCS) Market is accounted for $3.9 billion in 2025 and is expected to reach $7.4 billion by 2032 growing at a CAGR of 9.6% during the forecast period. Carbon Capture and Storage (CCS) is a climate mitigation technology that captures carbon dioxide emissions from industrial sources or power plants before they enter the atmosphere. The CO2 is compressed, transported often via pipelines and securely stored in deep geological formations such as depleted oil fields or saline aquifers. This process reduces greenhouse gas emissions and supports decarbonization across sectors. CCS is recognized as a critical solution in transitioning toward net-zero targets, especially for hard-to-abate industries like cement and steel.
According to article in Nature Energy, carbon capture and storage (CCS) technologies can remove up to 90-95% of CO2 emissions from power plants and industrial sources. According to the same study, geological storage sites have the potential to securely store captured CO2 for thousands of years with minimal leakage risk.
Market Dynamics:
Driver:
Increasing demand for enhanced oil recovery (EOR)
The rising need for maximizing output from mature oil fields is fueling the adoption of CCS technologies, particularly for EOR applications. Injecting captured CO2 into depleted reservoirs helps improve oil extraction efficiency while simultaneously reducing atmospheric emissions. This dual benefit is attracting significant investment from oil and gas companies. Moreover, government incentives and carbon credit schemes are encouraging industries to integrate CCS into their EOR strategies.
Restraint:
Lack of comprehensive infrastructure
Despite growing interest, the CCS market faces hurdles due to underdeveloped infrastructure for CO2 capture, transport, and storage. Building pipelines, compression stations, and geological repositories requires substantial capital and long-term planning. Many regions lack proximity to suitable storage sites, complicating logistics and increasing costs. Regulatory fragmentation across jurisdictions further slows project approvals and implementation. These limitations hinder scalability and delay widespread adoption of CCS technologies.
Opportunity:
Decarbonization of hard-to-abate sectors
Industries such as cement, steel, and chemicals are among the largest emitters of CO2 and face mounting pressure to reduce their carbon footprint. CCS offers a practical solution for these sectors, enabling emission reductions without overhauling core production processes. As global net-zero targets intensify; CCS is gaining traction as a cornerstone of industrial decarbonization. Technological advancements are making capture systems more efficient and adaptable to diverse industrial settings.
Threat:
Competition from alternative decarbonization technologies
Emerging technologies like direct air capture, green hydrogen, and renewable electrification are competing with CCS for funding and policy support. These alternatives often promise lower operational complexity and broader scalability, posing a challenge to CCS adoption. Additionally, some stakeholders view CCS as a transitional solution rather than a long-term fix, which may affect investment confidence. As innovation accelerates, CCS must demonstrate cost-effectiveness and reliability to maintain its relevance.
Covid-19 Impact:
The COVID-19 pandemic disrupted CCS project timelines due to supply chain interruptions, labor shortages, and shifting government priorities. Many planned ventures were delayed as resources were redirected toward public health and economic recovery. However, the crisis also underscored the importance of sustainable infrastructure and climate resilience. Post-pandemic stimulus packages in regions like North America and Europe included funding for CCS initiatives, reflecting renewed commitment to climate goals.
The geological storage segment is expected to be the largest during the forecast period
The geological storage segment is expected to account for the largest market share during the forecast period due to its proven ability to safely sequester large volumes of CO2. Depleted oil and gas reservoirs, along with deep saline aquifers, offer vast capacity and long-term containment potential. This method is favored for its scalability and compatibility with existing infrastructure. Regulatory frameworks are increasingly supporting geological storage through licensing and monitoring protocols. As CCS projects expand globally, geological formations continue to be the preferred choice for permanent CO2 disposal.
The post-combustion capture segment is expected to have the highest CAGR during the forecast period
Over the forecast period, the post-combustion capture segment is predicted to witness the highest growth rate driven by its adaptability to existing power plants and industrial facilities. This technology enables CO2 removal from flue gases without major process modifications, making it ideal for retrofitting. Innovations in solvent chemistry and membrane systems are enhancing capture efficiency and reducing energy penalties. The segment benefits from rising demand in coal and gas-fired power generation, especially in regions with aging infrastructure.
Region with largest share:
During the forecast period, the North America region is expected to hold the largest market share attributed to robust policy frameworks, technological leadership, and mature energy infrastructure. The U.S. and Canada have launched several large-scale CCS projects, including those tied to EOR and industrial decarbonization. Federal incentives like the 45Q tax credit and public-private collaborations are driving adoption. The region's geological suitability for CO2 storage and strong regulatory oversight further enhance its market position.
Region with highest CAGR:
Over the forecast period, the Asia Pacific region is anticipated to exhibit the highest CAGR fueled by rapid industrialization, rising energy demand, and increasing climate commitments. Countries such as China, India, and Japan are investing heavily in CCS to curb emissions from coal power, cement, and steel production. Government-backed pilot programs and international partnerships are accelerating technology deployment. The region's vast industrial base and growing awareness of climate risks are creating fertile ground for CCS expansion.
Key players in the market
Some of the key players in Carbon Capture and Storage (CCS) Market include TotalEnergies, Shell (Royal Dutch Shell), Schlumberger Limited, Mitsubishi Heavy Industries, Linde plc, JGC Holdings Corporation, Honeywell International Inc, Fluor Corporation, ExxonMobil, Equinor ASA, Climeworks, Chevron Corporation, Carbon Engineering, Carbon Capture Inc., BP plc, Baker Hughes, Aker Solutions and Air Liquide.
Key Developments:
In June 2025, TotalEnergies announced collaboration with AI startup Mistral AI to create a joint innovation lab focused on deploying advanced AI in low-carbon energy operations. The lab aims to develop tools like researcher assistants and industrial performance optimization systems to reduce emissions and boost efficiency.
In July 2025, TotalEnergies acquired a 50% stake in AES Dominicana's renewables portfolio, expanding its Caribbean clean energy presence with over 1.5 GW of solar, wind, and battery capacity. The deal complements a previous 30% stake in Puerto Rico and supports TotalEnergies' multi-energy strategy in the region.
In April 2025, Climeworks signed its first carbon removal agreement with shipping giant Mitsui O.S.K. Lines (MOL) to permanently remove 13,400 tons of CO2 by 2030 using DAC solutions. It sets precedents for hard-to-abate sectors leveraging carbon removal pathways.
Types Covered:
- Geological Storage
- Mineral Carbonation
- Ocean Storage
Services Covered:
- Capture
- Transportation
- Utilization (CCUS)
Sources Covered:
- Oil & Gas
- Chemicals & Petrochemicals
- Cement
- Iron & Steel
- Other Sources
Technologies Covered:
- Post-combustion Capture
- Pre-combustion Capture
- Oxy-fuel Combustion
- Direct Air Capture (DAC)
- Industrial Separation
- Other Technologies
End Users Covered:
- Industrial facilities
- Utilities
- Chemical Processing
- Iron & Steel
- Other End Users
Regions Covered:
- North America
- US
- Canada
- Mexico
- Europe
- Germany
- UK
- Italy
- France
- Spain
- Rest of Europe
- Asia Pacific
- Japan
- China
- India
- Australia
- New Zealand
- South Korea
- Rest of Asia Pacific
- South America
- Argentina
- Brazil
- Chile
- Rest of South America
- Middle East & Africa
- Saudi Arabia
- UAE
- Qatar
- South Africa
- Rest of Middle East & Africa
What our report offers:
- Market share assessments for the regional and country-level segments
- Strategic recommendations for the new entrants
- Covers Market data for the years 2024, 2025, 2026, 2028, and 2032
- Market Trends (Drivers, Constraints, Opportunities, Threats, Challenges, Investment Opportunities, and recommendations)
- Strategic recommendations in key business segments based on the market estimations
- Competitive landscaping mapping the key common trends
- Company profiling with detailed strategies, financials, and recent developments
- Supply chain trends mapping the latest technological advancements
Free Customization Offerings:
All the customers of this report will be entitled to receive one of the following free customization options:
- Company Profiling
- Comprehensive profiling of additional market players (up to 3)
- SWOT Analysis of key players (up to 3)
- Regional Segmentation
- Market estimations, Forecasts and CAGR of any prominent country as per the client's interest (Note: Depends on feasibility check)
- Competitive Benchmarking
- Benchmarking of key players based on product portfolio, geographical presence, and strategic alliance
Table of Contents
1 Executive Summary
2 Preface
- 2.1 Abstract
- 2.2 Stake Holders
- 2.3 Research Scope
- 2.4 Research Methodology
- 2.4.1 Data Mining
- 2.4.2 Data Analysis
- 2.4.3 Data Validation
- 2.4.4 Research Approach
- 2.5 Research Sources
- 2.5.1 Primary Research Sources
- 2.5.2 Secondary Research Sources
- 2.5.3 Assumptions
3 Market Trend Analysis
- 3.1 Introduction
- 3.2 Drivers
- 3.3 Restraints
- 3.4 Opportunities
- 3.5 Threats
- 3.6 Technology Analysis
- 3.7 End User Analysis
- 3.8 Emerging Markets
- 3.9 Impact of Covid-19
4 Porters Five Force Analysis
- 4.1 Bargaining power of suppliers
- 4.2 Bargaining power of buyers
- 4.3 Threat of substitutes
- 4.4 Threat of new entrants
- 4.5 Competitive rivalry
5 Global Carbon Capture and Storage (CCS) Market, By Type
- 5.1 Introduction
- 5.2 Geological Storage
- 5.2.1 Deep Saline Aquifers
- 5.2.2 Oil Fields
- 5.2.3 Gas Fields
- 5.3 Mineral Carbonation
- 5.4 Ocean Storage
6 Global Carbon Capture and Storage (CCS) Market, By Service
- 6.1 Introduction
- 6.2 Capture
- 6.3 Transportation
- 6.3.1 Pipelines
- 6.3.2 Ships
- 6.3.3 Trucks/Rail
- 6.4 Utilization (CCUS)
- 6.4.1 Enhanced Oil Recovery (EOR)
- 6.4.2 Production Of Chemicals
- 6.4.3 Building Materials
- 6.4.4 Synthetic Fuels
7 Global Carbon Capture and Storage (CCS) Market, By Source
- 7.1 Introduction
- 7.2 Oil & Gas
- 7.3 Chemicals & Petrochemicals
- 7.4 Cement
- 7.5 Iron & Steel
- 7.6 Other Sources
8 Global Carbon Capture and Storage (CCS) Market, By Technology
- 8.1 Introduction
- 8.2 Post-combustion Capture
- 8.3 Pre-combustion Capture
- 8.4 Oxy-fuel Combustion
- 8.5 Direct Air Capture (DAC)
- 8.6 Industrial Separation
- 8.7 Other Technologies
9 Global Carbon Capture and Storage (CCS) Market, By End User
- 9.1 Introduction
- 9.2 Industrial facilities
- 9.3 Utilities
- 9.4 Chemical Processing
- 9.5 Iron & Steel
- 9.6 Other End Users
10 Global Carbon Capture and Storage (CCS) Market, By Geography
- 10.1 Introduction
- 10.2 North America
- 10.2.1 US
- 10.2.2 Canada
- 10.2.3 Mexico
- 10.3 Europe
- 10.3.1 Germany
- 10.3.2 UK
- 10.3.3 Italy
- 10.3.4 France
- 10.3.5 Spain
- 10.3.6 Rest of Europe
- 10.4 Asia Pacific
- 10.4.1 Japan
- 10.4.2 China
- 10.4.3 India
- 10.4.4 Australia
- 10.4.5 New Zealand
- 10.4.6 South Korea
- 10.4.7 Rest of Asia Pacific
- 10.5 South America
- 10.5.1 Argentina
- 10.5.2 Brazil
- 10.5.3 Chile
- 10.5.4 Rest of South America
- 10.6 Middle East & Africa
- 10.6.1 Saudi Arabia
- 10.6.2 UAE
- 10.6.3 Qatar
- 10.6.4 South Africa
- 10.6.5 Rest of Middle East & Africa
11 Key Developments
- 11.1 Agreements, Partnerships, Collaborations and Joint Ventures
- 11.2 Acquisitions & Mergers
- 11.3 New Product Launch
- 11.4 Expansions
- 11.5 Other Key Strategies
12 Company Profiling
- 12.1 TotalEnergies
- 12.2 Shell (Royal Dutch Shell)
- 12.3 Schlumberger Limited
- 12.4 Mitsubishi Heavy Industries
- 12.5 Linde plc
- 12.6 JGC Holdings Corporation
- 12.7 Honeywell International Inc
- 12.8 Fluor Corporation
- 12.9 ExxonMobil
- 12.10 Equinor ASA
- 12.11 Climeworks
- 12.12 Chevron Corporation
- 12.13 Carbon Engineering
- 12.14 Carbon Capture Inc.
- 12.15 BP plc
- 12.16 Baker Hughes
- 12.17 Aker Solutions
- 12.18 Air Liquide
