|
|
市場調査レポート
商品コード
1530805
クリーンエネルギー市場の2030年までの予測: タイプ別、技術別、用途別、エンドユーザー別、地域別の世界分析Clean Energy Market Forecasts to 2030 - Global Analysis By Type (Solar Energy, Wind Energy, Hydropower, Bioenergy, Geothermal Energy and Other Types), Technology, Application, End User and By Geography |
||||||
カスタマイズ可能
|
|||||||
| クリーンエネルギー市場の2030年までの予測: タイプ別、技術別、用途別、エンドユーザー別、地域別の世界分析 |
|
出版日: 2024年08月01日
発行: Stratistics Market Research Consulting
ページ情報: 英文 200+ Pages
納期: 2~3営業日
|
全表示
- 概要
- 図表
- 目次
Stratistics MRCによると、世界のクリーンエネルギー市場は予測期間中12.7%のCAGRで成長しています。
クリーンエネルギーとは、汚染や温室効果ガスをほとんど発生させないエネルギー源から得られるエネルギーのことで、環境の持続可能性と気候への影響の低減に貢献します。太陽光発電、風力発電、水力発電、地熱発電などの再生可能エネルギー発電が含まれ、環境フットプリントを最小限に抑えて発電します。クリーンエネルギーには、高度なエネルギー貯蔵、電気自動車、スマートグリッドシステムなど、エネルギー効率を改善し、排出量を削減する技術も含まれます。化石燃料とは異なり、クリーンエネルギー源は持続可能で、天然資源や生態系への影響も少ないです。クリーンエネルギーへの移行は、気候変動を緩和し、大気汚染や水質汚染を減らし、より健全で強靭なエネルギー・インフラを促進することを目的としています。
支援的な規制、補助金、税制優遇措置
再生可能エネルギー目標や排出削減を義務付ける規制は、クリーン技術への需要を促進します。助成金やリベートなどの補助金や経済的インセンティブは、消費者と企業の双方にとって初期費用を削減し、クリーンエネルギー・プロジェクトをより経済的に実行可能なものにします。控除や控除などの税制優遇措置は、財政負担をさらに軽減し、再生可能エネルギーへの投資をより魅力的なものにします。こうした支援策は、クリーン技術の採用を加速し、技術革新を刺激し、市場競争力を高める。
高額な初期投資
ソーラーパネル、クリーンエネルギー、エネルギー貯蔵システムなどの技術に必要な多額の初期資本は、特に小規模事業者や発展途上地域の事業者にとって、投資を躊躇させる可能性があります。この金銭的なハードルは、クリーンエネルギー技術の採用を遅らせ、市場の成長を制限し、持続可能なエネルギー源への移行を遅らせる可能性があります。さらに、初期コストが高いために投資回収期間が長くなり、従来のエネルギー・オプションと比較してクリーンエネルギー・プロジェクトの魅力が低下する可能性があります。
気候変動と環境への影響に対する認識の高まり
気候問題に対する一般市民や政府の理解が深まるにつれ、二酸化炭素排出量を削減し、環境破壊を緩和する持続可能なエネルギー・ソリューションに対する需要が高まっています。このような意識は、グリーン・エネルギー・オプションに対する消費者の嗜好を刺激し、企業や政府に再生可能技術への投資を促します。意識の高まりはまた、排出基準の厳格化や再生可能エネルギーの義務化など、クリーンエネルギーの導入を支援する規制の枠組みや政策の強化にもつながり、市場の成長を促しています。
不十分なインフラと間欠性の問題
旧式の送電網システムや限られたエネルギー貯蔵施設など、不十分なインフラは再生可能エネルギーの効率的な統合と配給を妨げます。これは、非効率、コスト上昇、クリーンエネルギーシステムの信頼性低下につながる可能性があります。太陽光や風力のような再生可能エネルギー源のエネルギー生産が不安定になる間欠性の問題は、送電網の管理と信頼性をさらに複雑にしています。これらの課題は、安定的かつ継続的なエネルギー供給を確保するために、インフラの近代化と先進的なエネルギー貯蔵ソリューションの開発に多額の投資を必要とします。
COVID-19の影響:
COVID-19の大流行は当初、サプライチェーンの中断と投資の減少を通じてクリーンエネルギー市場を混乱させました。しかし、同時にグリーン復興へのシフトを加速させ、各国政府は経済復興計画において持続可能で強靭なエネルギーシステムへの注力を強めています。パンデミックはエネルギー安全保障と持続可能性の重要性を浮き彫りにし、再生可能技術とエネルギー効率への投資拡大につながった。
予測期間中、太陽エネルギー分野が最大となる見込み
太陽光発電技術の進歩と設置コストの低下により、太陽光発電がより身近になり、従来のエネルギー源と競合するようになったため、予測期間中は太陽エネルギーが最大になると予想されます。太陽エネルギーの普及は化石燃料への依存を減らし、温室効果ガスの排出を大幅に削減し、気候変動の緩和に貢献します。太陽光発電はその柔軟性により、住宅の屋根から大規模な公共施設まで、さまざまな規模で導入することが可能であり、市場の成長をさらに促進しています。
エネルギー貯蔵技術分野は予測期間中最も高いCAGRが見込まれる
エネルギー貯蔵技術分野は、予測期間中に最も高いCAGRが見込まれます。バッテリー、揚水発電、熱貯蔵を含むこれらの技術は、太陽光や風力のような再生可能エネルギー源の間欠性に対処し、発電量が少ないときでもクリーンなエネルギーの安定供給を可能にします。エネルギー貯蔵ソリューションの改善により、化石燃料によるバックアップの必要性が減少するため、排出量が削減され、より安定した送電網を支えることができます。蓄電技術の進歩はコスト削減にもつながり、再生可能エネルギーは従来のエネルギー源と比較して競争力を持っています。
最大のシェアを占める地域:
北米は、政府の強力な政策、技術の進歩、環境意識の高まりにより、予測期間中最大の市場シェアを占めると予測されます。米国とカナダは主要プレーヤーであり、太陽光、風力、水力などの再生可能エネルギーに多額の投資を行っています。エネルギー貯蔵とスマートグリッド技術のさらなる革新は、市場の成長をさらに促進します。さらに、企業の持続可能性目標やグリーンエネルギーに対する消費者の需要も、このシフトに寄与しています。
CAGRが最も高い地域:
アジア太平洋地域は、予測期間中に最も高いCAGRを維持すると予測されます。これは、中国やインドのような国々が主要な貢献者であり、太陽光、風力、水力発電のような再生可能エネルギー源に多額の投資を行っているためです。この地域は、温室効果ガスの排出削減と化石燃料からよりクリーンな代替エネルギーへの移行に取り組んでおり、野心的な目標とインセンティブによって支えられています。再生可能技術の技術的進歩とコスト低下は、市場拡大をさらに後押しします。
無料のカスタマイズサービス
本レポートをご購読のお客様には、以下の無料カスタマイズオプションのいずれかをご利用いただけます:
- 企業プロファイル
- 追加市場プレーヤーの包括的プロファイリング(3社まで)
- 主要企業のSWOT分析(3社まで)
- 地域セグメンテーション
- 顧客の関心に応じた主要国の市場推計・予測・CAGR(注:フィージビリティチェックによる)
- 競合ベンチマーキング
- 製品ポートフォリオ、地理的プレゼンス、戦略的提携に基づく主要企業のベンチマーキング
目次
第1章 エグゼクティブサマリー
第2章 序文
- 概要
- ステークホルダー
- 調査範囲
- 調査手法
- データマイニング
- データ分析
- データ検証
- 調査アプローチ
- 調査情報源
- 1次調査情報源
- 2次調査情報源
- 前提条件
第3章 市場動向分析
- 促進要因
- 抑制要因
- 機会
- 脅威
- 技術分析
- 用途分析
- エンドユーザー分析
- 新興市場
- COVID-19の影響
第4章 ポーターのファイブフォース分析
- 供給企業の交渉力
- 買い手の交渉力
- 代替品の脅威
- 新規参入業者の脅威
- 競争企業間の敵対関係
第5章 世界のクリーンエネルギー市場:タイプ別
- 太陽エネルギー
- 風力エネルギー
- 水力発電
- バイオエネルギー
- 地熱エネルギー
- その他のタイプ
第6章 世界のクリーンエネルギー市場:技術別
- 再生可能発電技術
- バイオマス
- バイオ燃料
- 集光型太陽光発電
- 太陽光発電
- エネルギー貯蔵技術
- バッテリー
- 揚水発電
- フライホイールエネルギー貯蔵
- 熱エネルギー貯蔵
- 圧縮空気エネルギー貯蔵
- エネルギー効率技術
- スマートグリッド
- LED照明
- 高度なHVACシステム
- 水素技術
- 水素製造
- 水素燃料電池
- その他のテクノロジー
第7章 世界のクリーンエネルギー市場:用途別
- 発電
- 交通機関
- 暖房と冷房
- 工業プロセス
- グリッド管理と安定化
- その他の用途
第8章 世界のクリーンエネルギー市場:エンドユーザー別
- 住宅
- 商業
- 産業
- 農業
- ヘルスケア
- 政府および公共部門
- その他のエンドユーザー
第9章 世界のクリーンエネルギー市場:地域別
- 北米
- 米国
- カナダ
- メキシコ
- 欧州
- ドイツ
- 英国
- イタリア
- フランス
- スペイン
- その他欧州
- アジア太平洋
- 日本
- 中国
- インド
- オーストラリア
- ニュージーランド
- 韓国
- その他アジア太平洋地域
- 南米
- アルゼンチン
- ブラジル
- チリ
- その他南米
- 中東・アフリカ
- サウジアラビア
- アラブ首長国連邦
- カタール
- 南アフリカ
- その他中東とアフリカ
第10章 主な発展
- 契約、パートナーシップ、コラボレーション、合弁事業
- 買収と合併
- 新製品発売
- 事業拡大
- その他の主要戦略
第11章 企業プロファイリング
- First Solar, Inc.
- SunPower Corporation
- Canadian Solar Inc.
- Vestas Wind Systems A/S
- Siemens Gamesa Renewable Energy
- GE Renewable Energy
- Andritz Hydro
- Voith Hydro
- Ormat Technologies, Inc.
- Enel Green Power
- Calpine Corporation
- Novozymes
- POET LLC
- Renewable Energy Group, Inc.
- Tesla, Inc.
- LG Energy Solution
- BYD Company Limited
- Plug Power Inc.
- Ballard Power Systems
- Schneider Electric
List of Tables
- Table 1 Global Clean Energy Market Outlook, By Region (2022-2030) ($MN)
- Table 2 Global Clean Energy Market Outlook, By Type (2022-2030) ($MN)
- Table 3 Global Clean Energy Market Outlook, By Solar Energy (2022-2030) ($MN)
- Table 4 Global Clean Energy Market Outlook, By Wind Energy (2022-2030) ($MN)
- Table 5 Global Clean Energy Market Outlook, By Hydropower (2022-2030) ($MN)
- Table 6 Global Clean Energy Market Outlook, By Bioenergy (2022-2030) ($MN)
- Table 7 Global Clean Energy Market Outlook, By Geothermal Energy (2022-2030) ($MN)
- Table 8 Global Clean Energy Market Outlook, By Other Types (2022-2030) ($MN)
- Table 9 Global Clean Energy Market Outlook, By Technology (2022-2030) ($MN)
- Table 10 Global Clean Energy Market Outlook, By Renewable Power Generation Technologies (2022-2030) ($MN)
- Table 11 Global Clean Energy Market Outlook, By Biomass (2022-2030) ($MN)
- Table 12 Global Clean Energy Market Outlook, By Biofuels (2022-2030) ($MN)
- Table 13 Global Clean Energy Market Outlook, By Concentrated Solar Power (2022-2030) ($MN)
- Table 14 Global Clean Energy Market Outlook, By Solar Photovoltaic (2022-2030) ($MN)
- Table 15 Global Clean Energy Market Outlook, By Energy Storage Technologies (2022-2030) ($MN)
- Table 16 Global Clean Energy Market Outlook, By Batteries (2022-2030) ($MN)
- Table 17 Global Clean Energy Market Outlook, By Pumped Hydro Storage (2022-2030) ($MN)
- Table 18 Global Clean Energy Market Outlook, By Flywheel Energy Storage (2022-2030) ($MN)
- Table 19 Global Clean Energy Market Outlook, By Thermal Energy Storage (2022-2030) ($MN)
- Table 20 Global Clean Energy Market Outlook, By Compressed Air Energy Storage (2022-2030) ($MN)
- Table 21 Global Clean Energy Market Outlook, By Energy Efficiency Technologies (2022-2030) ($MN)
- Table 22 Global Clean Energy Market Outlook, By Smart Grids (2022-2030) ($MN)
- Table 23 Global Clean Energy Market Outlook, By LED Lighting (2022-2030) ($MN)
- Table 24 Global Clean Energy Market Outlook, By Advanced HVAC Systems (2022-2030) ($MN)
- Table 25 Global Clean Energy Market Outlook, By Hydrogen Technologies (2022-2030) ($MN)
- Table 26 Global Clean Energy Market Outlook, By Hydrogen Production (2022-2030) ($MN)
- Table 27 Global Clean Energy Market Outlook, By Hydrogen Fuel Cells (2022-2030) ($MN)
- Table 28 Global Clean Energy Market Outlook, By Other Technologies (2022-2030) ($MN)
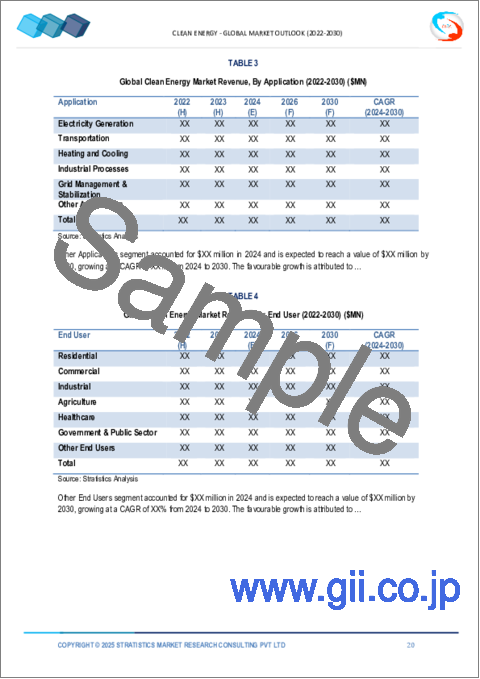
- Table 29 Global Clean Energy Market Outlook, By Application (2022-2030) ($MN)
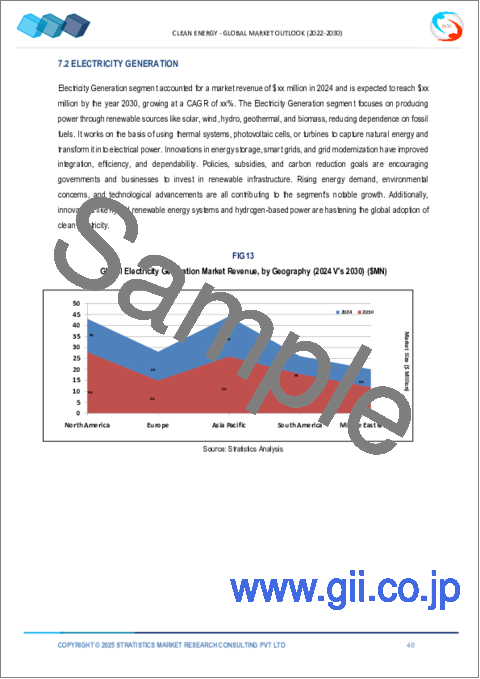
- Table 30 Global Clean Energy Market Outlook, By Electricity Generation (2022-2030) ($MN)
- Table 31 Global Clean Energy Market Outlook, By Transportation (2022-2030) ($MN)
- Table 32 Global Clean Energy Market Outlook, By Heating and Cooling (2022-2030) ($MN)
- Table 33 Global Clean Energy Market Outlook, By Industrial Processes (2022-2030) ($MN)
- Table 34 Global Clean Energy Market Outlook, By Grid Management & Stabilization (2022-2030) ($MN)
- Table 35 Global Clean Energy Market Outlook, By Other Applications (2022-2030) ($MN)
- Table 36 Global Clean Energy Market Outlook, By End User (2022-2030) ($MN)
- Table 37 Global Clean Energy Market Outlook, By Residential (2022-2030) ($MN)
- Table 38 Global Clean Energy Market Outlook, By Commercial (2022-2030) ($MN)
- Table 39 Global Clean Energy Market Outlook, By Industrial (2022-2030) ($MN)
- Table 40 Global Clean Energy Market Outlook, By Agriculture (2022-2030) ($MN)
- Table 41 Global Clean Energy Market Outlook, By Healthcare (2022-2030) ($MN)
- Table 42 Global Clean Energy Market Outlook, By Government & Public Sector (2022-2030) ($MN)
- Table 43 Global Clean Energy Market Outlook, By Other End Users (2022-2030) ($MN)
Note: Tables for North America, Europe, APAC, South America, and Middle East & Africa Regions are also represented in the same manner as above.
According to Stratistics MRC, the Global Clean Energy Market is growing at a CAGR of 12.7% during the forecast period. Clean energy is the energy derived from sources that produce little to no pollution or greenhouse gases, contributing to environmental sustainability and reduced climate impact. It encompasses renewable energy sources such as solar, wind, hydro, and geothermal power, which generate electricity with minimal environmental footprint. Clean energy also includes technologies that improve energy efficiency and reduce emissions, such as advanced energy storage, electric vehicles, and smart grid systems. Unlike fossil fuels, clean energy sources are sustainable and have a lower impact on natural resources and ecosystems. The transition to clean energy aims to mitigate climate change, reduce air and water pollution, and promote a healthier, more resilient energy infrastructure.
Market Dynamics:
Driver:
Supportive regulations, subsidies, and tax incentives
Regulations that mandate renewable energy targets and emissions reductions drive demand for clean technologies. Subsidies and financial incentives, such as grants and rebates, reduce the upfront costs for both consumers and businesses, making clean energy projects more financially viable. Tax incentives, like credits and deductions, further reduce the financial burden, making investments in renewable energy more attractive. These supportive measures accelerate the adoption of clean technologies, stimulate innovation, and enhance market competitiveness.
Restraint:
High upfront investment
The substantial initial capital required for technologies such as solar panels, Clean Energys, and energy storage systems can deter investment, particularly for smaller entities or those in developing regions. This financial hurdle can slow the adoption of clean energy technologies, limiting market growth and delaying the transition to sustainable energy sources. Additionally, high initial costs may result in longer payback periods, reducing the attractiveness of clean energy projects compared to conventional energy options.
Opportunity:
Increasing awareness of climate change and environmental impacts
As public and governmental understanding of climate issues grows, there is heightened demand for sustainable energy solutions that reduce carbon emissions and mitigate environmental damage. This awareness fuels consumer preferences for green energy options, prompting businesses and governments to invest more in renewable technologies. Enhanced awareness also leads to stronger regulatory frameworks and policies that support clean energy adoption, such as stricter emissions standards and renewable energy mandates encouraging the markets growth.
Threat:
Inadequate infrastructure & intermittency issues
Insufficient infrastructure, such as outdated grid systems and limited energy storage facilities, hampers the efficient integration and distribution of renewable energy. This can lead to inefficiencies, higher costs, and reduced reliability of clean energy systems. Intermittency issues, where renewable sources like solar and wind produce energy inconsistently, further complicate grid management and reliability. These challenges necessitate substantial investments in modernizing infrastructure and developing advanced energy storage solutions to ensure a stable and continuous energy supply.
Covid-19 Impact:
The COVID-19 pandemic initially disrupted the clean energy market through supply chain interruptions and reduced investments. However, it also accelerated the shift towards green recovery, with governments increasing focus on sustainable and resilient energy systems in their economic recovery plans. The pandemic highlighted the importance of energy security and sustainability, leading to greater investment in renewable technologies and energy efficiency.
The solar energy segment is expected to be the largest during the forecast period
The solar energy is expected to be the largest during the forecast period owing to advances in photovoltaic technology and declining installation costs have made solar power more accessible and competitive with traditional energy sources. The widespread adoption of solar energy reduces reliance on fossil fuels, significantly cutting greenhouse gas emissions and contributing to climate change mitigation. Solar power's flexibility allows it to be deployed at various scales, from residential rooftops to large utility-scale farms, further driving market growth.
The energy storage technologies segment is expected to have the highest CAGR during the forecast period
The energy storage technologies segment is expected to have the highest CAGR during the forecast period. These technologies, including batteries, pumped hydro storage, and thermal storage, address the intermittency of renewable sources like solar and wind, enabling a steady supply of clean energy even when generation is low. Improved energy storage solutions reduce the need for fossil fuel backup, thereby lowering emissions and supporting a more stable grid. Advances in storage technology also drive down costs, making renewable energy more competitive with traditional sources.
Region with largest share:
North America is projected to hold the largest market share during the forecast period driven by strong governmental policies, technological advancements, and increasing environmental awareness. The United States and Canada are key players, investing heavily in renewable energy sources such as solar, wind, and hydro power. Further innovations in energy storage and smart grid technologies further enhance market growth. Additionally, corporate sustainability goals and consumer demand for green energy contribute to the shift.
Region with highest CAGR:
Asia Pacific is projected to hold the highest CAGR over the forecast period owing to countries like China and India are major contributors, investing heavily in renewable energy sources such as solar, wind, and hydro power. The region's commitment to reducing greenhouse gas emissions and transitioning from fossil fuels to cleaner alternatives is supported by ambitious targets and incentives. Technological advancements and declining costs of renewable technologies further boost market expansion.
Key players in the market
Some of the key players in Clean Energy market include First Solar, Inc., SunPower Corporation, Canadian Solar Inc., Vestas Wind Systems A/S, Siemens Gamesa Renewable Energy, GE Renewable Energy, Andritz Hydro, Voith Hydro, Ormat Technologies, Inc., Enel Green Power, Calpine Corporation, Novozymes, POET LLC, Renewable Energy Group, Inc., Tesla, Inc., LG Energy Solution, BYD Company Limited, Plug Power Inc., Ballard Power Systems and Schneider Electric
Key Developments:
In July 2024, First Solar announced ownership of TOPCon technology patents, undertakes infringement investigation. First Solar evaluating options including asserting patent rights against potential infringers
In April 2024, GE Aerospace launched as independent, investment-grade public company following completion of GE Vernova spin-off. Launch of GE Aerospace marks successful completion of GE's multi-year transformation
In November 2023, Maxeon solar technologies and SunPower Corporation announced supply agreement amendment and resolution of disputes. Additionally, all outstanding disputes regarding the master supply agreements between the two companies have been resolved.
Types Covered:
- Solar Energy
- Wind Energy
- Hydropower
- Bioenergy
- Geothermal Energy
- Other Types
Technologies Covered:
- Renewable Power Generation Technologies
- Energy Storage Technologies
- Energy Efficiency Technologies
- Hydrogen Technologies
- Other Technologies
Applications Covered:
- Electricity Generation
- Transportation
- Heating and Cooling
- Industrial Processes
- Grid Management & Stabilization
- Other Applications
End Users Covered:
- Residential
- Commercial
- Industrial
- Agriculture
- Healthcare
- Government & Public Sector
- Other End Users
Regions Covered:
- North America
- US
- Canada
- Mexico
- Europe
- Germany
- UK
- Italy
- France
- Spain
- Rest of Europe
- Asia Pacific
- Japan
- China
- India
- Australia
- New Zealand
- South Korea
- Rest of Asia Pacific
- South America
- Argentina
- Brazil
- Chile
- Rest of South America
- Middle East & Africa
- Saudi Arabia
- UAE
- Qatar
- South Africa
- Rest of Middle East & Africa
What our report offers:
- Market share assessments for the regional and country-level segments
- Strategic recommendations for the new entrants
- Covers Market data for the years 2022, 2023, 2024, 2026, and 2030
- Market Trends (Drivers, Constraints, Opportunities, Threats, Challenges, Investment Opportunities, and recommendations)
- Strategic recommendations in key business segments based on the market estimations
- Competitive landscaping mapping the key common trends
- Company profiling with detailed strategies, financials, and recent developments
- Supply chain trends mapping the latest technological advancements
Free Customization Offerings:
All the customers of this report will be entitled to receive one of the following free customization options:
- Company Profiling
- Comprehensive profiling of additional market players (up to 3)
- SWOT Analysis of key players (up to 3)
- Regional Segmentation
- Market estimations, Forecasts and CAGR of any prominent country as per the client's interest (Note: Depends on feasibility check)
- Competitive Benchmarking
- Benchmarking of key players based on product portfolio, geographical presence, and strategic alliances
Table of Contents
1 Executive Summary
2 Preface
- 2.1 Abstract
- 2.2 Stake Holders
- 2.3 Research Scope
- 2.4 Research Methodology
- 2.4.1 Data Mining
- 2.4.2 Data Analysis
- 2.4.3 Data Validation
- 2.4.4 Research Approach
- 2.5 Research Sources
- 2.5.1 Primary Research Sources
- 2.5.2 Secondary Research Sources
- 2.5.3 Assumptions
3 Market Trend Analysis
- 3.1 Introduction
- 3.2 Drivers
- 3.3 Restraints
- 3.4 Opportunities
- 3.5 Threats
- 3.6 Technology Analysis
- 3.7 Application Analysis
- 3.8 End User Analysis
- 3.9 Emerging Markets
- 3.10 Impact of Covid-19
4 Porters Five Force Analysis
- 4.1 Bargaining power of suppliers
- 4.2 Bargaining power of buyers
- 4.3 Threat of substitutes
- 4.4 Threat of new entrants
- 4.5 Competitive rivalry
5 Global Clean Energy Market, By Type
- 5.1 Introduction
- 5.2 Solar Energy
- 5.3 Wind Energy
- 5.4 Hydropower
- 5.5 Bioenergy
- 5.6 Geothermal Energy
- 5.7 Other Types
6 Global Clean Energy Market, By Technology
- 6.1 Introduction
- 6.2 Renewable Power Generation Technologies
- 6.2.1 Biomass
- 6.2.2 Biofuels
- 6.2.3 Concentrated Solar Power
- 6.2.4 Solar Photovoltaic
- 6.3 Energy Storage Technologies
- 6.3.1 Batteries
- 6.3.2 Pumped Hydro Storage
- 6.3.3 Flywheel Energy Storage
- 6.3.4 Thermal Energy Storage
- 6.3.5 Compressed Air Energy Storage
- 6.4 Energy Efficiency Technologies
- 6.4.1 Smart Grids
- 6.4.2 LED Lighting
- 6.4.3 Advanced HVAC Systems
- 6.5 Hydrogen Technologies
- 6.5.1 Hydrogen Production
- 6.5.2 Hydrogen Fuel Cells
- 6.6 Other Technologies
7 Global Clean Energy Market, By Application
- 7.1 Introduction
- 7.2 Electricity Generation
- 7.3 Transportation
- 7.4 Heating and Cooling
- 7.5 Industrial Processes
- 7.6 Grid Management & Stabilization
- 7.7 Other Applications
8 Global Clean Energy Market, By End User
- 8.1 Introduction
- 8.2 Residential
- 8.3 Commercial
- 8.4 Industrial
- 8.5 Agriculture
- 8.6 Healthcare
- 8.7 Government & Public Sector
- 8.8 Other End Users
9 Global Clean Energy Market, By Geography
- 9.1 Introduction
- 9.2 North America
- 9.2.1 US
- 9.2.2 Canada
- 9.2.3 Mexico
- 9.3 Europe
- 9.3.1 Germany
- 9.3.2 UK
- 9.3.3 Italy
- 9.3.4 France
- 9.3.5 Spain
- 9.3.6 Rest of Europe
- 9.4 Asia Pacific
- 9.4.1 Japan
- 9.4.2 China
- 9.4.3 India
- 9.4.4 Australia
- 9.4.5 New Zealand
- 9.4.6 South Korea
- 9.4.7 Rest of Asia Pacific
- 9.5 South America
- 9.5.1 Argentina
- 9.5.2 Brazil
- 9.5.3 Chile
- 9.5.4 Rest of South America
- 9.6 Middle East & Africa
- 9.6.1 Saudi Arabia
- 9.6.2 UAE
- 9.6.3 Qatar
- 9.6.4 South Africa
- 9.6.5 Rest of Middle East & Africa
10 Key Developments
- 10.1 Agreements, Partnerships, Collaborations and Joint Ventures
- 10.2 Acquisitions & Mergers
- 10.3 New Product Launch
- 10.4 Expansions
- 10.5 Other Key Strategies
11 Company Profiling
- 11.1 First Solar, Inc.
- 11.2 SunPower Corporation
- 11.3 Canadian Solar Inc.
- 11.4 Vestas Wind Systems A/S
- 11.5 Siemens Gamesa Renewable Energy
- 11.6 GE Renewable Energy
- 11.7 Andritz Hydro
- 11.8 Voith Hydro
- 11.9 Ormat Technologies, Inc.
- 11.10 Enel Green Power
- 11.11 Calpine Corporation
- 11.12 Novozymes
- 11.13 POET LLC
- 11.14 Renewable Energy Group, Inc.
- 11.15 Tesla, Inc.
- 11.16 LG Energy Solution
- 11.17 BYD Company Limited
- 11.18 Plug Power Inc.
- 11.19 Ballard Power Systems
- 11.20 Schneider Electric


