|
|
市場調査レポート
商品コード
1454061
直接空気回収の2030年までの市場予測: ソース別、技術別、用途別、エンドユーザー別、地域別の世界分析Direct Air Capture Market Forecasts to 2030 - Global Analysis By Source (Electricity and Heat), Technology, Application, End User and By Geography |
||||||
|
|||||||
カスタマイズ可能
|
|||||||

| 直接空気回収の2030年までの市場予測: ソース別、技術別、用途別、エンドユーザー別、地域別の世界分析 |
|
出版日: 2024年03月03日
発行: Stratistics Market Research Consulting
ページ情報: 英文 200+ Pages
納期: 2~3営業日
|

全表示
- 概要
- 図表
- 目次
Stratistics MRCによると、世界の直接空気回収市場は2023年に6,200万米ドルを占め、2030年には17億3,090万米ドルに達すると予測され、予測期間中のCAGRは60.9%です。
直接空気回収(DAC)は、周囲の空気から二酸化炭素(CO2)を直接除去する技術です。通常、化学的プロセスと機械的システムの組み合わせにより、大気中から二酸化炭素分子を物理的に捕捉することで、気候変動を緩和する方法です。これらのシステムは、空気を取り込み、CO2分子を選択的に捕捉する吸着材や化学溶液に通すことで機能します。
国際エネルギー機関(IEA)によると、CO2貯留専用のパイプライン・プロジェクトは、2030年までに年間4億2,000万トン(Mt)を超える可能性があるといいます。しかし、このような進歩にもかかわらず、ネット・ゼロ・エミッション(NZE)シナリオに示された、2030年までに年間約12億トンのCO2貯留の必要性を満たすには、まだ不十分です。
カーボンオフセット需要の増加
市場では、カーボンオフセットの需要が急増しています。企業や個人がカーボンフットプリントの削減を求める中、この技術は大気からCO2を直接除去することで有望な解決策を提供します。カーボン・オフセットへの需要の高まりは、環境責任と持続可能性へのコミットメントの高まりを反映しています。これらの企業は、こうした需要に応え、技術革新を推進し、気候変動対策への世界の取り組みに貢献する上で、重要な役割を果たす態勢を整えています。
限られた貯蔵能力
DAC技術は、大気中から二酸化炭素を直接除去するのに役立っているが、回収した二酸化炭素の貯蔵がボトルネックとなっています。限られた容量が、拡張性と費用対効果の妨げとなっています。適切な貯蔵ソリューションがなければ、気候変動を緩和する可能性は制約されます。この制限に対処するには、効率的かつ持続可能な方法で、回収される二酸化炭素の量の増加に対応する革新的な貯蔵方法への投資が必要です。これが市場の成長を抑制する要因となっています。
再生可能エネルギーの拡大
再生可能エネルギーの拡大が市場の成長を促しています。持続可能性と二酸化炭素排出量の削減が重視されるようになり、太陽光発電や風力発電のような再生可能エネルギーがDAC施設に組み込まれ、操業に電力を供給するケースが増えています。このシフトは環境問題に対処するだけでなく、化石燃料への依存を減らすことで技術の経済的実行可能性を高める。再生可能エネルギーを利用することで、これらのシステムは、より効率的に、より低いカーボンフットプリントで運転することができ、それによって、世界の気候変動目標に沿いながら、炭素回収技術の進歩に貢献することができます。
明確な規制の欠如
確固としたガイドラインがなければ、企業は法的要件への対応に苦慮することになり、この重要な分野への投資と技術革新の妨げとなります。標準化された規制がないことも、潜在的な投資家や利害関係者の不確実性を高め、市場の成長の可能性を阻害します。さらに、曖昧な規制は、異なる司法管轄区にまたがる一貫性のない慣行を招き、気候変動に統一的に対処する取り組みを複雑にしています。明確な規制の枠組みがないため、市場は大きな課題に直面しています。
COVID-19の影響:
COVID-19の流行は市場に大きな影響を与えました。景気後退とサプライチェーンの混乱により、DAC技術への投資は困難に直面しました。多くのプロジェクトが、財政的な不安や物流の課題から遅延や中止を余儀なくされました。しかし、環境問題への懸念が根強い中、各国政府が気候変動の緩和に改めて注力することで、パンデミック後のDAC市場の回復と成長が促進される可能性があります。挫折にもかかわらず、炭素排出と闘う緊急性は、持続可能な気候ソリューションのためのDAC技術への革新と投資に拍車をかけるかもしれないです。
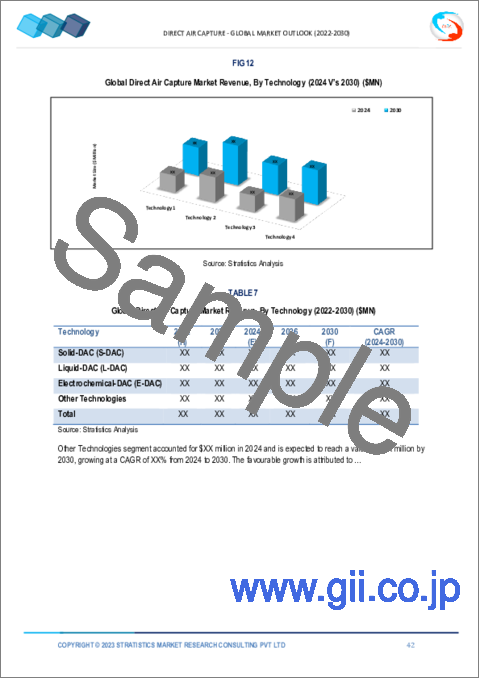
予測期間中、電気化学-DAC(E-DAC)分野が最大となる見込み
予測期間中、電気化学-DAC(E-DAC)分野が最大となる見込みです。E-DACシステムは、電気化学プロセスを利用して周囲の空気からCO2を直接回収し、温室効果ガス排出の緩和に貢献します。拡張性があり、エネルギー消費量が少なく、費用対効果に優れているため、気候変動との闘いにおいて大きな影響力を持っています。炭素除去ソリューションへの需要が高まるにつれ、E-DACは炭素捕捉技術の将来を形作る上で極めて重要な役割を果たすことになります。
予測期間中、輸送分野が最も高いCAGRが見込まれる
予測期間中、CAGRが最も高くなると予想されるのは輸送分野です。パイプラインやタンクローリーを含む効率的な輸送網は、費用対効果の高いタイムリーな配送に不可欠です。さらに、最適化されたルーティング・アルゴリズムや特殊な貯蔵容器などの輸送技術の進歩は、DACシステムの全体的な実行可能性と拡張性を高める上で極めて重要です。効果的な輸送ソリューションは、より広範な炭素管理戦略へのDACのシームレスな統合を確実にします。
最大のシェアを占める地域
予測期間中、北米が最大の市場シェアを占めると予測されます。これは、環境問題への関心の高まりと、二酸化炭素排出量削減のための規制圧力によるものです。大気から直接CO2を回収するDAC技術は、炭素除去のための実行可能なソリューションとして支持を集めています。さらに、政府の奨励策や産業界との提携が市場拡大を促進し、さまざまな分野でのDAC展開に有望な機会を示しています。
CAGRが最も高い地域:
予測期間中、アジア太平洋地域のCAGRが最も高いと予測されます。この技術の採用と成長は、政府の政策と規制によって大きな影響を受ける可能性があります。同地域では、政府が技術の開発と展開を促進するためにインセンティブ、補助金、規制を導入することがあります。研究機関、大学、非公開会社間のコラボレーションが技術の進歩に貢献する可能性もあります。
無料のカスタマイズサービス:
本レポートをご購読のお客様には、以下の無料カスタマイズオプションのいずれかをご利用いただけます:
- 企業プロファイル
- 追加市場プレーヤーの包括的プロファイリング(3社まで)
- 主要企業のSWOT分析(3社まで)
- 地域セグメンテーション
- 顧客の関心に応じた主要国の市場推計・予測・CAGR(注:フィージビリティチェックによる)
- 競合ベンチマーキング
- 製品ポートフォリオ、地理的プレゼンス、戦略的提携に基づく主要企業のベンチマーキング
目次
第1章 エグゼクティブサマリー
第2章 序文
- 概要
- ステークホルダー
- 調査範囲
- 調査手法
- データマイニング
- データ分析
- データ検証
- 調査アプローチ
- 調査ソース
- 1次調査ソース
- 2次調査ソース
- 前提条件
第3章 市場動向分析
- 促進要因
- 抑制要因
- 機会
- 脅威
- 技術分析
- アプリケーション分析
- エンドユーザー分析
- 新興市場
- 新型コロナウイルス感染症(COVID-19)の影響
第4章 ポーターのファイブフォース分析
- 供給企業の交渉力
- 買い手の交渉力
- 代替品の脅威
- 新規参入業者の脅威
- 競争企業間の敵対関係
第5章 世界の直接空気回収市場:ソース別
- 電気
- 熱
第6章 世界の直接空気回収市場:技術別
- 固体DAC(S-DAC)
- 液体DAC(L-DAC)
- 電気化学-DAC(E-DAC)
- その他の技術
第7章 世界の直接空気回収市場:用途別
- 二酸化炭素回収・貯留(CCS)
- 二酸化炭素回収、利用、貯留(CCUS)
第8章 世界の直接空気回収市場:エンドユーザー別
- 産業用
- 交通機関
- エネルギー
- 農業
- その他のエンドユーザー
第9章 世界の直接空気回収市場:地域別
- 北米
- 米国
- カナダ
- メキシコ
- 欧州
- ドイツ
- 英国
- イタリア
- フランス
- スペイン
- その他欧州
- アジア太平洋地域
- 日本
- 中国
- インド
- オーストラリア
- ニュージーランド
- 韓国
- その他アジア太平洋地域
- 南米
- アルゼンチン
- ブラジル
- チリ
- その他南米
- 中東とアフリカ
- サウジアラビア
- アラブ首長国連邦
- カタール
- 南アフリカ
- その他中東とアフリカ
第10章 主な発展
- 契約、パートナーシップ、コラボレーション、合弁事業
- 買収と合併
- 新製品の発売
- 事業拡大
- その他の主要戦略
第11章 企業プロファイル
- Climeworks
- Carbon Engineering
- Global Thermostat
- Infinitree
- Skytree
- Heirloom
- Carbon Direct
- Chevron Corporation
- Solidia Technologies
- IBM
- Blue Planet
- Energy Climate House
- Microsoft
- Arizona Clean Fuels Yuma
- Shell
List of Tables
- Table 1 Global Direct Air Capture Market Outlook, By Region (2021-2030) ($MN)
- Table 2 Global Direct Air Capture Market Outlook, By Source (2021-2030) ($MN)
- Table 3 Global Direct Air Capture Market Outlook, By Electricity (2021-2030) ($MN)
- Table 4 Global Direct Air Capture Market Outlook, By Heat (2021-2030) ($MN)
- Table 5 Global Direct Air Capture Market Outlook, By Technology (2021-2030) ($MN)
- Table 6 Global Direct Air Capture Market Outlook, By Solid-DAC (S-DAC) (2021-2030) ($MN)
- Table 7 Global Direct Air Capture Market Outlook, By Liquid-DAC (L-DAC) (2021-2030) ($MN)
- Table 8 Global Direct Air Capture Market Outlook, By Electrochemical-DAC (E-DAC) (2021-2030) ($MN)
- Table 9 Global Direct Air Capture Market Outlook, By Other Technologies (2021-2030) ($MN)
- Table 10 Global Direct Air Capture Market Outlook, By Application (2021-2030) ($MN)
- Table 11 Global Direct Air Capture Market Outlook, By Carbon Capture and Storage (CCS) (2021-2030) ($MN)
- Table 12 Global Direct Air Capture Market Outlook, By Carbon Capture, Utilization, and Storage (CCUS) (2021-2030) ($MN)
- Table 13 Global Direct Air Capture Market Outlook, By End User (2021-2030) ($MN)
- Table 14 Global Direct Air Capture Market Outlook, By Industrial (2021-2030) ($MN)
- Table 15 Global Direct Air Capture Market Outlook, By Transportation (2021-2030) ($MN)
- Table 16 Global Direct Air Capture Market Outlook, By Energy (2021-2030) ($MN)
- Table 17 Global Direct Air Capture Market Outlook, By Agriculture (2021-2030) ($MN)
- Table 18 Global Direct Air Capture Market Outlook, By Other End Users (2021-2030) ($MN)
- Table 19 North America Direct Air Capture Market Outlook, By Country (2021-2030) ($MN)
- Table 20 North America Direct Air Capture Market Outlook, By Source (2021-2030) ($MN)
- Table 21 North America Direct Air Capture Market Outlook, By Electricity (2021-2030) ($MN)
- Table 22 North America Direct Air Capture Market Outlook, By Heat (2021-2030) ($MN)
- Table 23 North America Direct Air Capture Market Outlook, By Technology (2021-2030) ($MN)
- Table 24 North America Direct Air Capture Market Outlook, By Solid-DAC (S-DAC) (2021-2030) ($MN)
- Table 25 North America Direct Air Capture Market Outlook, By Liquid-DAC (L-DAC) (2021-2030) ($MN)
- Table 26 North America Direct Air Capture Market Outlook, By Electrochemical-DAC (E-DAC) (2021-2030) ($MN)
- Table 27 North America Direct Air Capture Market Outlook, By Other Technologies (2021-2030) ($MN)
- Table 28 North America Direct Air Capture Market Outlook, By Application (2021-2030) ($MN)
- Table 29 North America Direct Air Capture Market Outlook, By Carbon Capture and Storage (CCS) (2021-2030) ($MN)
- Table 30 North America Direct Air Capture Market Outlook, By Carbon Capture, Utilization, and Storage (CCUS) (2021-2030) ($MN)
- Table 31 North America Direct Air Capture Market Outlook, By End User (2021-2030) ($MN)
- Table 32 North America Direct Air Capture Market Outlook, By Industrial (2021-2030) ($MN)
- Table 33 North America Direct Air Capture Market Outlook, By Transportation (2021-2030) ($MN)
- Table 34 North America Direct Air Capture Market Outlook, By Energy (2021-2030) ($MN)
- Table 35 North America Direct Air Capture Market Outlook, By Agriculture (2021-2030) ($MN)
- Table 36 North America Direct Air Capture Market Outlook, By Other End Users (2021-2030) ($MN)
- Table 37 Europe Direct Air Capture Market Outlook, By Country (2021-2030) ($MN)
- Table 38 Europe Direct Air Capture Market Outlook, By Source (2021-2030) ($MN)
- Table 39 Europe Direct Air Capture Market Outlook, By Electricity (2021-2030) ($MN)
- Table 40 Europe Direct Air Capture Market Outlook, By Heat (2021-2030) ($MN)
- Table 41 Europe Direct Air Capture Market Outlook, By Technology (2021-2030) ($MN)
- Table 42 Europe Direct Air Capture Market Outlook, By Solid-DAC (S-DAC) (2021-2030) ($MN)
- Table 43 Europe Direct Air Capture Market Outlook, By Liquid-DAC (L-DAC) (2021-2030) ($MN)
- Table 44 Europe Direct Air Capture Market Outlook, By Electrochemical-DAC (E-DAC) (2021-2030) ($MN)
- Table 45 Europe Direct Air Capture Market Outlook, By Other Technologies (2021-2030) ($MN)
- Table 46 Europe Direct Air Capture Market Outlook, By Application (2021-2030) ($MN)
- Table 47 Europe Direct Air Capture Market Outlook, By Carbon Capture and Storage (CCS) (2021-2030) ($MN)
- Table 48 Europe Direct Air Capture Market Outlook, By Carbon Capture, Utilization, and Storage (CCUS) (2021-2030) ($MN)
- Table 49 Europe Direct Air Capture Market Outlook, By End User (2021-2030) ($MN)
- Table 50 Europe Direct Air Capture Market Outlook, By Industrial (2021-2030) ($MN)
- Table 51 Europe Direct Air Capture Market Outlook, By Transportation (2021-2030) ($MN)
- Table 52 Europe Direct Air Capture Market Outlook, By Energy (2021-2030) ($MN)
- Table 53 Europe Direct Air Capture Market Outlook, By Agriculture (2021-2030) ($MN)
- Table 54 Europe Direct Air Capture Market Outlook, By Other End Users (2021-2030) ($MN)
- Table 55 Asia Pacific Direct Air Capture Market Outlook, By Country (2021-2030) ($MN)
- Table 56 Asia Pacific Direct Air Capture Market Outlook, By Source (2021-2030) ($MN)
- Table 57 Asia Pacific Direct Air Capture Market Outlook, By Electricity (2021-2030) ($MN)
- Table 58 Asia Pacific Direct Air Capture Market Outlook, By Heat (2021-2030) ($MN)
- Table 59 Asia Pacific Direct Air Capture Market Outlook, By Technology (2021-2030) ($MN)
- Table 60 Asia Pacific Direct Air Capture Market Outlook, By Solid-DAC (S-DAC) (2021-2030) ($MN)
- Table 61 Asia Pacific Direct Air Capture Market Outlook, By Liquid-DAC (L-DAC) (2021-2030) ($MN)
- Table 62 Asia Pacific Direct Air Capture Market Outlook, By Electrochemical-DAC (E-DAC) (2021-2030) ($MN)
- Table 63 Asia Pacific Direct Air Capture Market Outlook, By Other Technologies (2021-2030) ($MN)
- Table 64 Asia Pacific Direct Air Capture Market Outlook, By Application (2021-2030) ($MN)
- Table 65 Asia Pacific Direct Air Capture Market Outlook, By Carbon Capture and Storage (CCS) (2021-2030) ($MN)
- Table 66 Asia Pacific Direct Air Capture Market Outlook, By Carbon Capture, Utilization, and Storage (CCUS) (2021-2030) ($MN)
- Table 67 Asia Pacific Direct Air Capture Market Outlook, By End User (2021-2030) ($MN)
- Table 68 Asia Pacific Direct Air Capture Market Outlook, By Industrial (2021-2030) ($MN)
- Table 69 Asia Pacific Direct Air Capture Market Outlook, By Transportation (2021-2030) ($MN)
- Table 70 Asia Pacific Direct Air Capture Market Outlook, By Energy (2021-2030) ($MN)
- Table 71 Asia Pacific Direct Air Capture Market Outlook, By Agriculture (2021-2030) ($MN)
- Table 72 Asia Pacific Direct Air Capture Market Outlook, By Other End Users (2021-2030) ($MN)
- Table 73 South America Direct Air Capture Market Outlook, By Country (2021-2030) ($MN)
- Table 74 South America Direct Air Capture Market Outlook, By Source (2021-2030) ($MN)
- Table 75 South America Direct Air Capture Market Outlook, By Electricity (2021-2030) ($MN)
- Table 76 South America Direct Air Capture Market Outlook, By Heat (2021-2030) ($MN)
- Table 77 South America Direct Air Capture Market Outlook, By Technology (2021-2030) ($MN)
- Table 78 South America Direct Air Capture Market Outlook, By Solid-DAC (S-DAC) (2021-2030) ($MN)
- Table 79 South America Direct Air Capture Market Outlook, By Liquid-DAC (L-DAC) (2021-2030) ($MN)
- Table 80 South America Direct Air Capture Market Outlook, By Electrochemical-DAC (E-DAC) (2021-2030) ($MN)
- Table 81 South America Direct Air Capture Market Outlook, By Other Technologies (2021-2030) ($MN)
- Table 82 South America Direct Air Capture Market Outlook, By Application (2021-2030) ($MN)
- Table 83 South America Direct Air Capture Market Outlook, By Carbon Capture and Storage (CCS) (2021-2030) ($MN)
- Table 84 South America Direct Air Capture Market Outlook, By Carbon Capture, Utilization, and Storage (CCUS) (2021-2030) ($MN)
- Table 85 South America Direct Air Capture Market Outlook, By End User (2021-2030) ($MN)
- Table 86 South America Direct Air Capture Market Outlook, By Industrial (2021-2030) ($MN)
- Table 87 South America Direct Air Capture Market Outlook, By Transportation (2021-2030) ($MN)
- Table 88 South America Direct Air Capture Market Outlook, By Energy (2021-2030) ($MN)
- Table 89 South America Direct Air Capture Market Outlook, By Agriculture (2021-2030) ($MN)
- Table 90 South America Direct Air Capture Market Outlook, By Other End Users (2021-2030) ($MN)
- Table 91 Middle East & Africa Direct Air Capture Market Outlook, By Country (2021-2030) ($MN)
- Table 92 Middle East & Africa Direct Air Capture Market Outlook, By Source (2021-2030) ($MN)
- Table 93 Middle East & Africa Direct Air Capture Market Outlook, By Electricity (2021-2030) ($MN)
- Table 94 Middle East & Africa Direct Air Capture Market Outlook, By Heat (2021-2030) ($MN)
- Table 95 Middle East & Africa Direct Air Capture Market Outlook, By Technology (2021-2030) ($MN)
- Table 96 Middle East & Africa Direct Air Capture Market Outlook, By Solid-DAC (S-DAC) (2021-2030) ($MN)
- Table 97 Middle East & Africa Direct Air Capture Market Outlook, By Liquid-DAC (L-DAC) (2021-2030) ($MN)
- Table 98 Middle East & Africa Direct Air Capture Market Outlook, By Electrochemical-DAC (E-DAC) (2021-2030) ($MN)
- Table 99 Middle East & Africa Direct Air Capture Market Outlook, By Other Technologies (2021-2030) ($MN)
- Table 100 Middle East & Africa Direct Air Capture Market Outlook, By Application (2021-2030) ($MN)
- Table 101 Middle East & Africa Direct Air Capture Market Outlook, By Carbon Capture and Storage (CCS) (2021-2030) ($MN)
- Table 102 Middle East & Africa Direct Air Capture Market Outlook, By Carbon Capture, Utilization, and Storage (CCUS) (2021-2030) ($MN)
- Table 103 Middle East & Africa Direct Air Capture Market Outlook, By End User (2021-2030) ($MN)
- Table 104 Middle East & Africa Direct Air Capture Market Outlook, By Industrial (2021-2030) ($MN)
- Table 105 Middle East & Africa Direct Air Capture Market Outlook, By Transportation (2021-2030) ($MN)
- Table 106 Middle East & Africa Direct Air Capture Market Outlook, By Energy (2021-2030) ($MN)
- Table 107 Middle East & Africa Direct Air Capture Market Outlook, By Agriculture (2021-2030) ($MN)
- Table 108 Middle East & Africa Direct Air Capture Market Outlook, By Other End Users (2021-2030) ($MN)
According to Stratistics MRC, the Global Direct Air Capture Market is accounted for $62.0 million in 2023 and is expected to reach $1,730.9 million by 2030 growing at a CAGR of 60.9% uring the forecast period. Direct Air Capture (DAC) is a technology designed to remove carbon dioxide (CO2) directly from the ambient air. It's a method for mitigating climate change by physically capturing CO2 molecules from the atmosphere, typically through a combination of chemical processes and mechanical systems. These systems work by pulling in air and passing it through a sorbent material or chemical solution that selectively captures CO2 molecules.
According to the International Energy Agency (IEA), the pipeline projects dedicated to CO2 storage capacity has the potential to surpass 420 million metric tons (Mt) annually by 2030. Nevertheless, despite these strides, it remains insufficient to meet the projected storage needs of approximately 1,200 million metric tons (Mt) of CO2 per year by 2030, as delineated in the Net Zero Emissions (NZE) Scenario.
Market Dynamics:
Driver:
Increasing demand for carbon offsets
The market is experiencing a surge in demand for carbon offsets. As businesses and individuals seek to mitigate their carbon footprints, this technology offers a promising solution by directly removing CO2 from the atmosphere. This increased demand for carbon offsets reflects a growing commitment to environmental responsibility and sustainability. These companies are poised to play a crucial role in meeting these demands, driving innovation, and contributing to global efforts to combat climate change.
Restraint:
Limited storage capacity
DAC technology is instrumental in removing carbon dioxide directly from the atmosphere, but the storage of captured CO2 is a bottleneck. Limited capacity hampers scalability and cost-effectiveness. Without adequate storage solutions, the potential to mitigate climate change is constrained. Addressing this limitation requires investment in innovative storage methods to accommodate the increasing volumes of captured carbon dioxide efficiently and sustainably. This is the factor restraining the growth of the market.
Opportunity:
Expansion of renewable energy
The expansion of renewable energy sources has catalyzed growth within the market. With the growing emphasis on sustainability and reducing carbon emissions, renewable energy, such as solar and wind power, is increasingly integrated into DAC facilities to power their operations. This shift not only addresses environmental concerns but also enhances the economic viability of technology by reducing reliance on fossil fuels. By harnessing renewable energy, these systems can operate more efficiently and with lower carbon footprints, thereby contributing to the advancement of carbon capture technologies while aligning with global climate goals.
Threat:
Lack of clear regulatory
Without robust guidelines, companies may struggle to navigate legal requirements, hindering investment and innovation in this crucial field. The absence of standardized regulations also heightens uncertainty for potential investors and stakeholders, impeding the market's growth potential. Moreover, ambiguous regulations can lead to inconsistent practices across different jurisdictions, complicating efforts to address climate change uniformly. The market faces significant challenges due to the lack of clear regulatory frameworks.
Covid-19 Impact:
The COVID-19 pandemic has significantly impacted the market. With economic downturns and disruptions in supply chains, investment in DAC technology faced hurdles. Many projects experienced delays or cancellations due to financial uncertainties and logistical challenges. However, as environmental concerns persist, governments' renewed focus on climate change mitigation could drive recovery and growth in the DAC market post-pandemic. Despite setbacks, the urgency to combat carbon emissions may spur innovation and investment in DAC technology for sustainable climate solutions.
The electrochemical-DAC (E-DAC) segment is expected to be the largest during the forecast period
The electrochemical-DAC (E-DAC) segment is expected to be the largest during the forecast period. E-DAC systems utilize electrochemical processes to capture CO2 directly from ambient air, contributing to the mitigation of greenhouse gas emissions. With its potential for scalability, low energy consumption, and cost-effectiveness, it holds significant traction in the quest for combating climate change. As the demand for carbon removal solutions intensifies, E-DAC stands poised to play a pivotal role in shaping the future of carbon capture technologies.
The transportation segment is expected to have the highest CAGR during the forecast period
The transportation segment is expected to have the highest CAGR during the forecast period. Efficient transportation networks, including pipelines and tanker trucks, are essential for cost-effective and timely delivery. Additionally, advancements in transportation technologies, such as optimized routing algorithms and specialized storage vessels, are crucial for enhancing the overall viability and scalability of DAC systems. Effective transportation solutions ensure the seamless integration of DAC into broader carbon management strategies.
Region with largest share:
North America is projected to hold the largest market share during the forecast period driven by increasing environmental concerns and regulatory pressures to reduce carbon emissions. DAC technologies, designed to capture CO2 directly from the atmosphere, are gaining traction as a viable solution for carbon removal. Additionally, government incentives and partnerships with industries are fostering market expansion, signaling promising opportunities for DAC deployment across various sectors.
Region with highest CAGR:
Asia Pacific is projected to hold the highest CAGR over the forecast period. The adoption and growth of the technology can be influenced significantly by government policies and regulations. In the region, governments may introduce incentives, subsidies, or regulations to promote the development and deployment of technology. Collaborations between research institutions, universities, and private companies may contribute to technological advancements.
Key players in the market
Some of the key players in Direct Air Capture market include Climeworks, Carbon Engineering, Global Thermostat, Infinitree, Skytree, Heirloom, Carbon Direct, Chevron Corporation, Solidia Technologies, IBM, Blue Planet, Energy Climate House, Microsoft, Arizona Clean Fuels Yuma and Shell.
Key Developments:
In September 2023, Climeworks collaborated with Great Carbon valley, a pioneering Kenyan systems integrator and project development venture to explore the development of large-scale projects.
In November 2023, Heirloom Carbon Technologies signed an agreement with CarbonCure, a manufacturer of carbon removal or carbon utilization technologies to capture CO2 from the atmosphere and permanently embed it in concrete. Under this agreement CarbonCure permanently store CO2 captured by Heirloom's DAC facilities in nearby concrete plants.
Sources Covered:
- Electricity
- Heat
Technologies Covered:
- Solid-DAC (S-DAC)
- Liquid-DAC (L-DAC)
- Electrochemical-DAC (E-DAC)
- Other Technologies
Applications Covered:
- Carbon Capture and Storage (CCS)
- Carbon Capture, Utilization, and Storage (CCUS)
End Users Covered:
- Industrial
- Transportation
- Energy
- Agriculture
- Other End Users
Regions Covered:
- North America
- US
- Canada
- Mexico
- Europe
- Germany
- UK
- Italy
- France
- Spain
- Rest of Europe
- Asia Pacific
- Japan
- China
- India
- Australia
- New Zealand
- South Korea
- Rest of Asia Pacific
- South America
- Argentina
- Brazil
- Chile
- Rest of South America
- Middle East & Africa
- Saudi Arabia
- UAE
- Qatar
- South Africa
- Rest of Middle East & Africa
What our report offers:
- Market share assessments for the regional and country-level segments
- Strategic recommendations for the new entrants
- Covers Market data for the years 2021, 2022, 2023, 2026, and 2030
- Market Trends (Drivers, Constraints, Opportunities, Threats, Challenges, Investment Opportunities, and recommendations)
- Strategic recommendations in key business segments based on the market estimations
- Competitive landscaping mapping the key common trends
- Company profiling with detailed strategies, financials, and recent developments
- Supply chain trends mapping the latest technological advancements
Free Customization Offerings:
All the customers of this report will be entitled to receive one of the following free customization options:
- Company Profiling
- Comprehensive profiling of additional market players (up to 3)
- SWOT Analysis of key players (up to 3)
- Regional Segmentation
- Market estimations, Forecasts and CAGR of any prominent country as per the client's interest (Note: Depends on feasibility check)
- Competitive Benchmarking
- Benchmarking of key players based on product portfolio, geographical presence, and strategic alliances
Table of Contents
1 Executive Summary
2 Preface
- 2.1 Abstract
- 2.2 Stake Holders
- 2.3 Research Scope
- 2.4 Research Methodology
- 2.4.1 Data Mining
- 2.4.2 Data Analysis
- 2.4.3 Data Validation
- 2.4.4 Research Approach
- 2.5 Research Sources
- 2.5.1 Primary Research Sources
- 2.5.2 Secondary Research Sources
- 2.5.3 Assumptions
3 Market Trend Analysis
- 3.1 Introduction
- 3.2 Drivers
- 3.3 Restraints
- 3.4 Opportunities
- 3.5 Threats
- 3.6 Technology Analysis
- 3.7 Application Analysis
- 3.8 End User Analysis
- 3.9 Emerging Markets
- 3.10 Impact of Covid-19
4 Porters Five Force Analysis
- 4.1 Bargaining power of suppliers
- 4.2 Bargaining power of buyers
- 4.3 Threat of substitutes
- 4.4 Threat of new entrants
- 4.5 Competitive rivalry
5 Global Direct Air Capture Market, By Source
- 5.1 Introduction
- 5.2 Electricity
- 5.3 Heat
6 Global Direct Air Capture Market, By Technology
- 6.1 Introduction
- 6.2 Solid-DAC (S-DAC)
- 6.3 Liquid-DAC (L-DAC)
- 6.4 Electrochemical-DAC (E-DAC)
- 6.5 Other Technologies
7 Global Direct Air Capture Market, By Application
- 7.1 Introduction
- 7.2 Carbon Capture and Storage (CCS)
- 7.3 Carbon Capture, Utilization, and Storage (CCUS)
8 Global Direct Air Capture Market, By End User
- 8.1 Introduction
- 8.2 Industrial
- 8.3 Transportation
- 8.4 Energy
- 8.5 Agriculture
- 8.6 Other End Users
9 Global Direct Air Capture Market, By Geography
- 9.1 Introduction
- 9.2 North America
- 9.2.1 US
- 9.2.2 Canada
- 9.2.3 Mexico
- 9.3 Europe
- 9.3.1 Germany
- 9.3.2 UK
- 9.3.3 Italy
- 9.3.4 France
- 9.3.5 Spain
- 9.3.6 Rest of Europe
- 9.4 Asia Pacific
- 9.4.1 Japan
- 9.4.2 China
- 9.4.3 India
- 9.4.4 Australia
- 9.4.5 New Zealand
- 9.4.6 South Korea
- 9.4.7 Rest of Asia Pacific
- 9.5 South America
- 9.5.1 Argentina
- 9.5.2 Brazil
- 9.5.3 Chile
- 9.5.4 Rest of South America
- 9.6 Middle East & Africa
- 9.6.1 Saudi Arabia
- 9.6.2 UAE
- 9.6.3 Qatar
- 9.6.4 South Africa
- 9.6.5 Rest of Middle East & Africa
10 Key Developments
- 10.1 Agreements, Partnerships, Collaborations and Joint Ventures
- 10.2 Acquisitions & Mergers
- 10.3 New Product Launch
- 10.4 Expansions
- 10.5 Other Key Strategies
11 Company Profiling
- 11.1 Climeworks
- 11.2 Carbon Engineering
- 11.3 Global Thermostat
- 11.4 Infinitree
- 11.5 Skytree
- 11.6 Heirloom
- 11.7 Carbon Direct
- 11.8 Chevron Corporation
- 11.9 Solidia Technologies
- 11.10 IBM
- 11.11 Blue Planet
- 11.12 Energy Climate House
- 11.13 Microsoft
- 11.14 Arizona Clean Fuels Yuma
- 11.15 Shell

