|
|
市場調査レポート
商品コード
1438017
デジタルユーティリティ市場の2030年までの予測: ネットワーク、テクノロジー、エンドユーザー、地域別の世界分析Digital Utility Market Forecasts to 2030 - Global Analysis By Network (Transmission & Distribution, Generation and Retail), Technology (Hardware and Integrated Solutions), End User and By Geography |
||||||
|
|||||||
カスタマイズ可能
|
|||||||

| デジタルユーティリティ市場の2030年までの予測: ネットワーク、テクノロジー、エンドユーザー、地域別の世界分析 |
|
出版日: 2024年02月02日
発行: Stratistics Market Research Consulting
ページ情報: 英文 200+ Pages
納期: 2~3営業日
|

全表示
- 概要
- 図表
- 目次
Stratistics MRCによると、世界のデジタルユーティリティ市場は2023年に2,390億米ドルを占め、予測期間中のCAGRは14.0%で成長し、2030年には5,990億米ドルに達すると予測されています。
デジタル・ユーティリティとは、空間的に有効で高度に構成可能なソリューションのことで、実世界でプロジェクトテストされたサービスと活用されたソフトウェアの組み合わせから構築されます。デジタル・ユーティリティは、プロセスを自動化し、手作業を減らし、ワークフローを最適化することで効率を高める。これにより、より迅速で正確な結果が得られ、時間と資源の節約につながります。
米国エネルギー情報局(EIA)によると、2050年までに再生可能エネルギーが世界の電力生産の半分近くを占めるようになると予想されています。
エネルギー効率の需要
エネルギー効率化の要求は、デジタルユーティリティ市場における強力な促進要因として機能し、ユーティリティ企業がエネルギー消費と配電を最適化するための先進技術を採用するよう促しています。持続可能性と環境保全に対する世界の関心が高まる中、公益事業者はより効率的に事業を運営し、二酸化炭素排出量を削減することが求められています。さらに、デジタル・ソリューションは、エネルギー使用を監視、分析、最適化するための洗練されたツールを提供することで、こうした需要に応える上で極めて重要な役割を果たしています。
高い初期コスト
スマートグリッド、IoTデバイス、高度なデータ分析などの高度なデジタル技術の導入には、多額の先行投資が必要になることが多いです。これらのコストには、最先端のハードウェアの購入、ソフトウェア開発、統合、人材に対する包括的なトレーニングプログラムなどが含まれます。さらに、従来のユーティリティからデジタル・ユーティリティへの移行には、既存のインフラの交換や改修が伴うことが多く、費用が膨らむ可能性があります。その結果、初期コストの高さが市場拡大を妨げる大きな要因となっています。
スマートグリッドの実装
スマートグリッドの導入には、センサー、通信ネットワーク、制御メカニズムを統合し、グリッド内のエネルギーの流れをリアルタイムで監視・制御できるようにすることが含まれます。スマートグリッドは、問題を即座に検出して対応することでグリッドの信頼性を高め、ダウンタイムを最小限に抑え、全体的なパフォーマンスを向上させる。さらに、ユーティリティ企業とエンドユーザー間の双方向通信を促進し、消費者にエネルギー使用に関する洞察を与え、需要応答プログラムへの参加を可能にします。
データ・セキュリティとプライバシーの懸念
デジタルユーティリティ市場では、データ・セキュリティとプライバシーに関する懸念が大きな阻害要因となっており、市場拡大の妨げとなっています。スマートグリッド、IoTデバイス、データ分析プラットフォームの統合は、サービスの中断、データ侵害、重要インフラの侵害につながる潜在的な脆弱性を生み出します。しかし、公益事業が相互接続システムへの依存を強め、消費者の機密データを大量に収集するようになると、サイバー脅威や不正アクセスのリスクが顕著になります。
COVID-19の影響
COVID-19の流行は、デジタルユーティリティ市場に大きな影響を与えました。ロックダウンや社会的距離を置く措置が世界的に実施される中、公益事業者は重要な業務のための現場スタッフの維持という課題に直面しました。さらに、高度計測インフラ(AMI)の必要性がより明らかになり、公益事業者はパンデミック中にエネルギー消費を遠隔監視し、リアルタイムの需要対応に従事できるようになりました。
予測期間中、ハードウェア・セグメントが最大となる見込み
ハードウェア分野が最大のシェアを占めると推定されます。主なハードウェア要素には、スマートメーター、センサー、通信機器、コンピューティング機器が含まれます。これらのデバイスは、エネルギー消費に関するリアルタイムのデータを提供し、正確な請求、需要応答プログラム、効率的なグリッド管理を促進します。さらに、これらの機器はデータのシームレスな転送を可能にし、遠隔監視、制御、安全なデータ転送などの機能をサポートします。
予測期間中、航空宇宙・防衛分野が最も高いCAGRが見込まれる
航空宇宙・防衛分野は、予測期間中に有利な成長を遂げると予測されています。航空宇宙・防衛産業は、通信、データセキュリティ、戦略的意思決定を強化するためにデジタルユーティリティを活用しています。さらに、安全な通信ネットワークの統合により、信頼性の高い暗号化されたデータ転送が保証されます。デジタル・ユーティリティは、リソース管理の最適化、ロジスティクスの合理化、状況認識の強化を支援します。
最大のシェアを占める地域
北米は、急速な都市化、人口の急増、エネルギー需要の増加により、予測期間中最大の市場シェアを占めました。高度計測システムや配電自動化を含むスマートグリッドの実装がこの地域全体に普及し、電力会社はグリッド運用を最適化し、サービスの信頼性を向上させることができるようになりました。同地域が進化を続ける中、ユーティリティ企業はデジタル技術の進歩を活用してエネルギー需要の増加に対応し、持続可能なエネルギー環境に貢献しています。
CAGRが最も高い地域:<期間中に収益性の高い成長を遂げると予想されます。アジア太平洋地域のデジタルユーティリティ市場は、再生可能エネルギーの統合に重点を置いていることが特徴です。この地域の国々が急速な都市化と経済成長を遂げるにつれて、公益事業会社はインフラを近代化し、業務効率を向上させるためにデジタル・ソリューションにますます目を向けるようになっています。さらに、モノのインターネット(IoT)デバイスやセンサーの導入は、リアルタイムの監視、予知保全、グリッド全体の最適化にさらに貢献しています。
無料のカスタマイズサービス:
本レポートをご購読のお客様には、以下の無料カスタマイズオプションのいずれかをご利用いただけます:
- 企業プロファイル
- 追加市場プレイヤーの包括的プロファイリング(3社まで)
- 主要企業のSWOT分析(3社まで)
- 地域セグメンテーション
- 顧客の関心に応じた主要国の市場推計・予測・CAGR(注:フィージビリティチェックによる)
- 競合ベンチマーキング
- 製品ポートフォリオ、地理的プレゼンス、戦略的提携に基づく主要企業のベンチマーキング
目次
第1章 エグゼクティブサマリー
第2章 序文
- 概要
- ステークホルダー
- 調査範囲
- 調査手法
- データマイニング
- データ分析
- データ検証
- 調査アプローチ
- 調査ソース
- 1次調査ソース
- 2次調査ソース
- 前提条件
第3章 市場動向分析
- 促進要因
- 抑制要因
- 機会
- 脅威
- 技術分析
- エンドユーザー分析
- 新興市場
- 新型コロナウイルス感染症(COVID-19)の影響
第4章 ポーターのファイブフォース分析
- 供給企業の交渉力
- 買い手の交渉力
- 代替品の脅威
- 新規参入業者の脅威
- 競争企業間の敵対関係
第5章 世界のデジタルユーティリティ市場:ネットワーク別
- 送配電
- 世代
- 小売り
第6章 世界のデジタルユーティリティ市場:技術別
- ハードウェア
- トランスフォーマー
- スマートグリッド
- トランスフォーマー
- 統合ソリューション
- サービス
- クラウドとソフトウェア
第7章 世界のデジタルユーティリティ市場:エンドユーザー別
- 銀行、金融サービス、保険(BFSI)
- 航空宇宙と防衛
- 輸送と物流
- その他のエンドユーザー
第8章 世界のデジタルユーティリティ市場:地域別
- 北米
- 米国
- カナダ
- メキシコ
- 欧州
- ドイツ
- 英国
- イタリア
- フランス
- スペイン
- その他欧州
- アジア太平洋地域
- 日本
- 中国
- インド
- オーストラリア
- ニュージーランド
- 韓国
- その他アジア太平洋地域
- 南米
- アルゼンチン
- ブラジル
- チリ
- その他南米
- 中東とアフリカ
- サウジアラビア
- アラブ首長国連邦
- カタール
- 南アフリカ
- その他中東とアフリカ
第9章 主な発展
- 契約、パートナーシップ、コラボレーション、合弁事業
- 買収と合併
- 新製品の発売
- 事業拡大
- その他の主要戦略
第10章 企業プロファイル
- Accenture PLC
- Cisco Systems Inc.
- ABB Ltd.
- General Electric Company
- Eaton Corporation PLC
- Capgemini SA
- Oracle Corporation
- Schneider Electric SE
- Oracle Corporation
- Siemens AG
List of Tables
- Table 1 Global Digital Utility Market Outlook, By Region (2021-2030) ($MN)
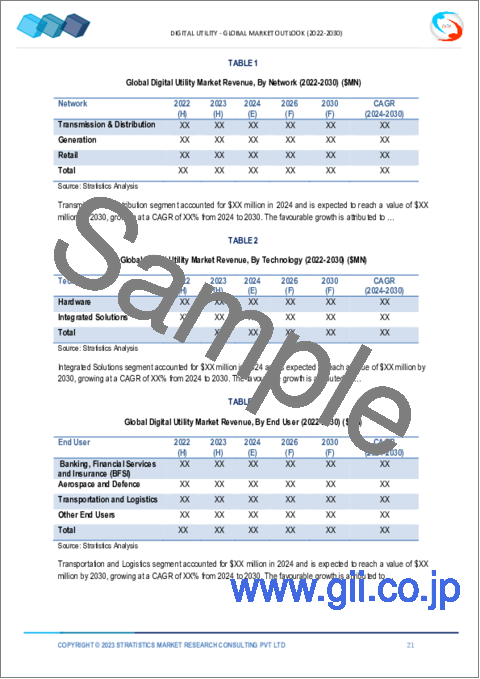
- Table 2 Global Digital Utility Market Outlook, By Network (2021-2030) ($MN)
- Table 3 Global Digital Utility Market Outlook, By Transmission & Distribution (2021-2030) ($MN)
- Table 4 Global Digital Utility Market Outlook, By Generation (2021-2030) ($MN)
- Table 5 Global Digital Utility Market Outlook, By Retail (2021-2030) ($MN)
- Table 6 Global Digital Utility Market Outlook, By Technology (2021-2030) ($MN)
- Table 7 Global Digital Utility Market Outlook, By Hardware (2021-2030) ($MN)
- Table 8 Global Digital Utility Market Outlook, By Transformers (2021-2030) ($MN)
- Table 9 Global Digital Utility Market Outlook, By Smart Grids (2021-2030) ($MN)
- Table 10 Global Digital Utility Market Outlook, By Transformers (2021-2030) ($MN)
- Table 11 Global Digital Utility Market Outlook, By Integrated Solutions (2021-2030) ($MN)
- Table 12 Global Digital Utility Market Outlook, By Service (2021-2030) ($MN)
- Table 13 Global Digital Utility Market Outlook, By Cloud and Software (2021-2030) ($MN)
- Table 14 Global Digital Utility Market Outlook, By End User (2021-2030) ($MN)
- Table 15 Global Digital Utility Market Outlook, By Banking, Financial Services and Insurance (BFSI) (2021-2030) ($MN)
- Table 16 Global Digital Utility Market Outlook, By Aerospace and Defence (2021-2030) ($MN)
- Table 17 Global Digital Utility Market Outlook, By Transportation and Logistics (2021-2030) ($MN)
- Table 18 Global Digital Utility Market Outlook, By Other End Users (2021-2030) ($MN)
- Table 19 North America Digital Utility Market Outlook, By Country (2021-2030) ($MN)
- Table 20 North America Digital Utility Market Outlook, By Network (2021-2030) ($MN)
- Table 21 North America Digital Utility Market Outlook, By Transmission & Distribution (2021-2030) ($MN)
- Table 22 North America Digital Utility Market Outlook, By Generation (2021-2030) ($MN)
- Table 23 North America Digital Utility Market Outlook, By Retail (2021-2030) ($MN)
- Table 24 North America Digital Utility Market Outlook, By Technology (2021-2030) ($MN)
- Table 25 North America Digital Utility Market Outlook, By Hardware (2021-2030) ($MN)
- Table 26 North America Digital Utility Market Outlook, By Transformers (2021-2030) ($MN)
- Table 27 North America Digital Utility Market Outlook, By Smart Grids (2021-2030) ($MN)
- Table 28 North America Digital Utility Market Outlook, By Transformers (2021-2030) ($MN)
- Table 29 North America Digital Utility Market Outlook, By Integrated Solutions (2021-2030) ($MN)
- Table 30 North America Digital Utility Market Outlook, By Service (2021-2030) ($MN)
- Table 31 North America Digital Utility Market Outlook, By Cloud and Software (2021-2030) ($MN)
- Table 32 North America Digital Utility Market Outlook, By End User (2021-2030) ($MN)
- Table 33 North America Digital Utility Market Outlook, By Banking, Financial Services and Insurance (BFSI) (2021-2030) ($MN)
- Table 34 North America Digital Utility Market Outlook, By Aerospace and Defence (2021-2030) ($MN)
- Table 35 North America Digital Utility Market Outlook, By Transportation and Logistics (2021-2030) ($MN)
- Table 36 North America Digital Utility Market Outlook, By Other End Users (2021-2030) ($MN)
- Table 37 Europe Digital Utility Market Outlook, By Country (2021-2030) ($MN)
- Table 38 Europe Digital Utility Market Outlook, By Network (2021-2030) ($MN)
- Table 39 Europe Digital Utility Market Outlook, By Transmission & Distribution (2021-2030) ($MN)
- Table 40 Europe Digital Utility Market Outlook, By Generation (2021-2030) ($MN)
- Table 41 Europe Digital Utility Market Outlook, By Retail (2021-2030) ($MN)
- Table 42 Europe Digital Utility Market Outlook, By Technology (2021-2030) ($MN)
- Table 43 Europe Digital Utility Market Outlook, By Hardware (2021-2030) ($MN)
- Table 44 Europe Digital Utility Market Outlook, By Transformers (2021-2030) ($MN)
- Table 45 Europe Digital Utility Market Outlook, By Smart Grids (2021-2030) ($MN)
- Table 46 Europe Digital Utility Market Outlook, By Transformers (2021-2030) ($MN)
- Table 47 Europe Digital Utility Market Outlook, By Integrated Solutions (2021-2030) ($MN)
- Table 48 Europe Digital Utility Market Outlook, By Service (2021-2030) ($MN)
- Table 49 Europe Digital Utility Market Outlook, By Cloud and Software (2021-2030) ($MN)
- Table 50 Europe Digital Utility Market Outlook, By End User (2021-2030) ($MN)
- Table 51 Europe Digital Utility Market Outlook, By Banking, Financial Services and Insurance (BFSI) (2021-2030) ($MN)
- Table 52 Europe Digital Utility Market Outlook, By Aerospace and Defence (2021-2030) ($MN)
- Table 53 Europe Digital Utility Market Outlook, By Transportation and Logistics (2021-2030) ($MN)
- Table 54 Europe Digital Utility Market Outlook, By Other End Users (2021-2030) ($MN)
- Table 55 Asia Pacific Digital Utility Market Outlook, By Country (2021-2030) ($MN)
- Table 56 Asia Pacific Digital Utility Market Outlook, By Network (2021-2030) ($MN)
- Table 57 Asia Pacific Digital Utility Market Outlook, By Transmission & Distribution (2021-2030) ($MN)
- Table 58 Asia Pacific Digital Utility Market Outlook, By Generation (2021-2030) ($MN)
- Table 59 Asia Pacific Digital Utility Market Outlook, By Retail (2021-2030) ($MN)
- Table 60 Asia Pacific Digital Utility Market Outlook, By Technology (2021-2030) ($MN)
- Table 61 Asia Pacific Digital Utility Market Outlook, By Hardware (2021-2030) ($MN)
- Table 62 Asia Pacific Digital Utility Market Outlook, By Transformers (2021-2030) ($MN)
- Table 63 Asia Pacific Digital Utility Market Outlook, By Smart Grids (2021-2030) ($MN)
- Table 64 Asia Pacific Digital Utility Market Outlook, By Transformers (2021-2030) ($MN)
- Table 65 Asia Pacific Digital Utility Market Outlook, By Integrated Solutions (2021-2030) ($MN)
- Table 66 Asia Pacific Digital Utility Market Outlook, By Service (2021-2030) ($MN)
- Table 67 Asia Pacific Digital Utility Market Outlook, By Cloud and Software (2021-2030) ($MN)
- Table 68 Asia Pacific Digital Utility Market Outlook, By End User (2021-2030) ($MN)
- Table 69 Asia Pacific Digital Utility Market Outlook, By Banking, Financial Services and Insurance (BFSI) (2021-2030) ($MN)
- Table 70 Asia Pacific Digital Utility Market Outlook, By Aerospace and Defence (2021-2030) ($MN)
- Table 71 Asia Pacific Digital Utility Market Outlook, By Transportation and Logistics (2021-2030) ($MN)
- Table 72 Asia Pacific Digital Utility Market Outlook, By Other End Users (2021-2030) ($MN)
- Table 73 South America Digital Utility Market Outlook, By Country (2021-2030) ($MN)
- Table 74 South America Digital Utility Market Outlook, By Network (2021-2030) ($MN)
- Table 75 South America Digital Utility Market Outlook, By Transmission & Distribution (2021-2030) ($MN)
- Table 76 South America Digital Utility Market Outlook, By Generation (2021-2030) ($MN)
- Table 77 South America Digital Utility Market Outlook, By Retail (2021-2030) ($MN)
- Table 78 South America Digital Utility Market Outlook, By Technology (2021-2030) ($MN)
- Table 79 South America Digital Utility Market Outlook, By Hardware (2021-2030) ($MN)
- Table 80 South America Digital Utility Market Outlook, By Transformers (2021-2030) ($MN)
- Table 81 South America Digital Utility Market Outlook, By Smart Grids (2021-2030) ($MN)
- Table 82 South America Digital Utility Market Outlook, By Transformers (2021-2030) ($MN)
- Table 83 South America Digital Utility Market Outlook, By Integrated Solutions (2021-2030) ($MN)
- Table 84 South America Digital Utility Market Outlook, By Service (2021-2030) ($MN)
- Table 85 South America Digital Utility Market Outlook, By Cloud and Software (2021-2030) ($MN)
- Table 86 South America Digital Utility Market Outlook, By End User (2021-2030) ($MN)
- Table 87 South America Digital Utility Market Outlook, By Banking, Financial Services and Insurance (BFSI) (2021-2030) ($MN)
- Table 88 South America Digital Utility Market Outlook, By Aerospace and Defence (2021-2030) ($MN)
- Table 89 South America Digital Utility Market Outlook, By Transportation and Logistics (2021-2030) ($MN)
- Table 90 South America Digital Utility Market Outlook, By Other End Users (2021-2030) ($MN)
- Table 91 Middle East & Africa Digital Utility Market Outlook, By Country (2021-2030) ($MN)
- Table 92 Middle East & Africa Digital Utility Market Outlook, By Network (2021-2030) ($MN)
- Table 93 Middle East & Africa Digital Utility Market Outlook, By Transmission & Distribution (2021-2030) ($MN)
- Table 94 Middle East & Africa Digital Utility Market Outlook, By Generation (2021-2030) ($MN)
- Table 95 Middle East & Africa Digital Utility Market Outlook, By Retail (2021-2030) ($MN)
- Table 96 Middle East & Africa Digital Utility Market Outlook, By Technology (2021-2030) ($MN)
- Table 97 Middle East & Africa Digital Utility Market Outlook, By Hardware (2021-2030) ($MN)
- Table 98 Middle East & Africa Digital Utility Market Outlook, By Transformers (2021-2030) ($MN)
- Table 99 Middle East & Africa Digital Utility Market Outlook, By Smart Grids (2021-2030) ($MN)
- Table 100 Middle East & Africa Digital Utility Market Outlook, By Transformers (2021-2030) ($MN)
- Table 101 Middle East & Africa Digital Utility Market Outlook, By Integrated Solutions (2021-2030) ($MN)
- Table 102 Middle East & Africa Digital Utility Market Outlook, By Service (2021-2030) ($MN)
- Table 103 Middle East & Africa Digital Utility Market Outlook, By Cloud and Software (2021-2030) ($MN)
- Table 104 Middle East & Africa Digital Utility Market Outlook, By End User (2021-2030) ($MN)
- Table 105 Middle East & Africa Digital Utility Market Outlook, By Banking, Financial Services and Insurance (BFSI) (2021-2030) ($MN)
- Table 106 Middle East & Africa Digital Utility Market Outlook, By Aerospace and Defence (2021-2030) ($MN)
- Table 107 Middle East & Africa Digital Utility Market Outlook, By Transportation and Logistics (2021-2030) ($MN)
- Table 108 Middle East & Africa Digital Utility Market Outlook, By Other End Users (2021-2030) ($MN)
According to Stratistics MRC, the Global Digital Utility Market is accounted for $239 billion in 2023 and is expected to reach $599 billion by 2030 growing at a CAGR of 14.0% during the forecast period. Digital utility refers to solutions that are spatially enabled and highly configurable, built from a combination of real-world, project-tested services and leveraged software. Digital utility enhances efficiency by automating processes, reducing manual tasks, and optimizing workflows. This leads to faster and more accurate outcomes, saving time and resources.
According to the Energy Information Administration of the United States (EIA), by 2050, renewable energy is expected to account for nearly half of global electricity production.
Market Dynamics:
Driver:
Energy efficiency demands
Energy efficiency demands serve as a compelling driver in the digital utility market, driving utilities to embrace advanced technologies for optimized energy consumption and distribution. With an increasing global focus on sustainability and environmental conservation, there is a growing imperative for utilities to operate more efficiently and reduce their carbon footprint. Moreover, digital solutions play a pivotal role in meeting these demands by offering sophisticated tools for monitoring, analyzing, and optimizing energy usage.
Restraint:
High initial costs
The deployment of advanced digital technologies, such as smart grids, IoT devices, and sophisticated data analytics, often requires substantial upfront investments. These costs encompass the acquisition of cutting-edge hardware, software development, integration, and comprehensive training programs for personnel. Moreover, the transition from traditional to digital utilities often involves the replacement or retrofitting of existing infrastructure, which can escalate expenses. As a result, high initial costs are a significant factor hindering market expansion.
Opportunity:
Smart grid implementation
Implementation involves the integration of sensors, communication networks, and control mechanisms, enabling real-time monitoring and control of energy flow within the grid. Smart grids enhance grid reliability by detecting and responding to issues instantly, minimizing downtime, and improving overall performance. Furthermore, they facilitate bidirectional communication between utilities and end-users, empowering consumers with insights into their energy usage and enabling participation in demand response programs.
Threat:
Data security and privacy concerns
Data security and privacy concerns constitute significant restraints in the digital utility market, hindering its expansion. The integration of smart grids, IoT devices, and data analytics platforms creates potential vulnerabilities leading to service disruptions, data breaches, or compromises of critical infrastructure. However, as utilities increasingly rely on interconnected systems and collect vast amounts of sensitive consumer data, the risk of cyber threats and unauthorized access becomes pronounced.
Covid-19 Impact
The COVID-19 pandemic has had a profound impact on the digital utility market. As lockdowns and social distancing measures were implemented globally, utilities faced challenges maintaining on-site staffing for essential operations. Additionally, the need for advanced metering infrastructure (AMI) became more apparent, allowing utilities to monitor energy consumption remotely and engage in real-time demand response during the pandemic.
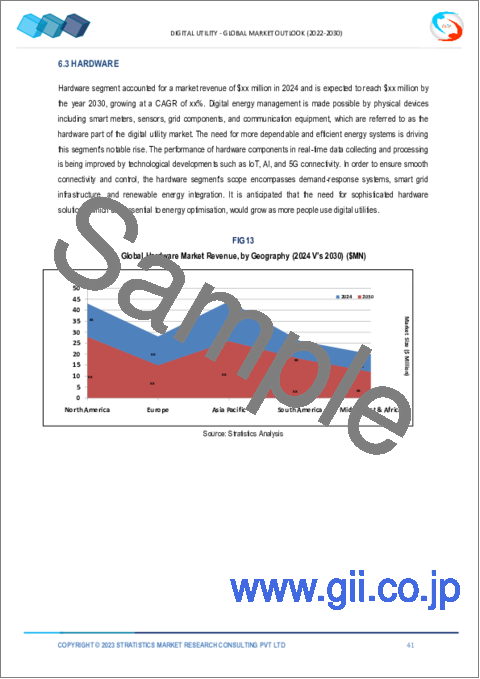
The hardware segment is expected to be the largest during the forecast period
The hardware segment is estimated to hold the largest share. Key hardware elements include smart meters, sensors, communication devices, and computing equipment. These devices provide real-time data on energy consumption, facilitating accurate billing, demand response programs, and efficient grid management. Moreover, these devices enable the seamless transfer of data, supporting functions like remote monitoring, control, and secure data transmission.
The aerospace and defence segment is expected to have the highest CAGR during the forecast period
The aerospace and defence segment is anticipated to have lucrative growth during the forecast period. The aerospace and defense industries leverage digital utilities to enhance communication, data security, and strategic decision-making. Furthermore, the integration of secure communication networks ensures reliable and encrypted data transfer, which is vital for military operations and national security. Digital utilities aid in optimizing resource management, streamlining logistics, and enhancing situational awareness.
Region with largest share:
North America commanded the largest market share during the extrapolated period owing to rapid urbanization, burgeoning populations, and increasing energy demand. Smart grid implementations, including advanced metering systems and distribution automation, have become prevalent across the region, allowing utilities to optimize grid operations and improve service reliability. As the region continues to evolve, utilities are leveraging digital advancements to meet rising energy demands and contribute to a sustainable energy landscape.
Region with highest CAGR:
Asia Pacific is expected to witness profitable growth over the projection period. The Asia-Pacific digital utility market is characterized by a strong emphasis on renewable energy integration. As countries in the region undergo rapid urbanization and economic growth, utilities are increasingly turning to digital solutions to modernize their infrastructure and improve operational efficiency. Moreover, the deployment of Internet of Things (IoT) devices and sensors further contributes to real-time monitoring, predictive maintenance, and overall grid optimization.
Key players in the market
Some of the key players in the Digital Utility Market include Accenture PLC, Cisco Systems Inc., ABB Ltd., General Electric Company, Eaton Corporation PLC, Capgemini SA, Oracle Corporation, Schneider Electric SE, Oracle Corporation and Siemens AG.
Key Developments:
In Sep 2023, Microsoft and Oracle Expand Partnership to Deliver Oracle Database Services on Oracle Cloud Infrastructure in Microsoft Azure.
In July 2023, Schneider Electric, a leader in digital transformation of energy management and industrial automation has announced its collaboration with HCLTech, a leading global technology company to develop carbon-efficient solutions for data centers in the Asia Pacific (APAC) region.
In May 2023, Eaton is collaborating with BAE systems to develop EV technology solutions for the medium-duty truck market. The collaboration combines expertise to provide integrated electric vehicle system for the market, with a Class-7 pickup and delivery demonstration vehicle in development.
Networks Covered:
- Transmission & Distribution
- Generation
- Retail
Technologies Covered:
- Hardware
- Integrated Solutions
End Users Covered:
- Banking, Financial Services and Insurance (BFSI)
- Aerospace and Defence
- Transportation and Logistics
- Other End Users
Regions Covered:
- North America
- US
- Canada
- Mexico
- Europe
- Germany
- UK
- Italy
- France
- Spain
- Rest of Europe
- Asia Pacific
- Japan
- China
- India
- Australia
- New Zealand
- South Korea
- Rest of Asia Pacific
- South America
- Argentina
- Brazil
- Chile
- Rest of South America
- Middle East & Africa
- Saudi Arabia
- UAE
- Qatar
- South Africa
- Rest of Middle East & Africa
What our report offers:
- Market share assessments for the regional and country-level segments
- Strategic recommendations for the new entrants
- Covers Market data for the years 2021, 2022, 2023, 2026, and 2030
- Market Trends (Drivers, Constraints, Opportunities, Threats, Challenges, Investment Opportunities, and recommendations)
- Strategic recommendations in key business segments based on the market estimations
- Competitive landscaping mapping the key common trends
- Company profiling with detailed strategies, financials, and recent developments
- Supply chain trends mapping the latest technological advancements
Free Customization Offerings:
All the customers of this report will be entitled to receive one of the following free customization options:
- Company Profiling
- Comprehensive profiling of additional market players (up to 3)
- SWOT Analysis of key players (up to 3)
- Regional Segmentation
- Market estimations, Forecasts and CAGR of any prominent country as per the client's interest (Note: Depends on feasibility check)
- Competitive Benchmarking
- Benchmarking of key players based on product portfolio, geographical presence, and strategic alliances
Table of Contents
1 Executive Summary
2 Preface
- 2.1 Abstract
- 2.2 Stake Holders
- 2.3 Research Scope
- 2.4 Research Methodology
- 2.4.1 Data Mining
- 2.4.2 Data Analysis
- 2.4.3 Data Validation
- 2.4.4 Research Approach
- 2.5 Research Sources
- 2.5.1 Primary Research Sources
- 2.5.2 Secondary Research Sources
- 2.5.3 Assumptions
3 Market Trend Analysis
- 3.1 Introduction
- 3.2 Drivers
- 3.3 Restraints
- 3.4 Opportunities
- 3.5 Threats
- 3.6 Technology Analysis
- 3.7 End User Analysis
- 3.8 Emerging Markets
- 3.9 Impact of Covid-19
4 Porters Five Force Analysis
- 4.1 Bargaining power of suppliers
- 4.2 Bargaining power of buyers
- 4.3 Threat of substitutes
- 4.4 Threat of new entrants
- 4.5 Competitive rivalry
5 Global Digital Utility Market, By Network
- 5.1 Introduction
- 5.2 Transmission & Distribution
- 5.3 Generation
- 5.4 Retail
6 Global Digital Utility Market, By Technology
- 6.1 Introduction
- 6.2 Hardware
- 6.2.1 Transformers
- 6.2.2 Smart Grids
- 6.2.3 Transformers
- 6.3 Integrated Solutions
- 6.3.1 Service
- 6.3.2 Cloud and Software
7 Global Digital Utility Market, By End User
- 7.1 Introduction
- 7.2 Banking, Financial Services and Insurance (BFSI)
- 7.3 Aerospace and Defence
- 7.4 Transportation and Logistics
- 7.5 Other End Users
8 Global Digital Utility Market, By Geography
- 8.1 Introduction
- 8.2 North America
- 8.2.1 US
- 8.2.2 Canada
- 8.2.3 Mexico
- 8.3 Europe
- 8.3.1 Germany
- 8.3.2 UK
- 8.3.3 Italy
- 8.3.4 France
- 8.3.5 Spain
- 8.3.6 Rest of Europe
- 8.4 Asia Pacific
- 8.4.1 Japan
- 8.4.2 China
- 8.4.3 India
- 8.4.4 Australia
- 8.4.5 New Zealand
- 8.4.6 South Korea
- 8.4.7 Rest of Asia Pacific
- 8.5 South America
- 8.5.1 Argentina
- 8.5.2 Brazil
- 8.5.3 Chile
- 8.5.4 Rest of South America
- 8.6 Middle East & Africa
- 8.6.1 Saudi Arabia
- 8.6.2 UAE
- 8.6.3 Qatar
- 8.6.4 South Africa
- 8.6.5 Rest of Middle East & Africa
9 Key Developments
- 9.1 Agreements, Partnerships, Collaborations and Joint Ventures
- 9.2 Acquisitions & Mergers
- 9.3 New Product Launch
- 9.4 Expansions
- 9.5 Other Key Strategies
10 Company Profiling
- 10.1 Accenture PLC
- 10.2 Cisco Systems Inc.
- 10.3 ABB Ltd.
- 10.4 General Electric Company
- 10.5 Eaton Corporation PLC
- 10.6 Capgemini SA
- 10.7 Oracle Corporation
- 10.8 Schneider Electric SE
- 10.9 Oracle Corporation
- 10.10 Siemens AG

