|
|
市場調査レポート
商品コード
1324380
プロジェクトロジスティクス市場の2030年までの予測:サービス別、エンドユーザー別、地域別の世界分析Project Logistics Market Forecasts to 2030 - Global Analysis By Service (Transportation, Forwarding and Other Services), End User (Mining and resources, Oil and gas, Construction, Defense and Other End Users) and By Geography |
||||||
|
|
|||||||
カスタマイズ可能
|
|||||||


| プロジェクトロジスティクス市場の2030年までの予測:サービス別、エンドユーザー別、地域別の世界分析 |
|
出版日: 2023年08月01日
発行: Stratistics Market Research Consulting
ページ情報: 英文 175+ Pages
納期: 2~3営業日
|

- 全表示
- 概要
- 図表
- 目次
Stratistics MRCによると、世界のプロジェクトロジスティクス市場は2023年に224億5,000万米ドルを占め、予測期間中のCAGRは5.26%で成長し、2030年には321億5,000万米ドルに達すると予想されています。
商品、資材、情報の流れ全体の計画、手配、管理、処理、制御はすべて、プロジェクトロジスティクスの統合プロセスの一部です。これらはプロジェクトの成功に関係しています。通常とは異なる寸法の貨物を管理することは、運送業者にとって決して容易なことではないです。サイズの大きな貨物は、まったく異なるインフラ、従業員、設備を使用する必要があります。とはいえ、荷主やサービス・プロバイダーは、大型貨物や重量貨物の輸送に徐々に習熟しつつあります。
中国国際請負業者協会によると、2017年だけで中国の請負業者は一帯一路に沿って7,217件の建設契約を締結し、世界全体で13,267件の建設契約を締結しました。
再生可能エネルギーの利用拡大
世界が持続可能なエネルギー源へと移行するにつれ、風力発電所、ソーラーパーク、水力発電所などの再生可能エネルギー・プロジェクトの建設・設置に対する需要が高まっています。これらのプロジェクトでは、風力タービンのブレード、ソーラーパネル、水力発電タービンなど、大型で重い部品をさまざまな場所に輸送することがよくあります。プロジェクトロジスティクス・プロバイダーは、こうした大型部品の移動を調整し、プロジェクト現場へのタイムリーな配送を確保する上で重要な役割を果たしています。再生可能エネルギー開発への注目の高まりは、プロジェクトロジスティクス企業に有利な機会を生み出し、技術革新と投資を促進しています。
複雑な規制
企業は、絶え間なく進化し、国境を越え、複数の国が関与する複数の規制の枠組みをナビゲートしなければならないです。安全要件、環境規則、通関プロセス、文書化要件を遵守するのは困難で時間がかかります。これらのルールに違反した場合、ロジスティクス活動は遅延、罰金、その他の妨害を受ける可能性があります。さらに問題を難しくしているのは、国によって法律が矛盾していたり、不明瞭だったりすることです。プロジェクトロジスティクス・サプライヤーは、この制約を回避するために、規制の変更に常に対応し、シームレスなコンプライアンスを保証し、迅速かつ効率的なプロジェクト配送を維持するために、熟練したスタッフとテクノロジーに投資する必要があります。
自動車業界からのプロジェクトロジスティクスへのニーズの高まり
国際的なサプライチェーンを通じた機械、完成品、自動車部品の輸送は、自動車産業における効果的で信頼できるロジスティクス・サービスの主要な機能です。電気自動車や 促進要因レス技術のイントロダクションを含む、自動車セクターの大幅な改良に伴い、専門的な輸送・ハンドリングソリューションへの需要が高まっています。自動車メーカーの拡大する活動を支援する専門サービスを提供することで、プロジェクトロジスティクスプロバイダーはこの動向から利益を得ることができます。企業は、その知識を活用し、完璧なロジスティクスソリューションを提供することで、自動車業界の顧客と強固な関係を築くことができます。
高い投資と運営コスト
プロジェクトロジスティクスの性質上、特大貨物や重量貨物を取り扱うことが多く、特殊な設備や専門知識が必要となるため、多額の先行投資が必要となります。また、規制への対応、多様な輸送手段の管理、困難な地形での交渉など、プロジェクトロジスティクスの業務が複雑であるため、運営コストが高くなります。こうした高コストは、特に競合入札プロセスにおいて、利益率を圧迫する可能性があります。さらに、プロジェクトの遅延や予期せぬ課題がコスト超過につながり、プロジェクトロジスティクス・プロバイダーの財務的な実行可能性に影響を与えることもあります。
COVID-19の影響:
COVID-19の流行は、貨物の輸送、備蓄、流通に携わるプロジェクトロジスティクスに直接的な影響を及ぼしています。したがって、パンデミックによってもたらされた産業ネットワークの混乱は、強度、経済成長、雇用創出に影響を及ぼす可能性があります。しかし、国の操業停止が支援された場合、その地域は回復するのが一般的です。プロジェクト戦略は最終的に、多くの企業が義務を遂行し、以前の活動レベルに戻るかどうかにかかっています。一般的な封鎖の結果、重要な創造オフィスが閉鎖され、あらゆる組立エリアのサプライチェーンに深刻な混乱が生じています。遅延や旅行の混乱が発生したため、世界の道路業者が増加しました。
予測期間中、輸送部門が最大となる見込み
輸送部門が市場で最大のシェアを占めています。遠隔地や困難な地域を含むことが多いプロジェクト物資を、タイムリーかつ確実に目的地に届けるには、効率的な輸送が不可欠です。さまざまなプロジェクト要件に対応するため、同市場はトラック、船舶、航空機、特殊な重量物運搬機器など、さまざまな輸送手段に依存しています。国境を越えたスムーズな輸送を確保するため、プロジェクトロジスティクス・サプライヤーは、複数の国の複雑な規制や税関の枠組みも管理しなければならないです。熾烈なプロジェクトロジスティクス分野において、効率的な輸送管理はプロジェクトの成功、コストの最小化、顧客満足のために極めて重要です。
予測期間中、石油・ガス分野のCAGRが最も高くなる見込み
予測期間中、石油・ガス分野のCAGRが最も高くなると予想されます。石油・ガスプロジェクトでは、掘削リグ、パイプライン、海洋構造物などの巨大な重機を、しばしば困難な地形や遠隔地にわたって輸送する必要があります。プロジェクトロジスティクス・プロバイダーは、製造施設からプロジェクト現場まで、こうした大型部品の移動を調整する上で重要な役割を果たしています。ロジスティクス・プロバイダーは、厳格な安全・環境規制の遵守を保証するとともに、海上・航空輸送、重量物運搬、特殊なハンドリングなどの複雑なロジスティクス業務を管理します。
最大のシェアを占める地域:
急速な工業化、都市化、インフラ開拓に伴い、同地域ではプロジェクトロジスティクス・サービスに対する需要が高まっています。石油・ガス、エネルギー、建設、製造などの産業においてアジア太平洋地域は重要な役割を担っているため、重量貨物や大型貨物の輸送ニーズが高まっています。同地域のプロジェクトロジスティクス・プロバイダーは、多様な地勢、厳しい気象条件、複数の国にまたがるさまざまな規制状況を乗り切らなければならないです。また、この地域の戦略的立地は世界貿易の重要なハブとなっており、効率的なプロジェクトロジスティクス・ソリューションの需要をさらに押し上げています。
CAGRが最も高い地域:
予測期間中、北米地域の成長率が最も高いと予想されます。堅調な経済と大規模なインフラプロジェクトにより、この地域は効率的で信頼性の高いプロジェクトロジスティクス・サービスに対する安定した需要を目の当たりにしています。北米の広大な地域と多様な地形は独自の課題をもたらし、大型貨物の移動に特化したロジスティクス・ソリューションが必要となります。この地域のプロジェクトロジスティクス・プロバイダーは、複雑なロジスティクス業務を遂行する一方で、厳格な安全・環境規制を遵守しなければならないです。北米の戦略的立地と強力な貿易関係も、プロジェクトロジスティクスの重要なハブとなっており、北米の有利な市場機会を利用しようとする地域および国際的な事業者を惹きつけています。
無料カスタマイズサービス:
本レポートをご購読のお客様には、以下のいずれかの無料カスタマイズオプションをご提供いたします:
- 企業プロファイル
- 追加市場プレイヤーの包括的プロファイリング(3社まで)
- 主要企業のSWOT分析(3社まで)
- 地域セグメンテーション
- 顧客の関心に応じた主要国の市場推計・予測・CAGR(注:フィージビリティチェックによる)
- 競合ベンチマーキング
- 製品ポートフォリオ、地理的プレゼンス、戦略的提携に基づく主要企業のベンチマーキング
目次
第1章 エグゼクティブサマリー
第2章 序文
- 概要
- ステークホルダー
- 調査範囲
- 調査手法
- データマイニング
- データ分析
- データ検証
- 調査アプローチ
- 調査ソース
- 1次調査ソース
- 2次調査ソース
- 仮定
第3章 市場動向分析
- 促進要因
- 抑制要因
- 機会
- 脅威
- エンドユーザー分析
- 新興市場
- 新型コロナウイルス感染症(COVID-19)の影響
第4章 ポーターのファイブフォース分析
- 供給企業の交渉力
- 買い手の交渉力
- 代替品の脅威
- 新規参入業者の脅威
- 競争企業間の敵対関係
第5章 世界のプロジェクトロジスティクス市場:サービス別
- 輸送機関
- 道路
- 水路
- 空路
- 鉄道
- フォワーディング
- 在庫管理と倉庫保管
- その他のサービス
第6章 世界のプロジェクトロジスティクス市場:エンドユーザー別
- 鉱業と資源
- 石油・ガス
- 建設
- 防衛
- 再生可能エネルギー
- 製造業
- 農業用品
- 政府
- その他のエンドユーザー
第7章 世界のプロジェクトロジスティクス市場:地域別
- 北米
- 米国
- カナダ
- メキシコ
- 欧州
- ドイツ
- 英国
- イタリア
- フランス
- スペイン
- その他欧州
- アジア太平洋地域
- 日本
- 中国
- インド
- オーストラリア
- ニュージーランド
- 韓国
- その他アジア太平洋地域
- 南米
- アルゼンチン
- ブラジル
- チリ
- その他南米
- 中東とアフリカ
- サウジアラビア
- アラブ首長国連邦
- カタール
- 南アフリカ
- その他中東とアフリカ
第8章 主な発展
- 契約、パートナーシップ、コラボレーション、合弁事業
- 買収と合併
- 新製品の発売
- 事業拡大
- その他の主要戦略
第9章 会社概要
- Agility Logistics
- Bema International Pte. Ltd.
- Bollore Logistics
- BT Transport & Logistics
- Ceva Logistics
- CH Robinson Worldwide Inc.
- Chu Kong Logistics
- Expro
- Freight Tiger
- Hellmann Worldwide Logistics
- Indo Trans Logistics Corporation
- Kuehne+Nagel International AG
- LF Logistics
- Panalpina
- Rhenus Logistics
- Rohlig Logistics
- Ryder System Inc.
- Tiger logistics Ltd.
List of Tables
- Table 1 Global Project Logistics Market Outlook, By Region (2021-2030) ($MN)
- Table 2 Global Project Logistics Market Outlook, By Component (2021-2030) ($MN)
- Table 3 Global Project Logistics Market Outlook, By Transportation (2021-2030) ($MN)
- Table 4 Global Project Logistics Market Outlook, By Roadways (2021-2030) ($MN)
- Table 5 Global Project Logistics Market Outlook, By Waterways (2021-2030) ($MN)
- Table 6 Global Project Logistics Market Outlook, By Airways (2021-2030) ($MN)
- Table 7 Global Project Logistics Market Outlook, By Railways (2021-2030) ($MN)
- Table 8 Global Project Logistics Market Outlook, By Forwarding (2021-2030) ($MN)
- Table 9 Global Project Logistics Market Outlook, By Inventory Management and Warehousing (2021-2030) ($MN)
- Table 10 Global Project Logistics Market Outlook, By Other Services (2021-2030) ($MN)
- Table 11 Global Project Logistics Market Outlook, By End User (2021-2030) ($MN)
- Table 12 Global Project Logistics Market Outlook, By Mining and Resources (2021-2030) ($MN)
- Table 13 Global Project Logistics Market Outlook, By Oil and Gas (2021-2030) ($MN)
- Table 14 Global Project Logistics Market Outlook, By Construction (2021-2030) ($MN)
- Table 15 Global Project Logistics Market Outlook, By Defense (2021-2030) ($MN)
- Table 16 Global Project Logistics Market Outlook, By Renewable Energy (2021-2030) ($MN)
- Table 19 Global Project Logistics Market Outlook, By Manufacturing (2021-2030) ($MN)
- Table 20 Global Project Logistics Market Outlook, By Agricultural Supplies (2021-2030) ($MN)
- Table 21 Global Project Logistics Market Outlook, By Government (2021-2030) ($MN)
- Table 22 Global Project Logistics Market Outlook, By Other End Users (2021-2030) ($MN)
- Table 23 North America Project Logistics Market Outlook, By Country (2021-2030) ($MN)
- Table 24 North America Project Logistics Market Outlook, By Component (2021-2030) ($MN)
- Table 25 North America Project Logistics Market Outlook, By Transportation (2021-2030) ($MN)
- Table 26 North America Project Logistics Market Outlook, By Roadways (2021-2030) ($MN)
- Table 27 North America Project Logistics Market Outlook, By Waterways (2021-2030) ($MN)
- Table 28 North America Project Logistics Market Outlook, By Airways (2021-2030) ($MN)
- Table 29 North America Project Logistics Market Outlook, By Railways (2021-2030) ($MN)
- Table 30 North America Project Logistics Market Outlook, By Forwarding (2021-2030) ($MN)
- Table 31 North America Project Logistics Market Outlook, By Inventory Management and Warehousing (2021-2030) ($MN)
- Table 32 North America Project Logistics Market Outlook, By Other Services (2021-2030) ($MN)
- Table 33 North America Project Logistics Market Outlook, By End User (2021-2030) ($MN)
- Table 34 North America Project Logistics Market Outlook, By Mining and Resources (2021-2030) ($MN)
- Table 35 North America Project Logistics Market Outlook, By Oil and Gas (2021-2030) ($MN)
- Table 36 North America Project Logistics Market Outlook, By Construction (2021-2030) ($MN)
- Table 37 North America Project Logistics Market Outlook, By Defense (2021-2030) ($MN)
- Table 38 North America Project Logistics Market Outlook, By Renewable Energy (2021-2030) ($MN)
- Table 41 North America Project Logistics Market Outlook, By Manufacturing (2021-2030) ($MN)
- Table 42 North America Project Logistics Market Outlook, By Agricultural Supplies (2021-2030) ($MN)
- Table 43 North America Project Logistics Market Outlook, By Government (2021-2030) ($MN)
- Table 44 North America Project Logistics Market Outlook, By Other End Users (2021-2030) ($MN)
- Table 45 Europe Project Logistics Market Outlook, By Country (2021-2030) ($MN)
- Table 46 Europe Project Logistics Market Outlook, By Component (2021-2030) ($MN)
- Table 47 Europe Project Logistics Market Outlook, By Transportation (2021-2030) ($MN)
- Table 48 Europe Project Logistics Market Outlook, By Roadways (2021-2030) ($MN)
- Table 49 Europe Project Logistics Market Outlook, By Waterways (2021-2030) ($MN)
- Table 50 Europe Project Logistics Market Outlook, By Airways (2021-2030) ($MN)
- Table 51 Europe Project Logistics Market Outlook, By Railways (2021-2030) ($MN)
- Table 52 Europe Project Logistics Market Outlook, By Forwarding (2021-2030) ($MN)
- Table 53 Europe Project Logistics Market Outlook, By Inventory Management and Warehousing (2021-2030) ($MN)
- Table 54 Europe Project Logistics Market Outlook, By Other Services (2021-2030) ($MN)
- Table 55 Europe Project Logistics Market Outlook, By End User (2021-2030) ($MN)
- Table 56 Europe Project Logistics Market Outlook, By Mining and Resources (2021-2030) ($MN)
- Table 57 Europe Project Logistics Market Outlook, By Oil and Gas (2021-2030) ($MN)
- Table 58 Europe Project Logistics Market Outlook, By Construction (2021-2030) ($MN)
- Table 59 Europe Project Logistics Market Outlook, By Defense (2021-2030) ($MN)
- Table 60 Europe Project Logistics Market Outlook, By Renewable Energy (2021-2030) ($MN)
- Table 63 Europe Project Logistics Market Outlook, By Manufacturing (2021-2030) ($MN)
- Table 64 Europe Project Logistics Market Outlook, By Agricultural Supplies (2021-2030) ($MN)
- Table 65 Europe Project Logistics Market Outlook, By Government (2021-2030) ($MN)
- Table 66 Europe Project Logistics Market Outlook, By Other End Users (2021-2030) ($MN)
- Table 67 Asia Pacific Project Logistics Market Outlook, By Country (2021-2030) ($MN)
- Table 68 Asia Pacific Project Logistics Market Outlook, By Component (2021-2030) ($MN)
- Table 69 Asia Pacific Project Logistics Market Outlook, By Transportation (2021-2030) ($MN)
- Table 70 Asia Pacific Project Logistics Market Outlook, By Roadways (2021-2030) ($MN)
- Table 71 Asia Pacific Project Logistics Market Outlook, By Waterways (2021-2030) ($MN)
- Table 72 Asia Pacific Project Logistics Market Outlook, By Airways (2021-2030) ($MN)
- Table 73 Asia Pacific Project Logistics Market Outlook, By Railways (2021-2030) ($MN)
- Table 74 Asia Pacific Project Logistics Market Outlook, By Forwarding (2021-2030) ($MN)
- Table 75 Asia Pacific Project Logistics Market Outlook, By Inventory Management and Warehousing (2021-2030) ($MN)
- Table 76 Asia Pacific Project Logistics Market Outlook, By Other Services (2021-2030) ($MN)
- Table 77 Asia Pacific Project Logistics Market Outlook, By End User (2021-2030) ($MN)
- Table 78 Asia Pacific Project Logistics Market Outlook, By Mining and Resources (2021-2030) ($MN)
- Table 79 Asia Pacific Project Logistics Market Outlook, By Oil and Gas (2021-2030) ($MN)
- Table 80 Asia Pacific Project Logistics Market Outlook, By Construction (2021-2030) ($MN)
- Table 81 Asia Pacific Project Logistics Market Outlook, By Defense (2021-2030) ($MN)
- Table 82 Asia Pacific Project Logistics Market Outlook, By Renewable Energy (2021-2030) ($MN)
- Table 85 Asia Pacific Project Logistics Market Outlook, By Manufacturing (2021-2030) ($MN)
- Table 86 Asia Pacific Project Logistics Market Outlook, By Agricultural Supplies (2021-2030) ($MN)
- Table 87 Asia Pacific Project Logistics Market Outlook, By Government (2021-2030) ($MN)
- Table 88 Asia Pacific Project Logistics Market Outlook, By Other End Users (2021-2030) ($MN)
- Table 89 South America Project Logistics Market Outlook, By Country (2021-2030) ($MN)
- Table 90 South America Project Logistics Market Outlook, By Component (2021-2030) ($MN)
- Table 91 South America Project Logistics Market Outlook, By Transportation (2021-2030) ($MN)
- Table 92 South America Project Logistics Market Outlook, By Roadways (2021-2030) ($MN)
- Table 93 South America Project Logistics Market Outlook, By Waterways (2021-2030) ($MN)
- Table 94 South America Project Logistics Market Outlook, By Airways (2021-2030) ($MN)
- Table 95 South America Project Logistics Market Outlook, By Railways (2021-2030) ($MN)
- Table 96 South America Project Logistics Market Outlook, By Forwarding (2021-2030) ($MN)
- Table 97 South America Project Logistics Market Outlook, By Inventory Management and Warehousing (2021-2030) ($MN)
- Table 98 South America Project Logistics Market Outlook, By Other Services (2021-2030) ($MN)
- Table 99 South America Project Logistics Market Outlook, By End User (2021-2030) ($MN)
- Table 100 South America Project Logistics Market Outlook, By Mining and Resources (2021-2030) ($MN)
- Table 101 South America Project Logistics Market Outlook, By Oil and Gas (2021-2030) ($MN)
- Table 102 South America Project Logistics Market Outlook, By Construction (2021-2030) ($MN)
- Table 103 South America Project Logistics Market Outlook, By Defense (2021-2030) ($MN)
- Table 104 South America Project Logistics Market Outlook, By Renewable Energy (2021-2030) ($MN)
- Table 107 South America Project Logistics Market Outlook, By Manufacturing (2021-2030) ($MN)
- Table 108 South America Project Logistics Market Outlook, By Agricultural Supplies (2021-2030) ($MN)
- Table 109 South America Project Logistics Market Outlook, By Government (2021-2030) ($MN)
- Table 110 South America Project Logistics Market Outlook, By Other End Users (2021-2030) ($MN)
- Table 111 Middle East & Africa Project Logistics Market Outlook, By Country (2021-2030) ($MN)
- Table 112 Middle East & Africa Project Logistics Market Outlook, By Component (2021-2030) ($MN)
- Table 113 Middle East & Africa Project Logistics Market Outlook, By Transportation (2021-2030) ($MN)
- Table 114 Middle East & Africa Project Logistics Market Outlook, By Roadways (2021-2030) ($MN)
- Table 115 Middle East & Africa Project Logistics Market Outlook, By Waterways (2021-2030) ($MN)
- Table 116 Middle East & Africa Project Logistics Market Outlook, By Airways (2021-2030) ($MN)
- Table 117 Middle East & Africa Project Logistics Market Outlook, By Railways (2021-2030) ($MN)
- Table 118 Middle East & Africa Project Logistics Market Outlook, By Forwarding (2021-2030) ($MN)
- Table 119 Middle East & Africa Project Logistics Market Outlook, By Inventory Management and Warehousing (2021-2030) ($MN)
- Table 120 Middle East & Africa Project Logistics Market Outlook, By Other Services (2021-2030) ($MN)
- Table 121 Middle East & Africa Project Logistics Market Outlook, By End User (2021-2030) ($MN)
- Table 122 Middle East & Africa Project Logistics Market Outlook, By Mining and Resources (2021-2030) ($MN)
- Table 123 Middle East & Africa Project Logistics Market Outlook, By Oil and Gas (2021-2030) ($MN)
- Table 124 Middle East & Africa Project Logistics Market Outlook, By Construction (2021-2030) ($MN)
- Table 125 Middle East & Africa Project Logistics Market Outlook, By Defense (2021-2030) ($MN)
- Table 126 Middle East & Africa Project Logistics Market Outlook, By Renewable Energy (2021-2030) ($MN)
- Table 129 Middle East & Africa Project Logistics Market Outlook, By Manufacturing (2021-2030) ($MN)
- Table 130 Middle East & Africa Project Logistics Market Outlook, By Agricultural Supplies (2021-2030) ($MN)
- Table 131 Middle East & Africa Project Logistics Market Outlook, By Government (2021-2030) ($MN)
- Table 132 Middle East & Africa Project Logistics Market Outlook, By Other End Users (2021-2030) ($MN)
According to Stratistics MRC, the Global Project Logistics Market is accounted for $22.45 billion in 2023 and is expected to reach $32.15 billion by 2030 growing at a CAGR of 5.26% during the forecast period. Planning, arranging, managing, processing, and controlling the entire flow of commodities, materials, and information are all part of the integrated process of project logistics. These are related to a project's successful conclusion. Managing freight with unusual dimensions is never easy for a transporter. Larger-sized cargo necessitates the use of entirely different infrastructure, employees, and equipment. Shippers and service providers are, nevertheless, gradually becoming more skilled in the transportation of big and heavyweight shipments.
According to the China International Contractors Association, in 2017 alone, Chinese contractors concluded 7,217 construction contracts along the Belt and Road and 13,267 construction contracts globally
Market Dynamics:
Driver:
Growing use of renewable energy sources
As the world transitions towards sustainable energy sources, there is a growing demand for the construction and installation of renewable energy projects, such as wind farms, solar parks, and hydroelectric plants. These projects often involve the transportation of large and heavy components, including wind turbine blades, solar panels, and hydroelectric turbines, across various locations. Project logistics providers play a crucial role in coordinating the movement of these oversized components, ensuring their timely delivery to project sites. The rising focus on renewable energy development creates lucrative opportunities for project logistics companies, driving innovation and investments.
Restraint:
Complex regulations
Companies must navigate through several regulatory frameworks that are constantly evolving and crossing international borders and engaging multiple countries. It becomes difficult and time-consuming to comply with safety requirements, environmental rules, customs processes, and documentation requirements. If these rules are broken, logistics activities may be delayed, fined, or otherwise interfered with. To make matters more difficult, different nations may have contradictory or unclear legislation. Project logistics suppliers need to invest in skilled staff and technology to stay up to date on regulatory changes, assure seamless compliance, and maintain fast and efficient project deliveries in order to get around this constraint.
Opportunity:
Increasing need from the automobile industry for project logistics
The transportation of machinery, completed goods, and car components through international supply chains is a major function of effective and dependable logistics services in the automotive industry. The demand for specialized transportation and handling solutions grows as the automobile sector experiences significant improvements, including the introduction of electric vehicles and driverless technologies. By providing specialized services to assist the expanding activities of car manufacturers, project logistics providers can profit from this trend. Companies may build solid relationships with automotive clients by utilizing their knowledge and offering flawless logistics solutions, which will spur growth and provide them a competitive edge in the project logistics industry.
Threat:
High investments and operational costs
The nature of project logistics often involves handling oversized and heavy cargo, which requires specialized equipment and expertise, leading to substantial upfront investments. Higher operating costs are also a result of the complexity of project logistics operations, including regulatory compliance, managing a variety of transportation modalities, and negotiating difficult terrain. These high costs can put pressure on profit margins, especially during competitive bidding processes. Moreover, project delays or unforeseen challenges can lead to cost overruns, impacting project logistics providers' financial viability.
COVID-19 Impact:
The COVID-19 pandemic has straightforwardly affected project logistics, which are engaged with the transit, stockpiling, and stream of wares. Thus, industrial network disruptions brought on by the pandemic could have an impact on intensity, economic growth, and job creation. However, when the country's shutdown is aided, it is typical for the area to recover. Project strategies ultimately depend on many firms carrying out their obligations and returning to their previous levels of activity. Significant creation offices have closed as a result of the general lockdown, seriously disrupting the supply chain in every assembly area. Because of the development of delays and travel disruption, the global road providers have risen.
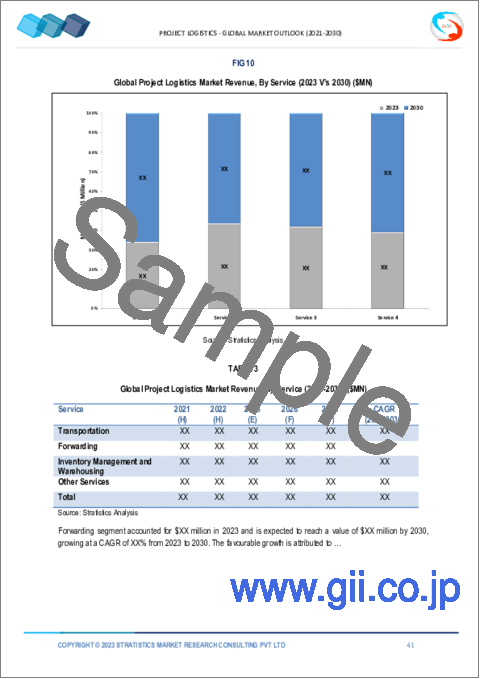
The transportation segment is expected to be the largest during the forecast period
The transportation segment held the largest share in the market. The timely and secure delivery of project goods to its destination, which frequently involves remote or difficult areas, depends on efficient transportation. To meet the needs of various project requirements, the market relies on a variety of transportation methods, including trucks, ships, airplanes, and specialized heavy-lift equipment. To ensure smooth cross-border transportation, project logistics suppliers must also manage the complex regulatory and customs frameworks of several nations. In the cutthroat project logistics sector, efficient transportation management is crucial for project success, cost minimization, and client satisfaction.
The oil and gas segment is expected to have the highest CAGR during the forecast period
During the projection period, the oil and gas segment is expected to have the greatest CAGR. Oil and gas projects involve transporting massive and heavy equipment, such as drilling rigs, pipelines, and offshore structures, often across challenging terrains and remote locations. Project logistics providers play a critical role in coordinating the movement of these oversized components from manufacturing facilities to project sites. They ensure compliance with strict safety and environmental regulations, as well as manage complex logistics operations, including sea and air transportation, heavy-lift operations, and specialized handling.
Region with largest share:
The Asia Pacific region market is estimated to witness the highest share of the global Project Logistics market during the forecast period, with rapid industrialization, urbanization, and infrastructural development, there is a growing demand for project logistics services in the region. Asia Pacific's significant role in industries like oil and gas, energy, construction, and manufacturing drives the need for transporting heavy and oversized cargo. Project logistics providers in the region must navigate diverse terrains, challenging weather conditions, and varying regulatory landscapes across multiple countries. The region's strategic location also makes it a critical hub for global trade, further boosting demand for efficient project logistics solutions.
Region with highest CAGR:
The North America region is expected to have the highest growth rate over the forecast period. With a robust economy and extensive infrastructure projects, the region witnesses a steady demand for efficient and reliable project logistics services. North America's vast geography and diverse terrain present unique challenges, necessitating specialized logistics solutions for oversized cargo movements. Project logistics providers in the region must adhere to stringent safety and environmental regulations while executing complex logistics operations. The region's strategic location and strong trade relationships also make it a significant hub for project logistics, attracting both regional and international players seeking to capitalize on North America's lucrative market opportunities.
Key players in the market:
Some of the key players in Project Logistics market include: Agility Logistics, Bema International Pte. Ltd., Bollore Logistics, BT Transport & Logistics, Ceva Logistics, CH Robinson Worldwide Inc., Chu Kong Logistics, Expro, Freight Tiger, Hellmann Worldwide Logistics, Indo Trans Logistics Corporation, Kuehne + Nagel International AG, LF Logistics, Panalpina, Rhenus Logistics, Rohlig Logistics, Ryder System Inc. and Tiger logistics Ltd.
Key Developments:
In March 2022, Bollore Logistics successfully transported 30,000 ton of equipment from January to December 2021 for a solar farm project in the Atacama region of Chile.
In December 2021, NMT Global Project Logistics and Fortescue Metals Group (FMG) entrusted BBC Chartering to carry heavy-lift steel module structures, ancillary cargoes, and containers for the Iron Bridge project.
In April 2021, LaserShip Inc. agreed to acquire Western U.S. rival OnTrac Logistics Inc. in a $1.3 billion deal to expand the local last-mile delivery specialist's reach across a broader section of the United States at a time of booming e-commerce demand.
Services Covered:
- Transportation
- Forwarding
- Inventory Management and Warehousing
- Other Services
End Users Covered:
- Mining and Resources
- Oil and Gas
- Construction
- Defense
- Renewable Energy
- Oil and Gas, Mining, and Quarrying
- Energy and Power
- Manufacturing
- Agricultural Supplies
- Government
- Other End Users
Regions Covered:
- North America
- US
- Canada
- Mexico
- Europe
- Germany
- UK
- Italy
- France
- Spain
- Rest of Europe
- Asia Pacific
- Japan
- China
- India
- Australia
- New Zealand
- South Korea
- Rest of Asia Pacific
- South America
- Argentina
- Brazil
- Chile
- Rest of South America
- Middle East & Africa
- Saudi Arabia
- UAE
- Qatar
- South Africa
- Rest of Middle East & Africa
What our report offers:
- Market share assessments for the regional and country-level segments
- Strategic recommendations for the new entrants
- Covers Market data for the years 2021, 2022, 2023, 2026, and 2030
- Market Trends (Drivers, Constraints, Opportunities, Threats, Challenges, Investment Opportunities, and recommendations)
- Strategic recommendations in key business segments based on the market estimations
- Competitive landscaping mapping the key common trends
- Company profiling with detailed strategies, financials, and recent developments
- Supply chain trends mapping the latest technological advancements
Free Customization Offerings:
All the customers of this report will be entitled to receive one of the following free customization options:
- Company Profiling
- Comprehensive profiling of additional market players (up to 3)
- SWOT Analysis of key players (up to 3)
- Regional Segmentation
- Market estimations, Forecasts and CAGR of any prominent country as per the client's interest (Note: Depends on feasibility check)
- Competitive Benchmarking
- Benchmarking of key players based on product portfolio, geographical presence, and strategic alliances
Table of Contents
1 Executive Summary
2 Preface
- 2.1 Abstract
- 2.2 Stake Holders
- 2.3 Research Scope
- 2.4 Research Methodology
- 2.4.1 Data Mining
- 2.4.2 Data Analysis
- 2.4.3 Data Validation
- 2.4.4 Research Approach
- 2.5 Research Sources
- 2.5.1 Primary Research Sources
- 2.5.2 Secondary Research Sources
- 2.5.3 Assumptions
3 Market Trend Analysis
- 3.1 Introduction
- 3.2 Drivers
- 3.3 Restraints
- 3.4 Opportunities
- 3.5 Threats
- 3.6 End User Analysis
- 3.7 Emerging Markets
- 3.8 Impact of Covid-19
4 Porters Five Force Analysis
- 4.1 Bargaining power of suppliers
- 4.2 Bargaining power of buyers
- 4.3 Threat of substitutes
- 4.4 Threat of new entrants
- 4.5 Competitive rivalry
5 Global Project Logistics Market, By Service
- 5.1 Introduction
- 5.2 Transportation
- 5.2.1 Roadways
- 5.2.2 Waterways
- 5.2.3 Airways
- 5.2.4 Railways
- 5.3 Forwarding
- 5.4 Inventory Management and Warehousing
- 5.5 Other Services
6 Global Project Logistics Market, By End User
- 6.1 Introduction
- 6.2 Mining and Resources
- 6.3 Oil and Gas
- 6.4 Construction
- 6.5 Defense
- 6.6 Renewable Energy
- 6.7 Manufacturing
- 6.8 Agricultural Supplies
- 6.9 Government
- 6.10 Other End Users
7 Global Project Logistics Market, By Geography
- 7.1 Introduction
- 7.2 North America
- 7.2.1 US
- 7.2.2 Canada
- 7.2.3 Mexico
- 7.3 Europe
- 7.3.1 Germany
- 7.3.2 UK
- 7.3.3 Italy
- 7.3.4 France
- 7.3.5 Spain
- 7.3.6 Rest of Europe
- 7.4 Asia Pacific
- 7.4.1 Japan
- 7.4.2 China
- 7.4.3 India
- 7.4.4 Australia
- 7.4.5 New Zealand
- 7.4.6 South Korea
- 7.4.7 Rest of Asia Pacific
- 7.5 South America
- 7.5.1 Argentina
- 7.5.2 Brazil
- 7.5.3 Chile
- 7.5.4 Rest of South America
- 7.6 Middle East & Africa
- 7.6.1 Saudi Arabia
- 7.6.2 UAE
- 7.6.3 Qatar
- 7.6.4 South Africa
- 7.6.5 Rest of Middle East & Africa
8 Key Developments
- 8.1 Agreements, Partnerships, Collaborations and Joint Ventures
- 8.2 Acquisitions & Mergers
- 8.3 New Product Launch
- 8.4 Expansions
- 8.5 Other Key Strategies
9 Company Profiling
- 9.1 Agility Logistics
- 9.2 Bema International Pte. Ltd.
- 9.3 Bollore Logistics
- 9.4 BT Transport & Logistics
- 9.5 Ceva Logistics
- 9.6 CH Robinson Worldwide Inc.
- 9.7 Chu Kong Logistics
- 9.8 Expro
- 9.9 Freight Tiger
- 9.10 Hellmann Worldwide Logistics
- 9.11 Indo Trans Logistics Corporation
- 9.12 Kuehne + Nagel International AG
- 9.13 LF Logistics
- 9.14 Panalpina
- 9.15 Rhenus Logistics
- 9.16 Rohlig Logistics
- 9.17 Ryder System Inc.
- 9.18 Tiger logistics Ltd.
