|
|
市場調査レポート
商品コード
1209875
バイオマス発電の2028年までの市場予測- 原料、技術、エンドユーザー、地域別の世界分析Biomass Power Market Forecasts to 2028 - Global Analysis By Feedstock, Technology, End User and By Geography |
||||||
|
|
|||||||
|
● お客様のご希望に応じて、既存データの加工や未掲載情報(例:国別セグメント)の追加などの対応が可能です。 詳細はお問い合わせください。 |
|||||||


| バイオマス発電の2028年までの市場予測- 原料、技術、エンドユーザー、地域別の世界分析 |
|
出版日: 2023年01月01日
発行: Stratistics Market Research Consulting
ページ情報: 英文 175+ Pages
納期: 2~3営業日
|
- 全表示
- 概要
- 図表
- 目次
Stratistics MRCによると、バイオマス発電の世界市場は2022年に703億米ドルを占め、2028年には1543億2000万米ドルに達すると予測され、予測期間中に14%のCAGRで成長する見込みです。
バイオマス発電は、生物または非生物によって生成または生産されるエネルギーです。エネルギーに使用される最も一般的なバイオマス材料は、トウモロコシや大豆などの植物です。これらの生物からのエネルギーは、燃やして熱を作ったり、電気に変換したりすることができます。このバイオガスは、熱変換、ガス化、バイオ燃料、バイオ炭など、さまざまなプロセスでエネルギーを生産するために使用されます。これらのバイオマスは、水素や炭素などを豊富に含んでいます。バイオマスは、地球の炭素循環に不可欠な要素です。炭素循環とは、地球のあらゆる層の間で炭素が交換されるプロセスです。したがって、上記の要因が市場の成長を後押ししているのです。
BP Statistical Review of World Energy 2022によると、米国は1日当たり64万3,000バレルのバイオ燃料を生産し、前年の値と比較して約7.1%の増加となっています。
市場力学
促進要因
バイオマス発電の急速な普及
バイオマス発電は、経済発展や電力供給を改善するために、信頼性が高く、安価で、安全なエネルギー供給という政策目標を達成するために、世界中で導入が進んでいます。また、中国、インド、ブラジルなどの新興経済諸国では、急速な工業化が進み、エネルギー需要が増加しています。バイオマス資源を発電に利用することは、様々な政府や機関による戦略的イニシアティブの重要な一部を形成しています。これらのイニシアチブは、国のエネルギー経済を再編成し、全体の発電ミックスにおける再生可能エネルギーの割合を増加させることを目的としており、これが市場成長の原動力となっています。
抑制要因
代替となる再生可能エネルギー源の存在
太陽光や風力などの再生可能エネルギーは、活発な研究開発と巨大な資本投資により、より優れた代替エネルギーとして発展してきました。これらの代替エネルギー源は、バイオマス発電に比べ、発電量や運用コストの面で優れています。また、太陽光や風力は蓄電システムの進化により、継続的な電力供給が困難であることが克服されており、太陽光や風力エネルギーの低コスト化と普及がバイオマス発電市場の成長を阻害しています。
機会
規制の枠組み、政府の支援
発電会社や電力会社が環境に優しいバイオマス発電に切り替えるには、投資補助金や税制優遇を提供する規制の枠組みや政府の補助金・助成金制度が重要な役割を担います。さらに、バイオマスは、低コストの農業や林業の廃棄物や残渣を利用することで、保守的な電源と競合することができます。原料が高価な地域でも、バイオマスによる発電コストは石炭火力発電よりも競争力があり、バイオマスはオフグリッド電源として理想的であるため、世界のバイオマス発電市場の活性化につながる可能性があります。
脅威
バイオマス発電の季節性
バイオマス原料は季節変動が激しく、輸送・貯蔵の問題もあり、発電事業者にとって大きな課題となっています。バイオマス原料の入手しやすさは、栽培地域の気候条件や栽培期間に左右されます。さらに、バイオマス原料のコストは、気候条件や入手可能性に左右されます。さらに、バイオマスは湿潤な性質を持っているため、輸送や保管にコストがかかります。さらに、不足を避け、年間を通じて確実に入手できるようにするため、バイオマス・プラント事業者はバイオマス原料をストックする必要があり、水分量の増加を防ぐための特定の保管設備が必要です。
COVID-19の影響
コロナウイルスの大流行は、バイオマス発電の市場にマイナスの影響を及ぼします。大規模な送電容量のため、厳重な戸締り、商工業の操業停止、特定の政府による制限により、世界のバイオマス発電市場の開拓に大きな影響を及ぼしました。バイオガスおよびデリバティブの市場参入企業は、効率的な戦略に集中することで危機を乗り越えています。したがって、パンデミックは、バイオマス発電市場の成長を妨げています。
予測期間中、固体バイオ燃料セグメントが最大になると予想されます。
固体バイオ燃料セグメントは、熱生産または発電の燃料として使用される可能性があるその生物学的起源により、有利な成長を有すると推定されます。エネルギー統計では、固体バイオ燃料は、木炭、燃料用木材、木材残渣および製品別、黒液、バイオガス、動物廃棄物、その他の植物性材料および残渣、産業廃棄物の再生可能画分の合計に相当する製品集合体であるとされています。無害な物質が排出されるため、人間のがんや呼吸困難のリスクを減らすことができるという利点があります。さらに、地球温暖化のリスクを低減するため、環境に優しく、市場の成長を促進します。
予測期間中に最も高いCAGRが見込まれる燃焼分野
燃焼式は、病原体を減らすことで動物と人間の健康を守ることができるため、予測期間中に最も速いCAGRの成長を示すと予想されます。糞尿に含まれる栄養素を、生の糞尿と比較して植物が利用しやすい形に変換します。これにより、作物の生産性と収量を向上させることができます。農場で栄養分を再利用し、経済的・環境的に持続可能な食糧生産システムを構築します。さらに、大気中に放出される可能性のあるメタンガスを回収し、化石燃料のエネルギー使用を代替することによって、温室効果ガスの排出を削減し、それによって市場の成長を促進することができます。
最もシェアの高い地域
北米は、シェールガスの発見によりガス発電が盛んになり、過去10年間で石炭発電よりも高い成長率を示していることから、予測期間中に最大の市場シェアを占めると予想されます。北米の発電設備は、設置業者やシステムプロバイダーが主要機器を在庫として保有しています。北米は石炭火力への依存度が高いです。しかし、シェールガスの発見により、ガスによる発電が可能となり、石炭による発電よりも高い市場開拓が進んでいるため、市場の成長が加速しています。
CAGRが最も高い地域
2050年までにカーボンニュートラルを目指す欧州は、予測期間において最も高いCAGRを示すと予想されます。欧州連合は、パリ協定の一環として、バイオマス原料を空気とともに炉で直接燃焼させ、水を蒸気に変換することを公約しています。その蒸気で蒸気タービンを駆動し、発電します。今回試運転を行ったのは、フロリダ州、ジョージア州、カリフォルニア州、ハワイ州といった場所です。さらに、国内では384MWを超えるバイオマス発電プロジェクトが異なる開発フェーズにあります。これらの要因が、予測期間中に同国の市場成長を押し上げると予想されます。
主な発展
2022年11月、Babcock &Wilcoxは、韓国におけるバイオマス燃料を用いた水素生成施設について、BrightLoop(TM)技術を用いたバイオマス-水素プロジェクトの開発を検討する契約を締結したと発表。
2022年11月、アメアスコがアイルランドのコーク州西部にある風力発電所の買収を発表。
2020年12月、Babcock &WilcoxとChart Industriesが、B&WのBrightLoopTMテクノロジーとChartの水素液化および低温炭素回収装置と専門知識を活用した水素イノベーションで協業することになりました。このソリューションは、低炭素水素の経済的な生成を実現し、費用対効果の高い輸送可能な液体水素と二酸化炭素を供給するものです。
本レポートの内容
- 地域および国別セグメントの市場シェア評価
- 新規参入企業への戦略的提言
- 2020年、2021年、2022年、2025年、2028年の市場データを網羅
- 市場動向(促進要因・制約要因・機会・脅威・課題・投資機会・推奨事項)
- 市場推定に基づく、主要ビジネスセグメントにおける戦略的推奨事項
- 主要な共通トレンドをマッピングした競合情勢
- 詳細な戦略、財務、最近の開発状況を含む企業プロファイル
- 最新の技術的進歩をマッピングしたサプライチェーン動向
無料カスタマイズサービス
本レポートをご購読のお客様には、以下のカスタマイズオプションのいずれかを無償でご提供いたします。
- 企業プロファイル
- 追加市場プレイヤーの包括的なプロファイリング(最大3社まで)
- 主要プレイヤーのSWOT分析(3社まで)
- 地域別セグメンテーション
- お客様のご希望に応じた主要国の市場推計・予測・CAGR(注:フィージビリティチェックによります。)
- 競合ベンチマーキング
- 製品ポートフォリオ、地理的プレゼンス、戦略的提携に基づく主要プレイヤーのベンチマーキング
目次
第1章 エグゼクティブサマリー
第2章 序文
- 概要
- ステークホルダー
- 調査範囲
- 調査手法
- データマイニング
- データ分析
- データ検証
- 調査アプローチ
- 調査情報源
- 1次調査情報源
- 2次調査情報源
- 仮定
第3章 市場動向分析
- 促進要因
- 抑制要因
- 機会
- 脅威
- 技術分析
- エンドユーザー分析
- 新興市場
- COVID-19の影響
第4章 ポーターズファイブフォース分析
- 供給企業の交渉力
- 買い手の交渉力
- 代替品の脅威
- 新規参入業者の脅威
- 競争企業間の敵対関係
第5章 世界のバイオマス発電市場:原料別
- 固体バイオ燃料
- 液体バイオ燃料
- バイオガス
- その他の原料
第6章 世界のバイオマス発電市場:技術別
- 燃焼
- ガス化
- 嫌気性消化
- その他の技術
第7章 世界のバイオマス発電市場:エンドユーザー別
- 工業用
- 商業
- 住宅
- その他のエンドユーザー
第8章 世界のバイオマス発電市場:地域
- 北米
- 米国
- カナダ
- メキシコ
- 欧州
8.3,1ドイツ
- 英国
8.3,2イタリア
- フランス
8.3,3スペイン
- その他欧州
- アジア太平洋地域
- 日本
- 中国
- インド
- オーストラリア
- ニュージーランド
- 韓国
- その他アジア太平洋地域
- 南米
- アルゼンチン
- ブラジル
- チリ
- その他南米
- 中東とアフリカ
- サウジアラビア
- アラブ首長国連邦
- カタール
- 南アフリカ
- その他中東
第9章 主な発展
- 契約、パートナーシップ、コラボレーション、合弁事業
- 買収と合併
- 新製品の発売
- 事業拡大
- その他の主要戦略
第10章 企業プロファイル
- Babcock & Wilcox Company
- Ameresco
- Alstom SA
- Engie
- Indus Green Bio Energy Pvt. Ltd
- NTPC
- Oulun Energia Oy
- Acciona
- Helius Energy Plc
- DONG Energy A/S
- Fourth Partner Energy
- Alstom SA
- MGT Power Ltd.
- Vattenfall AB
- Drax Group plc
List of Tables
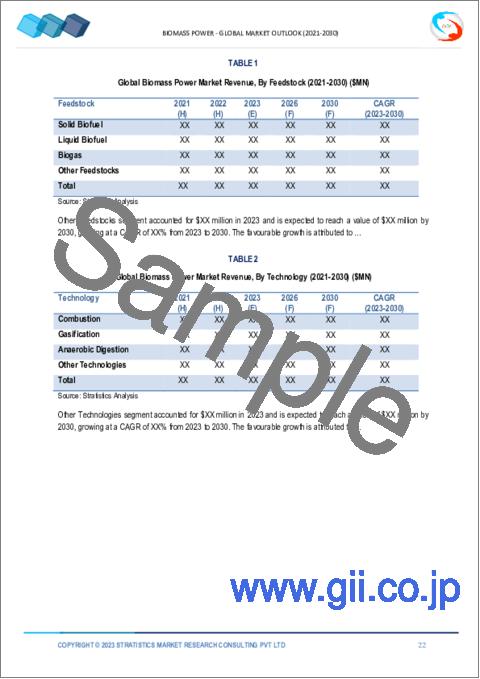
- Table 1 Global Biomass Power Market Outlook, By Region (2020-2028) ($MN)
- Table 2 Global Biomass Power Market Outlook, By Feedstock (2020-2028) ($MN)
- Table 3 Global Biomass Power Market Outlook, By Introduction (2020-2028) ($MN)
- Table 4 Global Biomass Power Market Outlook, By Solid Biofuel (2020-2028) ($MN)
- Table 5 Global Biomass Power Market Outlook, By Liquid Biofuel (2020-2028) ($MN)
- Table 6 Global Biomass Power Market Outlook, By Biogas (2020-2028) ($MN)
- Table 7 Global Biomass Power Market Outlook, By Other Feedstocks (2020-2028) ($MN)
- Table 8 Global Biomass Power Market Outlook, By Technology (2020-2028) ($MN)
- Table 9 Global Biomass Power Market Outlook, By Introduction (2020-2028) ($MN)
- Table 10 Global Biomass Power Market Outlook, By Combustion (2020-2028) ($MN)
- Table 11 Global Biomass Power Market Outlook, By Gasification (2020-2028) ($MN)
- Table 12 Global Biomass Power Market Outlook, By Anaerobic Digestion (2020-2028) ($MN)
- Table 13 Global Biomass Power Market Outlook, By Other Technologies (2020-2028) ($MN)
- Table 14 Global Biomass Power Market Outlook, By End User (2020-2028) ($MN)
- Table 15 Global Biomass Power Market Outlook, By Introduction (2020-2028) ($MN)
- Table 16 Global Biomass Power Market Outlook, By Industrial (2020-2028) ($MN)
- Table 17 Global Biomass Power Market Outlook, By Commercial (2020-2028) ($MN)
- Table 18 Global Biomass Power Market Outlook, By Residential (2020-2028) ($MN)
- Table 19 Global Biomass Power Market Outlook, By Other End Users (2020-2028) ($MN)
- Table 20 North America Biomass Power Market Outlook, By Country (2020-2028) ($MN)
- Table 21 North America Biomass Power Market Outlook, By Feedstock (2020-2028) ($MN)
- Table 22 North America Biomass Power Market Outlook, By Introduction (2020-2028) ($MN)
- Table 23 North America Biomass Power Market Outlook, By Solid Biofuel (2020-2028) ($MN)
- Table 24 North America Biomass Power Market Outlook, By Liquid Biofuel (2020-2028) ($MN)
- Table 25 North America Biomass Power Market Outlook, By Biogas (2020-2028) ($MN)
- Table 26 North America Biomass Power Market Outlook, By Other Feedstocks (2020-2028) ($MN)
- Table 27 North America Biomass Power Market Outlook, By Technology (2020-2028) ($MN)
- Table 28 North America Biomass Power Market Outlook, By Introduction (2020-2028) ($MN)
- Table 29 North America Biomass Power Market Outlook, By Combustion (2020-2028) ($MN)
- Table 30 North America Biomass Power Market Outlook, By Gasification (2020-2028) ($MN)
- Table 31 North America Biomass Power Market Outlook, By Anaerobic Digestion (2020-2028) ($MN)
- Table 32 North America Biomass Power Market Outlook, By Other Technologies (2020-2028) ($MN)
- Table 33 North America Biomass Power Market Outlook, By End User (2020-2028) ($MN)
- Table 34 North America Biomass Power Market Outlook, By Introduction (2020-2028) ($MN)
- Table 35 North America Biomass Power Market Outlook, By Industrial (2020-2028) ($MN)
- Table 36 North America Biomass Power Market Outlook, By Commercial (2020-2028) ($MN)
- Table 37 North America Biomass Power Market Outlook, By Residential (2020-2028) ($MN)
- Table 38 North America Biomass Power Market Outlook, By Other End Users (2020-2028) ($MN)
- Table 39 Europe Biomass Power Market Outlook, By Country (2020-2028) ($MN)
- Table 40 Europe Biomass Power Market Outlook, By Feedstock (2020-2028) ($MN)
- Table 41 Europe Biomass Power Market Outlook, By Introduction (2020-2028) ($MN)
- Table 42 Europe Biomass Power Market Outlook, By Solid Biofuel (2020-2028) ($MN)
- Table 43 Europe Biomass Power Market Outlook, By Liquid Biofuel (2020-2028) ($MN)
- Table 44 Europe Biomass Power Market Outlook, By Biogas (2020-2028) ($MN)
- Table 45 Europe Biomass Power Market Outlook, By Other Feedstocks (2020-2028) ($MN)
- Table 46 Europe Biomass Power Market Outlook, By Technology (2020-2028) ($MN)
- Table 47 Europe Biomass Power Market Outlook, By Introduction (2020-2028) ($MN)
- Table 48 Europe Biomass Power Market Outlook, By Combustion (2020-2028) ($MN)
- Table 49 Europe Biomass Power Market Outlook, By Gasification (2020-2028) ($MN)
- Table 50 Europe Biomass Power Market Outlook, By Anaerobic Digestion (2020-2028) ($MN)
- Table 51 Europe Biomass Power Market Outlook, By Other Technologies (2020-2028) ($MN)
- Table 52 Europe Biomass Power Market Outlook, By End User (2020-2028) ($MN)
- Table 53 Europe Biomass Power Market Outlook, By Introduction (2020-2028) ($MN)
- Table 54 Europe Biomass Power Market Outlook, By Industrial (2020-2028) ($MN)
- Table 55 Europe Biomass Power Market Outlook, By Commercial (2020-2028) ($MN)
- Table 56 Europe Biomass Power Market Outlook, By Residential (2020-2028) ($MN)
- Table 57 Europe Biomass Power Market Outlook, By Other End Users (2020-2028) ($MN)
- Table 58 Asia Pacific Biomass Power Market Outlook, By Country (2020-2028) ($MN)
- Table 59 Asia Pacific Biomass Power Market Outlook, By Feedstock (2020-2028) ($MN)
- Table 60 Asia Pacific Biomass Power Market Outlook, By Introduction (2020-2028) ($MN)
- Table 61 Asia Pacific Biomass Power Market Outlook, By Solid Biofuel (2020-2028) ($MN)
- Table 62 Asia Pacific Biomass Power Market Outlook, By Liquid Biofuel (2020-2028) ($MN)
- Table 63 Asia Pacific Biomass Power Market Outlook, By Biogas (2020-2028) ($MN)
- Table 64 Asia Pacific Biomass Power Market Outlook, By Other Feedstocks (2020-2028) ($MN)
- Table 65 Asia Pacific Biomass Power Market Outlook, By Technology (2020-2028) ($MN)
- Table 66 Asia Pacific Biomass Power Market Outlook, By Introduction (2020-2028) ($MN)
- Table 67 Asia Pacific Biomass Power Market Outlook, By Combustion (2020-2028) ($MN)
- Table 68 Asia Pacific Biomass Power Market Outlook, By Gasification (2020-2028) ($MN)
- Table 69 Asia Pacific Biomass Power Market Outlook, By Anaerobic Digestion (2020-2028) ($MN)
- Table 70 Asia Pacific Biomass Power Market Outlook, By Other Technologies (2020-2028) ($MN)
- Table 71 Asia Pacific Biomass Power Market Outlook, By End User (2020-2028) ($MN)
- Table 72 Asia Pacific Biomass Power Market Outlook, By Introduction (2020-2028) ($MN)
- Table 73 Asia Pacific Biomass Power Market Outlook, By Industrial (2020-2028) ($MN)
- Table 74 Asia Pacific Biomass Power Market Outlook, By Commercial (2020-2028) ($MN)
- Table 75 Asia Pacific Biomass Power Market Outlook, By Residential (2020-2028) ($MN)
- Table 76 Asia Pacific Biomass Power Market Outlook, By Other End Users (2020-2028) ($MN)
- Table 77 South America Biomass Power Market Outlook, By Country (2020-2028) ($MN)
- Table 78 South America Biomass Power Market Outlook, By Feedstock (2020-2028) ($MN)
- Table 79 South America Biomass Power Market Outlook, By Introduction (2020-2028) ($MN)
- Table 80 South America Biomass Power Market Outlook, By Solid Biofuel (2020-2028) ($MN)
- Table 81 South America Biomass Power Market Outlook, By Liquid Biofuel (2020-2028) ($MN)
- Table 82 South America Biomass Power Market Outlook, By Biogas (2020-2028) ($MN)
- Table 83 South America Biomass Power Market Outlook, By Other Feedstocks (2020-2028) ($MN)
- Table 84 South America Biomass Power Market Outlook, By Technology (2020-2028) ($MN)
- Table 85 South America Biomass Power Market Outlook, By Introduction (2020-2028) ($MN)
- Table 86 South America Biomass Power Market Outlook, By Combustion (2020-2028) ($MN)
- Table 87 South America Biomass Power Market Outlook, By Gasification (2020-2028) ($MN)
- Table 88 South America Biomass Power Market Outlook, By Anaerobic Digestion (2020-2028) ($MN)
- Table 89 South America Biomass Power Market Outlook, By Other Technologies (2020-2028) ($MN)
- Table 90 South America Biomass Power Market Outlook, By End User (2020-2028) ($MN)
- Table 91 South America Biomass Power Market Outlook, By Introduction (2020-2028) ($MN)
- Table 92 South America Biomass Power Market Outlook, By Industrial (2020-2028) ($MN)
- Table 93 South America Biomass Power Market Outlook, By Commercial (2020-2028) ($MN)
- Table 94 South America Biomass Power Market Outlook, By Residential (2020-2028) ($MN)
- Table 95 South America Biomass Power Market Outlook, By Other End Users (2020-2028) ($MN)
- Table 96 Middle East & Africa Biomass Power Market Outlook, By Country (2020-2028) ($MN)
- Table 97 Middle East & Africa Biomass Power Market Outlook, By Feedstock (2020-2028) ($MN)
- Table 98 Middle East & Africa Biomass Power Market Outlook, By Introduction (2020-2028) ($MN)
- Table 99 Middle East & Africa Biomass Power Market Outlook, By Solid Biofuel (2020-2028) ($MN)
- Table 100 Middle East & Africa Biomass Power Market Outlook, By Liquid Biofuel (2020-2028) ($MN)
- Table 101 Middle East & Africa Biomass Power Market Outlook, By Biogas (2020-2028) ($MN)
- Table 102 Middle East & Africa Biomass Power Market Outlook, By Other Feedstocks (2020-2028) ($MN)
- Table 103 Middle East & Africa Biomass Power Market Outlook, By Technology (2020-2028) ($MN)
- Table 104 Middle East & Africa Biomass Power Market Outlook, By Introduction (2020-2028) ($MN)
- Table 105 Middle East & Africa Biomass Power Market Outlook, By Combustion (2020-2028) ($MN)
- Table 106 Middle East & Africa Biomass Power Market Outlook, By Gasification (2020-2028) ($MN)
- Table 107 Middle East & Africa Biomass Power Market Outlook, By Anaerobic Digestion (2020-2028) ($MN)
- Table 108 Middle East & Africa Biomass Power Market Outlook, By Other Technologies (2020-2028) ($MN)
- Table 109 Middle East & Africa Biomass Power Market Outlook, By End User (2020-2028) ($MN)
- Table 110 Middle East & Africa Biomass Power Market Outlook, By Introduction (2020-2028) ($MN)
- Table 111 Middle East & Africa Biomass Power Market Outlook, By Industrial (2020-2028) ($MN)
- Table 112 Middle East & Africa Biomass Power Market Outlook, By Commercial (2020-2028) ($MN)
- Table 113 Middle East & Africa Biomass Power Market Outlook, By Residential (2020-2028) ($MN)
- Table 114 Middle East & Africa Biomass Power Market Outlook, By Other End Users (2020-2028) ($MN)
According to Stratistics MRC, the Global Biomass Power Market is accounted for $70.30 billion in 2022 and is expected to reach $154.32 billion by 2028 growing at a CAGR of 14% during the forecast period. Biomass power is energy generated or produced by living or non living organisms. The most common biomass materials used for energy are plants, such as corn and soy etc. The energy from these organisms can be burned to create heat or converted into electricity. This biogas is used to produce energy by various processes such as thermal conversion, gasification, bio fuel, bio char etc. These biomass is rich in hydrogen, carbon etc. Biomass is an integral part of earth's carbon cycle. The carbon cycle is the process by which carbon is exchanged between all layers of the earth. Hence the above factors are boosting in the market growth.
According to the BP Statistical Review of World Energy 2022, the United States produced 643 thousand barrels of oil equivalent of bio fuel per day, i.e., an increase of about 7.1% when compared to the previous year's value.
Market Dynamics:
Driver:
Rapid adoption of biomass power generation
Biomass power generation is increasingly being adopted across the globe to meet policy targets for reliable, affordable, and secure supply of energy in order to promote economic development and improve electricity access, in addition rapid industrialization in developing and emerging economies such as China, India, and Brazil is fuelling the demand for energy. Utilization of biomass resources for power generation forms an important part of the strategic initiatives by various governments and institutions. These initiatives aim to reorganize the national energy economies and augment the share of renewable energy in the overall power generation mix which is motivating the market growth.
Restraint:
Presence of alternative renewable energy source
Renewable sources of energy such as solar and wind energy have evolved as better alternatives due to vigorous research and development and giant capital investments. These alternative sources have lead to remarkable power generation and require less operational costs than biomass power. Furthermore, the incapacity of solar and wind energy to provide continuous power has been overcome with the evolution of battery energy storage systems, thus the lower costs and increasing adoption of solar and wind energy hinders the growth of the biomass power market.
Opportunity:
Regulatory framework and government support
The supporting Regulatory framework and government grants and funding programs that provide investment subsidies and tax benefits play a key role in encouraging power generating companies and utilities to switch to environment-friendly biomass for power generation. Moreover, biomass can compete with conservative power sources with the availability of low cost agricultural or forestry wastes and residues. Even in the regions where feedstock is expensive, the cost of electricity from biomass is still more competitive than that from coal-fired generation, making biomass ideal for off-grid power supply are likely to fuel the global biomass power generation market.
Threat:
Seasonal Nature of Biomass Power
Seasonal nature of biomass feedstock, along with transportation and storage problems, create severe challenges for plant operators. The accessibility of biomass feedstock depends upon the climatic conditions of the region they grow in and the cultivation period. Additionally, the cost of biomass feedstock is subject to climatic conditions and availability. Furthermore, the wet disposition of biomass makes transportation and storage a costly affair. Moreover, in order to avoid shortage and make certain availability throughout the year, biomass plant operators need to stock up the biomass feedstock, which requires specific storage facilities to prevent an increase in moisture content.
COVID-19 Impact
The corona virus pandemic has a negative impact on the market for biomass power generation. The development of the global biomass power generating market was greatly impacted by strict lockdowns, suspended commercial and industrial operations, and limitations placed by certain governments because of large-scale transmission capacities. Biogas and derivatives market participants are overcome the crisis by concentrating on efficient strategies. Hence pandemic has hampered the growth of the biomass power market.
The solid bio fuel segment is expected to be the largest during the forecast period
The solid bio fuel segment is estimated to have a lucrative growth, due to its biological origin which may be used as fuel for heat production or electricity generation. In energy statistics, solid bio fuels is a product aggregate equal to the sum of charcoal, fuel wood, wood residues and by-products, black liquor, biogases, animal waste, other vegetal materials and residuals and renewable fraction of industrial waste. They provide advantages of emission of non-toxic materials which reduces the risk of cancer and breathing problems in human beings. Moreover, they are friendly to the environment because they reduce the risk of global warming thus, propelling the market growth.
The combustion segment is expected to have the highest CAGR during the forecast period
The combustion segment is anticipated to witness the fastest CAGR growth during the forecast period, due to its benefits of protecting animal and human health by reducing pathogens. Convert nutrients in manure into a form that is more accessible for plants to use compared to raw manure. This can increase crop productivity and yield. Recycle nutrients on the farm, creating an economically and environmentally sustainable food production system. Moreover, it reduces greenhouse gas emissions by capturing methane gas that may otherwise have been lost to the atmosphere and by displacing fossil fuel energy use thereby enhancing the growth of the market.
Region with highest share:
North America is projected to hold the largest market share during the forecast period owing to the recent discovery of shale gas reserves in the region has resulted in gas-based power generation, which is gaining higher growth over coal-based power generation in the region in the past decade. Installers and system providers usually hold stock of major equipment in inventory. The North America locale is significantly reliant upon coal for power age. The new disclosure of shale gas holds in the area has brought about gas-based power age, which is acquiring higher development over coal-based power age thereby accelerating the market growth.
Region with highest CAGR:
Europe is projected to have the highest CAGR over the forecast period, owing to their aim be carbon-neutral by 2050. The European Union's commitments as part of the Paris agreement, biomass feedstock are directly combusted in a furnace with air, to convert water into steam. The produced steam is used to drive a steam turbine to generate electricity. The new project commissioned in was done in locations, such as Florida, Georgia, California, and Hawaii. Furthermore, over 384 MW of biomass power projects are under different development phases in the country. These factors are anticipated to boost the market growth in the country over the forecast period.
Key players in the market
Some of the key players profiled in the Biomass Power Market include Babcock & Wilcox Company, Ameresco, Alstom SA, Engie, Indus Green Bio Energy Pvt. Ltd, NTPC, Oulun Energia Oy, Acciona, Helius Energy Plc, DONG Energy A/S, Fourth Partner Energy, Alstom SA, MGT Power Ltd., Vattenfall AB and Drax Group plc.
Key Developments:
In Nov 2022, Babcock & Wilcox Announces Agreement to Study Development of Biomass-to-Hydrogen Project in South Korea Using BrightLoop™ Technology for a hydrogen generation facility using biomass fuel in South Korea.
In Nov 2022, Ameresco Announces the Acquisition of Wind Farm in West County Cork, Ireland, his three-turbine site is designed to deliver a total combined capacity of 5MW of clean energy.
In Dec 2020, Babcock & Wilcox and Chart Industries to Collaborate on Hydrogen Innovation Utilizing B&W's BrightLoopTM Technology utilizing Chart's integrated hydrogen liquefaction and cryogenic carbon capture equipment and expertise. Together, this solution provides economic generation of low-carbon hydrogen and supplies cost-effective, transportable forms of liquid hydrogen and carbon dioxide.
Feedstock's Covered:
- Solid Biofuel
- Liquid Biofuel
- Biogas
- Other Feedstock's
Technologies Covered:
- Combustion
- Gasification
- Anaerobic Digestion
- Other Technologies
End Users Covered:
- Industrial
- Commercial
- Residential
- Other End Users
Regions Covered:
- North America
- US
- Canada
- Mexico
- Europe
- Germany
- UK
- Italy
- France
- Spain
- Rest of Europe
- Asia Pacific
- Japan
- China
- India
- Australia
- New Zealand
- South Korea
- Rest of Asia Pacific
- South America
- Argentina
- Brazil
- Chile
- Rest of South America
- Middle East & Africa
- Saudi Arabia
- UAE
- Qatar
- South Africa
- Rest of Middle East & Africa
What our report offers:
- Market share assessments for the regional and country-level segments
- Strategic recommendations for the new entrants
- Covers Market data for the years 2020, 2021, 2022, 2025, and 2028
- Market Trends (Drivers, Constraints, Opportunities, Threats, Challenges, Investment Opportunities, and recommendations)
- Strategic recommendations in key business segments based on the market estimations
- Competitive landscaping mapping the key common trends
- Company profiling with detailed strategies, financials, and recent developments
- Supply chain trends mapping the latest technological advancements
Free Customization Offerings:
All the customers of this report will be entitled to receive one of the following free customization options:
- Company Profiling
- Comprehensive profiling of additional market players (up to 3)
- SWOT Analysis of key players (up to 3)
- Regional Segmentation
- Market estimations, Forecasts and CAGR of any prominent country as per the client's interest (Note: Depends on feasibility check)
- Competitive Benchmarking
- Benchmarking of key players based on product portfolio, geographical presence, and strategic alliances
Table of Contents
1 Executive Summary
2 Preface
- 2.1 Abstract
- 2.2 Stake Holders
- 2.3 Research Scope
- 2.4 Research Methodology
- 2.4.1 Data Mining
- 2.4.2 Data Analysis
- 2.4.3 Data Validation
- 2.4.4 Research Approach
- 2.5 Research Sources
- 2.5.1 Primary Research Sources
- 2.5.2 Secondary Research Sources
- 2.5.3 Assumptions
3 Market Trend Analysis
- 3.1 Introduction
- 3.2 Drivers
- 3.3 Restraints
- 3.4 Opportunities
- 3.5 Threats
- 3.6 Technology Analysis
- 3.7 End User Analysis
- 3.8 Emerging Markets
- 3.9 Impact of Covid-19
4 Porters Five Force Analysis
- 4.1 Bargaining power of suppliers
- 4.2 Bargaining power of buyers
- 4.3 Threat of substitutes
- 4.4 Threat of new entrants
- 4.5 Competitive rivalry
5 Global Biomass Power Market, By Feedstock
- 5.1 Introduction
- 5.2 Solid Biofuel
- 5.3 Liquid Biofuel
- 5.4 Biogas
- 5.5 Other Feedstocks
6 Global Biomass Power Market, By Technology
- 6.1 Introduction
- 6.2 Combustion
- 6.3 Gasification
- 6.4 Anaerobic Digestion
- 6.5 Other Technologies
7 Global Biomass Power Market, By End User
- 7.1 Introduction
- 7.2 Industrial
- 7.3 Commercial
- 7.4 Residential
- 7.5 Other End Users
8 Global Biomass Power Market, By Geography
- 8.1 Introduction
- 8.2 North America
- 8.2.1 US
- 8.2.2 Canada
- 8.2.3 Mexico
- 8.3 Europe
8.3,1 Germany
- 8.3.2 UK
8.3,2 Italy
- 8.3.3 France
8.3,3 Spain
- 8.3.4 Rest of Europe
- 8.4 Asia Pacific
- 8.4.1 Japan
- 8.4.2 China
- 8.4.3 India
- 8.4.4 Australia
- 8.4.5 New Zealand
- 8.4.6 South Korea
- 8.4.7 Rest of Asia Pacific
- 8.5 South America
- 8.5.1 Argentina
- 8.5.2 Brazil
- 8.5.3 Chile
- 8.5.4 Rest of South America
- 8.6 Middle East & Africa
- 8.6.1 Saudi Arabia
- 8.6.2 UAE
- 8.6.3 Qatar
- 8.6.4 South Africa
- 8.6.5 Rest of Middle East & Africa
9 Key Developments
- 9.1 Agreements, Partnerships, Collaborations and Joint Ventures
- 9.2 Acquisitions & Mergers
- 9.3 New Product Launch
- 9.4 Expansions
- 9.5 Other Key Strategies
10 Company Profiling
- 10.1 Babcock & Wilcox Company
- 10.2 Ameresco
- 10.3 Alstom SA
- 10.4 Engie
- 10.5 Indus Green Bio Energy Pvt. Ltd
- 10.6 NTPC
- 10.7 Oulun Energia Oy
- 10.8 Acciona
- 10.9 Helius Energy Plc
- 10.10 DONG Energy A/S
- 10.11 Fourth Partner Energy
- 10.12 Alstom SA
- 10.13 MGT Power Ltd.
- 10.14 Vattenfall AB
- 10.15 Drax Group plc