|
|
市場調査レポート
商品コード
1334459
バイオマス発電市場- 世界の市場規模、シェア、動向分析、機会、予測レポート、2019-2029年Biomass Power Generation Market - Global Size, Share, Trend Analysis, Opportunity and Forecast Report, 2019-2029, Segmented By Feedstock ; By Technology ; By Application ; By Region |
||||||
|
|
|||||||
|
|||||||


| バイオマス発電市場- 世界の市場規模、シェア、動向分析、機会、予測レポート、2019-2029年 |
|
出版日: 2023年08月08日
発行: Blueweave Consulting
ページ情報: 英文 400 Pages
納期: 2~3営業日
|

- 全表示
- 概要
- 目次
バイオマス発電の世界市場規模は2029年までに782億7,000万米ドルに達する勢い
世界のバイオマス発電市場は、再生可能エネルギー源の利用拡大、発電会社からのバイオマス需要の高さ、バイオマス変換技術の進歩の採用増加により活況を呈しています。
戦略コンサルティング・市場調査の大手であるBlueWeave Consulting社は、最近の調査で、2022年のバイオマス発電の世界市場規模を543億6,000万米ドルと推定しました。2023年から2029年までの予測期間中、BlueWeaveは世界のバイオマス発電市場規模がCAGR 6.26%の大幅な成長を遂げ、2029年には782億7,000万米ドルに達すると予測しています。世界のバイオマス発電市場の主な成長促進要因には、環境意識の高まりがあり、多くの国が再生可能エネルギー源の発電ポートフォリオへの統合を優先していることが挙げられます。インド、中国、ドイツ、英国、フランスは、再生可能エネルギー目標を設定し、今後数年間でカーボンニュートラルを達成することを目指すなど、重要な措置を講じています。このような環境意識の高まりは、支援的な政策と政策と相まって、再生可能エネルギー市場の成長を後押ししています。二酸化炭素排出量の削減と持続可能なエネルギー源への移行へのコミットメントが、様々な産業や地域における再生可能エネルギー導入に有利な環境を育んでいます。欧州連合(EU)諸国は石炭の段階的廃止戦略を積極的に進めており、これがバイオマス発電の需要を促進すると予想されます。同様に、インド、米国、中国は、二酸化炭素排出量を削減するために、バイオマス原料を石炭ベースの発電所と組み合わせる混焼を実施しています。こうした取り組みは、予測期間中の市場の成長に大きく貢献すると予想されます。しかし、バイオマスの誤った管理や発展途上国の認識不足が、分析期間中の市場全体の成長を抑制すると予想されます。
本レポートの詳細な分析により、世界のバイオマス発電市場の成長可能性、今後の動向、統計に関する情報を提供します。また、総市場規模の予測を促進する要因も明らかにしています。本レポートは、世界のバイオマス発電市場の最新技術動向や、意思決定者が適切な戦略的意思決定を行うための業界洞察を提供することをお約束します。さらに、市場の成長促進要因・課題・競争力についても分析しています。
目次
第1章 調査の枠組み
第2章 エグゼクティブサマリー
第3章 世界のバイオマス発電市場に関する洞察
- 業界のバリューチェーン分析
- DROC分析
- 成長促進要因
- 再生可能エネルギー源の使用の増加
- 発電会社からの需要が急増
- バイオマス変換技術の進歩
- 抑制要因
- バイオマスの不適切な管理
- 発展途上国における認識の欠如
- 機会
- 環境に優しい再生可能エネルギーへの需要の高まり
- 温室効果ガス(GHG)の排出を抑制する必要性の高まり
- 課題
- バイオマスの調達と配送における輸送と物流のコストが高い
- 大気排出と土地利用に関連する規制のハードルと一般の認識の問題。
- 成長促進要因
- 技術の進歩/最近の開発
- 規制の枠組み
- ポーターのファイブフォース分析
第4章 世界のバイオマス発電市場概要
- 市場規模と予測、2019~2029年
- 金額別
- 市場シェアと予測
- 原料別
- 固体バイオマス
- バイオガス
- 液体バイオマス
- 都市固形廃棄物
- テクノロジー別
- 燃焼
- ガス化
- 嫌気性消化
- 熱分解
- その他
- 用途別
- 住宅
- 産業用
- コマーシャル
- 地域別
- 北米
- 欧州
- アジア太平洋(APAC)
- ラテンアメリカ(LATAM)
- 中東およびアフリカ(MEA)
- 原料別
第5章 北米バイオマス発電市場
- 市場規模と予測、2019~2029年
- 金額別
- 市場シェアと予測
- 原料別
- テクノロジー別
- 用途別
- 国別
- 米国
- カナダ
第6章 欧州バイオマス発電市場
- 市場規模と予測、2019~2029年
- 金額別
- 市場シェアと予測
- 原料別
- テクノロジー別
- 用途別
- 国別
- ドイツ
- 英国
- イタリア
- フランス
- スペイン
- ベルギー
- ロシア
- オランダ
- その他欧州
第7章 アジア太平洋バイオマス発電市場
- 市場規模と予測、2019~2029年
- 金額別
- 市場シェアと予測
- 原料別
- テクノロジー別
- 用途別
- 国別
- 中国
- インド
- 日本
- 韓国
- オーストラリアとニュージーランド
- インドネシア
- マレーシア
- シンガポール
- ベトナム
- APACのその他の地域
第8章 ラテンアメリカのバイオマス発電市場
- 市場規模と予測、2019~2029年
- 金額別
- 市場シェアと予測
- 原料別
- テクノロジー別
- 用途別
- 国別
- ブラジル
- メキシコ
- アルゼンチン
- ペルー
- 中南米のその他の地域
第9章 中東・アフリカのバイオマス発電市場
- 市場規模と予測、2019~2029年
- 金額別
- 市場シェアと予測
- 原料別
- テクノロジー別
- 用途別
- 国別
- サウジアラビア
- アラブ首長国連邦
- カタール
- クウェート
- 南アフリカ
- ナイジェリア
- アルジェリア
- MEAのその他の地域
第10章 競合情勢
- 主要企業とその製品のリスト
- 世界のバイオマス発電市場シェア分析、2022年
- 動作パラメータによる競合ベンチマーキング
- 主要な戦略的展開(合併、買収、パートナーシップなど)
第11章 世界のバイオマス発電市場に対するCOVID-19症の影響
第12章 企業プロファイル(会社概要、財務マトリックス、競合情勢、主要な人材、主要な競合、連絡先住所、戦略的展望、 SWOT分析)
- John Wood Group Plc
- E.ON SE
- Acciona SA
- Vattenfall
- General Electric Co.
- Babcock & Wilcox Enterprises Inc
- Andritz AG
- Valmet Oyj
- Ameresco Inc
- Thermax Ltd
- Mitsubishi Heavy Industries, Ltd.
- Veolia
- Suez
- Xcel Energy Inc.
- Ramboll Group A/S
- Other Prominent Players
第13章 主要な戦略的推奨事項
第14章 調査手法
- 定性的調査
- 一次および2次調査
- 定量的調査
- 市場内訳とデータの三角測量
- 2次調査
- 1次調査
- 1次調査回答者の地域別内訳
- 前提と制限
Global Biomass Power Generation Market Size Booming to Touch USD 78.27 Billion by 2029.
Global biomass power generation market is flourishing because of the growing use of renewable sources of energy, high demand from biomass from power generation companies, and increasing adoption of advancements in biomass conversion technologies.
BlueWeave Consulting, a leading strategic consulting and market research firm, in its recent study, estimated the global biomass power generation market size at USD 54.36 billion in 2022. During the forecast period between 2023 and 2029, BlueWeave expects the global biomass power generation market size to grow at a significant CAGR of 6.26% reaching a value of USD 78.27 billion by 2029. Major growth drivers for the global biomass power generation market include an increasing environmental awareness, prompting numerous countries to prioritize the integration of renewable energy sources into their power generation portfolios. India, China, Germany, the United Kingdom, and France have taken significant steps by setting renewable energy targets and aspiring to achieve carbon neutrality in the coming years. This surge in environmental awareness, coupled with supportive policies and regulations, has driven the growth of the renewable energy market. The commitment to reducing carbon emissions and transitioning to sustainable energy sources is fostering a favorable environment for renewable energy adoption across various industries and regions. European Union nations are actively pursuing a coal phase-out strategy, which is expected to drive the demand for biomass power. Similarly, India, the United States, and China are implementing co-firing practices, combining biomass feedstock with coal-based power plants to reduce carbon emissions. These initiatives are expected to significantly contribute to the market's growth during the forecast period. However, mismanagement of biomass and lack of awareness among developing economies are anticipated to restrain the overall market growth during the period in analysis.
Global Biomass Power Generation Market - Overview:
The global biomass power generation market refers to the production of electricity or heat through the utilization of organic materials derived from plants, animals, and various forms of organic waste. Biomass power generation involves the conversion of biomass feedstock, such as agricultural residues, forestry by-products, dedicated energy crops, and biodegradable waste, into energy through processes like combustion, gasification, or anaerobic digestion. This renewable energy source provides an alternative to fossil fuels and helps reduce greenhouse gas emissions. The global biomass power generation market encompasses various technologies, infrastructure, and systems aimed at harnessing the energy potential of biomass resources to meet the growing demand for clean and sustainable energy worldwide.
Impact of COVID-19 on Global Biomass Power Generation Market:
COVID-19 pandemic had both positive and negative impacts on the global biomass power generation market. On the positive side, the increased focus on renewable energy and sustainable practices has further emphasized the importance of biomass power generation. Governments and policymakers have recognized the significance of resilient and clean energy systems, leading to supportive policies and investments in the sector. However, the pandemic has also disrupted supply chains, delayed project timelines, and caused financial uncertainties, affecting the overall market growth. The industry has faced challenges in terms of biomass availability, construction activities, and project financing. The successful containment of the pandemic and the implementation of supportive measures by governments and stakeholders play a crucial role in determining the recovery and growth of the biomass power generation market.
Global Biomass Power Generation Market - By Technology:
By technology, the global biomass power generation market is divided into Combustion, Gasification, Anaerobic Digestion, and Pyrolysis segments. The combustion segment held the highest share in the global biomass power generation market in 2022. The combustion technology has been widely adopted and is well-established for converting biomass feedstock into energy. This method involves the direct burning of biomass in boilers or furnaces, which generates steam to drive turbines for electricity generation. The simplicity and efficiency of combustion-based systems make them a preferred choice in biomass power generation. Notably, combustion technology offers versatility as it can utilize various biomass feedstocks, including agricultural residues, forestry waste, and dedicated energy crops. The availability and abundance of these feedstocks contribute to the dominance of the combustion segment. Also, advancements in combustion technology have led to improved efficiency and environmental performance of biomass power plants, making them economically and environmentally viable solutions.
Competitive Landscape:
Major players operating in the global biomass power generation market include: John Wood Group Plc, E.ON SE, Acciona SA, Vattenfall, General Electric Co., Babcock & Wilcox Enterprises Inc, Andritz AG, Valmet Oyj, Ameresco Inc, Thermax Ltd, Mitsubishi Heavy Industries, Ltd, Veolia, Suez, Xcel Energy Inc., and Ramboll Group A/S. To further enhance their market share, these companies employ various strategies, including mergers and acquisitions, partnerships, joint ventures, license agreements, and new product launches.
The in-depth analysis of the report provides information about growth potential, upcoming trends, and statistics of Global Biomass Power Generation Market. It also highlights the factors driving forecasts of total market size. The report promises to provide recent technology trends in Global Biomass Power Generation Market and industry insights to help decision-makers make sound strategic decisions. Furthermore, the report also analyzes the growth drivers, challenges, and competitive dynamics of the market.
Table of Contents
1. Research Framework
- 1.1. Research Objective
- 1.2. Product Overview
- 1.3. Market Segmentation
2. Executive Summary
3. Global Biomass Power Generation Market Insights
- 3.1. Industry Value Chain Analysis
- 3.2. DROC Analysis
- 3.2.1. Growth Drivers
- 3.2.1.1. Increase in use of renewable sources of energy
- 3.2.1.2. Surge in demand from power production companies
- 3.2.1.3. Advancements in biomass conversion technologies
- 3.2.2. Restraints
- 3.2.2.1. Mismanagement of biomass
- 3.2.2.2. Lack of awareness among developing economies
- 3.2.3. Opportunities
- 3.2.3.1. Upsurge in demand for environment-friendly renewable sources of energy
- 3.2.3.2. Rise in need to control the emission of greenhouse gases (GHG
- 3.2.4. Challenges
- 3.2.4.1. High cost of transportation and logistics in sourcing and delivering biomass
- 3.2.4.2. Regulatory hurdles and public perception issues related to air emissions and land use.
- 3.2.1. Growth Drivers
- 3.3. Technological Advancements/Recent Developments
- 3.4. Regulatory Framework
- 3.5. Porter's Five Forces Analysis
- 3.5.1. Bargaining Power of Suppliers
- 3.5.2. Bargaining Power of Buyers
- 3.5.3. Threat of New Entrants
- 3.5.4. Threat of Substitutes
- 3.5.5. Intensity of Rivalry
4. Global Biomass Power Generation Market Overview
- 4.1. Market Size & Forecast, 2019-2029
- 4.1.1. By Value (USD Million)
- 4.2. Market Share and Forecast
- 4.2.1. By Feedstock
- 4.2.1.1. Solid Biomass
- 4.2.1.2. Biogas
- 4.2.1.3. Liquid Biomass
- 4.2.1.4. Municipal Solid Waste
- 4.2.2. By Technology
- 4.2.2.1. Combustion
- 4.2.2.2. Gasification
- 4.2.2.3. Anaerobic Digestion
- 4.2.2.4. Pyrolysis
- 4.2.2.5. Others
- 4.2.3. By Application
- 4.2.3.1. Residential
- 4.2.3.2. Industrial
- 4.2.3.3. Commercial
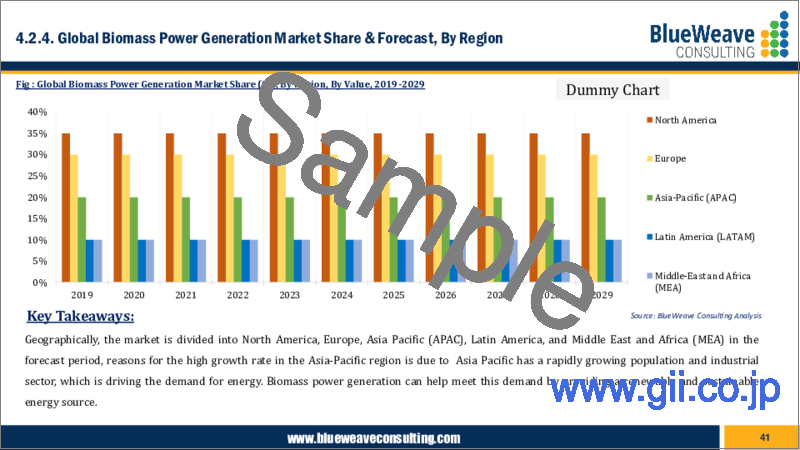
- 4.2.4. By Region
- 4.2.4.1. North America
- 4.2.4.2. Europe
- 4.2.4.3. Asia Pacific (APAC)
- 4.2.4.4. Latin America (LATAM)
- 4.2.4.5. Middle East and Africa (MEA)
- 4.2.1. By Feedstock
5. North America Biomass Power Generation Market
- 5.1. Market Size & Forecast, 2019-2029
- 5.1.1. By Value (USD Million)
- 5.2. Market Share & Forecast
- 5.2.1. By Feedstock
- 5.2.2. By Technology
- 5.2.3. By Application
- 5.2.4. By Country
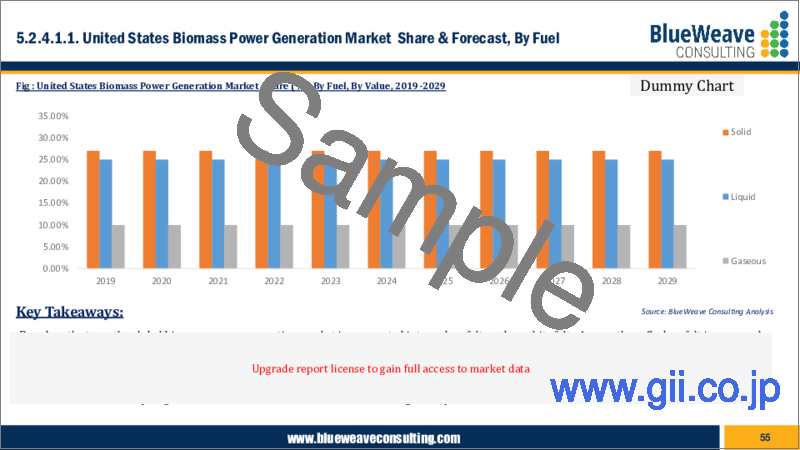
- 5.2.4.1. United States
- 5.2.4.1.1. By Feedstock
- 5.2.4.1.2. By Technology
- 5.2.4.1.3. By Application
- 5.2.4.2. Canada
- 5.2.4.2.1. By Feedstock
- 5.2.4.2.2. By Technology
- 5.2.4.2.3. By Application
6. Europe Biomass Power Generation Market
- 6.1. Market Size & Forecast, 2019-2029
- 6.1.1. By Value (USD Million)
- 6.2. Market Share & Forecast
- 6.2.1. By Feedstock
- 6.2.2. By Technology
- 6.2.3. By Application
- 6.2.4. By Country
- 6.2.4.1. Germany
- 6.2.4.1.1. By Feedstock
- 6.2.4.1.2. By Technology
- 6.2.4.1.3. By Application
- 6.2.4.2. United Kingdom
- 6.2.4.2.1. By Feedstock
- 6.2.4.2.2. By Technology
- 6.2.4.2.3. By Application
- 6.2.4.3. Italy
- 6.2.4.3.1. By Feedstock
- 6.2.4.3.2. By Technology
- 6.2.4.3.3. By Application
- 6.2.4.4. France
- 6.2.4.4.1. By Feedstock
- 6.2.4.4.2. By Technology
- 6.2.4.4.3. By Application
- 6.2.4.5. Spain
- 6.2.4.5.1. By Feedstock
- 6.2.4.5.2. By Technology
- 6.2.4.5.3. By Application
- 6.2.4.6. Belgium
- 6.2.4.6.1. By Feedstock
- 6.2.4.6.2. By Technology
- 6.2.4.6.3. By Application
- 6.2.4.7. Russia
- 6.2.4.7.1. By Feedstock
- 6.2.4.7.2. By Technology
- 6.2.4.7.3. By Application
- 6.2.4.8. The Netherlands
- 6.2.4.8.1. By Feedstock
- 6.2.4.8.2. By Technology
- 6.2.4.8.3. By Application
- 6.2.4.9. Rest of Europe
- 6.2.4.9.1. By Feedstock
- 6.2.4.9.2. By Technology
- 6.2.4.9.3. By Application
7. Asia-Pacific Biomass Power Generation Market
- 7.1. Market Size & Forecast, 2019-2029
- 7.1.1. By Value (USD Million)
- 7.2. Market Share & Forecast
- 7.2.1. By Feedstock
- 7.2.2. By Technology
- 7.2.3. By Application
- 7.2.4. By Country
- 7.2.4.1. China
- 7.2.4.1.1. By Feedstock
- 7.2.4.1.2. By Technology
- 7.2.4.1.3. By Application
- 7.2.4.2. India
- 7.2.4.2.1. By Feedstock
- 7.2.4.2.2. By Technology
- 7.2.4.2.3. By Application
- 7.2.4.3. Japan
- 7.2.4.3.1. By Feedstock
- 7.2.4.3.2. By Technology
- 7.2.4.3.3. By Application
- 7.2.4.4. South Korea
- 7.2.4.4.1. By Feedstock
- 7.2.4.4.2. By Technology
- 7.2.4.4.3. By Application
- 7.2.4.5. Australia & New Zealand
- 7.2.4.5.1. By Feedstock
- 7.2.4.5.2. By Technology
- 7.2.4.5.3. By Application
- 7.2.4.6. Indonesia
- 7.2.4.6.1. By Feedstock
- 7.2.4.6.2. By Technology
- 7.2.4.6.3. By Application
- 7.2.4.7. Malaysia
- 7.2.4.7.1. By Feedstock
- 7.2.4.7.2. By Technology
- 7.2.4.7.3. By Application
- 7.2.4.8. Singapore
- 7.2.4.8.1. By Feedstock
- 7.2.4.8.2. By Technology
- 7.2.4.8.3. By Application
- 7.2.4.9. Vietnam
- 7.2.4.9.1. By Feedstock
- 7.2.4.9.2. By Technology
- 7.2.4.9.3. By Application
- 7.2.4.10. Rest of APAC
- 7.2.4.10.1. By Feedstock
- 7.2.4.10.2. By Technology
- 7.2.4.10.3. By Application
8. Latin America Biomass Power Generation Market
- 8.1. Market Size & Forecast, 2019-2029
- 8.1.1. By Value (USD Million)
- 8.2. Market Share & Forecast
- 8.2.1. By Feedstock
- 8.2.2. By Technology
- 8.2.3. By Application
- 8.2.4. By Country
- 8.2.4.1. Brazil
- 8.2.4.1.1. By Feedstock
- 8.2.4.1.2. By Technology
- 8.2.4.1.3. By Application
- 8.2.4.2. Mexico
- 8.2.4.2.1. By Feedstock
- 8.2.4.2.2. By Technology
- 8.2.4.2.3. By Application
- 8.2.4.3. Argentina
- 8.2.4.3.1. By Feedstock
- 8.2.4.3.2. By Technology
- 8.2.4.3.3. By Application
- 8.2.4.4. Peru
- 8.2.4.4.1. By Feedstock
- 8.2.4.4.2. By Technology
- 8.2.4.4.3. By Application
- 8.2.4.5. Rest of LATAM
- 8.2.4.5.1. By Feedstock
- 8.2.4.5.2. By Technology
- 8.2.4.5.3. By Application
9. Middle East & Africa Biomass Power Generation Market
- 9.1. Market Size & Forecast, 2019-2029
- 9.1.1. By Value (USD Million)
- 9.2. Market Share & Forecast
- 9.2.1. By Feedstock
- 9.2.2. By Technology
- 9.2.3. By Application
- 9.2.4. By Country
- 9.2.4.1. Saudi Arabia
- 9.2.4.1.1. By Feedstock
- 9.2.4.1.2. By Technology
- 9.2.4.1.3. By Application
- 9.2.4.2. UAE
- 9.2.4.2.1. By Feedstock
- 9.2.4.2.2. By Technology
- 9.2.4.2.3. By Application
- 9.2.4.3. Qatar
- 9.2.4.3.1. By Feedstock
- 9.2.4.3.2. By Technology
- 9.2.4.3.3. By Application
- 9.2.4.4. Kuwait
- 9.2.4.4.1. By Feedstock
- 9.2.4.4.2. By Technology
- 9.2.4.4.3. By Application
- 9.2.4.5. South Africa
- 9.2.4.5.1. By Feedstock
- 9.2.4.5.2. By Technology
- 9.2.4.5.3. By Application
- 9.2.4.6. Nigeria
- 9.2.4.6.1. By Feedstock
- 9.2.4.6.2. By Technology
- 9.2.4.6.3. By Application
- 9.2.4.7. Algeria
- 9.2.4.7.1. By Feedstock
- 9.2.4.7.2. By Technology
- 9.2.4.7.3. By Application
- 9.2.4.8. Rest of MEA
- 9.2.4.8.1. By Feedstock
- 9.2.4.8.2. By Technology
- 9.2.4.8.3. By Application
10. Competitive Landscape
- 10.1. List of Key Players and Their Offerings
- 10.2. Global Biomass Power Generation Market Share Analysis, 2022
- 10.3. Competitive Benchmarking, By Operating Parameters
- 10.4. Key Strategic Developments (Mergers, Acquisitions, Partnerships, etc.)
11. Impact of Covid-19 on Global Biomass Power Generation Market
12. Company Profile (Company Overview, Financial Matrix, Competitive Landscape, Key Personnel, Key Competitors, Contact Address, Strategic Outlook, SWOT Analysis)
- 12.1. John Wood Group Plc
- 12.2. E.ON SE
- 12.3. Acciona SA
- 12.4. Vattenfall
- 12.5. General Electric Co.
- 12.6. Babcock & Wilcox Enterprises Inc
- 12.7. Andritz AG
- 12.8. Valmet Oyj
- 12.9. Ameresco Inc
- 12.10. Thermax Ltd
- 12.11. Mitsubishi Heavy Industries, Ltd.
- 12.12. Veolia
- 12.13. Suez
- 12.14. Xcel Energy Inc.
- 12.15. Ramboll Group A/S
- 12.16. Other Prominent Players
13. Key Strategic Recommendations
14. Research Methodology
- 14.1. Qualitative Research
- 14.1.1. Primary & Secondary Research
- 14.2. Quantitative Research
- 14.3. Market Breakdown & Data Triangulation
- 14.3.1. Secondary Research
- 14.3.2. Primary Research
- 14.4. Breakdown of Primary Research Respondents, By Region
- 14.5. Assumptions & Limitations
