
ニューロモルフィックコンピューティングの世界市場(~2035年):提供タイプ別、用途タイプ別、展開タイプ別、エンドユーザータイプ別、地域別、産業動向、予測
Neuromorphic Computing Market, Till 2035: Distribution by Type of Offering, Type of Application, Type of Deployment, Type of End User, and Geographical Regions: Industry Trends and Global Forecasts- 発行日
- ページ情報
- 英文 177 Pages
- 納期
- 7~10営業日
- 商品コード
- 1803897
- カスタマイズ可能 お客様のご希望に応じて、既存データの加工や未掲載情報(例:国別セグメント)の追加などの対応が可能です。詳細はお問い合わせください。
- 翻訳ツール提供対象 PDF対応AI翻訳ツールの無料貸し出しサービスのご利用が可能です
- 医薬品関連専門 医薬品関連専門を専門とする市場調査会社です。
概要
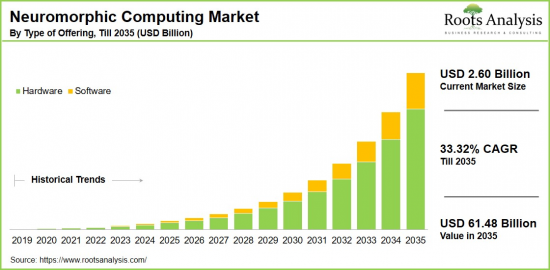
世界のニューロモルフィックコンピューティングの市場規模は、現在の26億米ドルから2035年までに614億8,000万米ドルに達すると予測され、2035年までの予測期間にCAGRで33.32%の成長が見込まれます。
ニューロモルフィックコンピューティング市場:成長と動向
ニューロモルフィックコンピューティングとは、人間の脳の機能を模倣したコンピューティングパラダイムです。通常、脳の神経構造とシナプスをエミュレートするように設計されたハードウェアとソフトウェアの両方を含み、より自然で効率的な情報処理を可能にします。最初のシリコンニューロンとシナプスは、1980年にニューロモルフィックコンピューティングモデルを確立したミーシャ・マホワルドとカーバー・ミードによって作られました。このアプローチは、相互接続されたニューロンとシナプスのネットワークを通じて脳が並列に情報を処理するという生物学的手法に基づいており、ニューロン間の通信を促進するために化学的・電気的信号を伝達します。
この点で、スパイキングニューラルネットワーク(SNN)はニューロモルフィックコンピューティングの基本概念を表しており、生物学的システムがどのように通信しているかを反映しています。SNNは、スパイクするシナプスと人工ニューロンで構成され、連続的な同期信号に依存する従来の人工ニューラルネットワーク(ANN)とは異なります。代わりに、SNNはデータ処理にスパイクを使用し、リアルタイムエッジ用途の電力効率を向上させます。
この枠組みの中で、ニューロモルフィックコンピューティングのハードウェアには、脳のような処理を再現するように設計された専用チップが含まれ、重要な役割を果たしています。これらのニューロモルフィックチップは、ニューロモルフィックの原理に基づいて機能し、従来のシリコンベースのアーキテクチャよりも効率的に、認識、学習、意思決定などのさまざまなAIタスクを実行します。この先進のコンピューティング技術により、産業界はより高い効率と精度で複雑なタスクを実行できるマシンを開発できるようになっています。
ニューロモルフィックシステムの目的は、大幅に削減された消費電力で機能することであり、モバイルデバイス、エッジコンピューティングソリューション、センサーネットワークなどの低消費電力用途で優れています。さらに、データを並列処理し、リアルタイムの情報を扱い、スケーラビリティを持って適応的に学習する能力は、AI、ロボティクス、医療、省エネルギーコンピューティングなど、多様な部門にわたるその重要性を強く示しています。AIと機械学習の需要が高まり、医療におけるニューロモルフィックシステムの統合が進む中、ニューロモルフィックコンピューティング市場は予測期間に大きく成長する見込みです。
当レポートでは、世界のニューロモルフィックコンピューティング市場について調査分析し、市場規模の推計と機会の分析、競合情勢、企業プロファイル、メガトレンドなどの情報を提供しています。
目次
セクション1 レポートの概要
第1章 序文
第2章 調査手法
第3章 市場力学
第4章 マクロ経済指標
セクション2 定性的な知見
第5章 エグゼクティブサマリー
第6章 イントロダクション
第7章 規制シナリオ
セクション3 市場の概要
第8章 主要企業の包括的なデータベース
第9章 競合情勢
第10章 ホワイトスペースの分析
第11章 企業の競争力の分析
第12章 ニューロモルフィックコンピューティング市場におけるスタートアップエコシステム
セクション4 企業プロファイル
第13章 企業プロファイル
- 章の概要
- Accenture
- BrainChip Holdings
- Cadence Design Systems
- CEA-Leti
- General Vision
- Gr AI Matter Labs
- Hewlett Packard
- HRL Laboratories
- IBM
- Innatera Nanosystems
- Instar Robotics
- Intel
- Known
- Koniku
- Numenta
- Qualcomm
- Samsung Electronics
- SK Hynix
- NVIDIA
- SynSense
- Vicarious
セクション5 市場動向
第14章 メガトレンドの分析
第15章 アンメットニーズの分析
第16章 特許の分析
第17章 近年の発展
セクション6 市場機会の分析
第18章 世界のニューロモルフィックコンピューティング市場
第19章 市場機会:提供タイプ別
第20章 市場機会:用途タイプ別
第21章 市場機会:展開タイプ別
第22章 市場機会:エンドユーザータイプ別
第23章 北米のニューロモルフィックコンピューティング市場の機会
第24章 欧州のニューロモルフィックコンピューティング市場の機会
第25章 アジアのニューロモルフィックコンピューティング市場の機会
第26章 中東・北アフリカ(MENA)のニューロモルフィックコンピューティング市場の機会
第27章 ラテンアメリカのニューロモルフィックコンピューティング市場の機会
第28章 その他の地域のニューロモルフィックコンピューティング市場の機会
第29章 市場集中分析:主要企業別
第30章 隣接市場の分析
セクション7 戦略的ツール
第31章 勝利の鍵となる戦略
第32章 ポーターのファイブフォース分析
第33章 SWOTの分析
第34章 バリューチェーンの分析
第35章 Rootsの戦略的提言
セクション8 その他の独占的知見
第36章 1次調査からの知見
第37章 レポートの結論
セクション9 付録
目次
Neuromorphic Computing Market Overview
As per Roots Analysis, the global neuromorphic computing market size is estimated to grow from USD 2.60 billion in the current year to USD 61.48 billion by 2035, at a CAGR of 33.32% during the forecast period, till 2035.
The opportunity for neuromorphic computing market has been distributed across the following segments:
Type of Offering
- Hardware
- Memory
- Processors
- Sensors
- Others
- Software
- Platform for Neuromorphic Development
- Simulation and Modeling Tools
Type of Application
- Data Processing
- Image Processing
- Object Processing
- Pattern Recognition
- Signal Processing
- Others
Type of Deployment
- Cloud Computing
- Edge Computing
Type of End User
- Automotive
- Consumer Electronics
- Healthcare
- Industrial
- IT & Telecom
- Military & Defense
- Retail
- Others
Geographical Regions
- North America
- US
- Canada
- Mexico
- Other North American countries
- Europe
- Austria
- Belgium
- Denmark
- France
- Germany
- Ireland
- Italy
- Netherlands
- Norway
- Russia
- Spain
- Sweden
- Switzerland
- UK
- Other European countries
- Asia
- China
- India
- Japan
- Singapore
- South Korea
- Other Asian countries
- Latin America
- Brazil
- Chile
- Colombia
- Venezuela
- Other Latin American countries
- Middle East and North Africa
- Egypt
- Iran
- Iraq
- Israel
- Kuwait
- Saudi Arabia
- UAE
- Other MENA countries
- Rest of the World
- Australia
- New Zealand
- Other countries
Neuromorphic Computing Market: Growth and Trends
Neuromorphic computing is a computing paradigm that mimics the functioning of the human brain. It typically involves both hardware and software designed to emulate the brain's neural structure and synapses, allowing for more natural and efficient information processing. The first silicon neurons and synapses were created by Misha Mahowald and Carver Mead, who established the neuromorphic computing model in 1980. This approach is based on the biological method where the brain processes information in parallel through a network of interconnected neurons and synapses, which transmit chemical and electrical signals to facilitate communication between neurons.
In this regard, spiking neural networks (SNNs) represent a fundamental concept of neuromorphic computing, reflecting how biological systems communicate. SNNs consist of artificial neurons and synapses that spike, differing from traditional artificial neural networks (ANNs) that rely on continuous synchronous signals; instead, SNNs use spikes for data processing, improving power efficiency in real-time edge applications.
Within this framework, the hardware for neuromorphic computing includes specialized chips designed to replicate brain-like processing, playing a crucial role. These neuromorphic chips function based on neuromorphic principles to execute various artificial intelligence tasks, such as recognition, learning, and decision-making, more effectively than conventional silicon-based architectures. This advanced computing technology has enabled industries to develop machines capable of performing complex tasks with greater efficiency and precision.
The aim of neuromorphic systems is to function with significantly reduced power consumption, excelling in low-power applications such as mobile devices, edge computing solutions, and sensor networks. Furthermore, their ability to process data in parallel, handle real-time information, and adaptively learn with scalability underscores their significance across diverse sectors, including AI, robotics, healthcare, and energy-efficient computing. As the demand for artificial intelligence and machine learning rises, along with the integration of neuromorphic systems in healthcare, the neuromorphic computing market is expected to experience significant growth during the forecast period.
Neuromorphic Computing Market: Key Segments
Market Share by Type of Offering
Based on type of offering, the global neuromorphic computing market is segmented into hardware and software. According to our estimates, currently, the hardware segment which consists of neuromorphic processors, memory chips, sensors, and other devices, captures the majority share of the market. This can be attributed to the extensive development of neuromorphic chips, essential for brain-inspired computing architectures, which are crucial for executing tasks like real-time data processing, decision-making, and pattern recognition, thereby propelling market growth.
However, the market for software segment is expected to grow at a higher CAGR during the forecast period, driven by the growing adoption of neuromorphic computing software across various sectors for simulation and algorithm development, particularly with cloud deployment options available.
Market Share by Type of Application
Based on type of application, the neuromorphic computing market is segmented into data processing, image processing, object processing, pattern recognition, signal processing, and others. According to our estimates, currently, the image-processing application captures the majority of the market. This can be attributed to the substantial demand from autonomous vehicles where image processing is crucial for tasks like object detection, lane tracking, and real-time decision-making. Further, the extensive utilization of image processing in medical imaging, robotics, drones, and consumer electronics boosts the demand for neuromorphic computing.
However, the signal processing segment is expected to grow at a higher CAGR during the forecast period. This can be ascribed to the increasing demand from telecommunications aimed at optimizing network traffic management, signal transmission, and data routing. Additionally, the growing adoption of this technology in hearing aids, radar, and sonar systems is also expected to contribute to market growth.
Market Share by Type of Deployment
Based on type of deployment, the neuromorphic computing market is segmented into edge computing and cloud computing deployment. According to our estimates, currently, edge computing deployment captures the majority share of the market. This can be attributed to the critical role of edge computing in achieving low latency and real-time processing, enabling devices to react immediately without delays in data transmission. Additionally, edge devices typically operate with limited power resources, making them energy-efficient, which aligns well with neuromorphic chips designed for local data processing.
However, the cloud computing segment is expected to grow at a higher CAGR during the forecast period. This can be ascribed to the continuous technological advancements in a comprehensive platform for managing large volumes of data for businesses.
Market Share by Type of End User
Based on type of end user, the neuromorphic computing market is segmented into automotive, consumer electronics, healthcare, industrial, IT& telecom, military & defense, retail, and others. According to our estimates, currently, military and defense sector captures the majority share of the market. This can be attributed to the sector's specific needs and its uses in areas such as radar systems, surveillance, and combat systems, which require real-time decision-making, sophisticated data processing, and energy efficiency, thereby driving the growth of the neuromorphic computing market.
However, the automotive sector is expected to grow at a higher CAGR during the forecast period, owing to the increasing production of autonomous vehicles and advanced driver-assistance systems.
Market Share by Geographical Regions
Based on geographical regions, the neuromorphic computing market is segmented into North America, Europe, Asia, Latin America, Middle East and North Africa, and the rest of the world. According to our estimates, currently, North America captures the majority share of the market. However, the market in Asia is expected to grow at a higher CAGR during the forecast period, owing to the increased adoption of artificial intelligence, machine learning, IoT, and deep learning technologies, along with the growth of the IT sector in the region.
Example Players in Neuromorphic Computing Market
- Accenture
- Brain Chip Holdings
- Cadence-Design
- CEA-Leti
- General Vision
- Gr AI Matter Labs
- Hewlett Packard
- HP
- HRL Laboratories
- IBM
- Innatera Nanosytems
- Instar Robotics
- Intel
- Known
- Koniku
- Numenta
- Qualcomm
- Samsung Electronics
- SK HynixNVIDIA
- SynsSense
- Vicarious
Neuromorphic Computing Market: Research Coverage
The report on the neuromorphic computing market features insights on various sections, including:
- Market Sizing and Opportunity Analysis: An in-depth analysis of the neuromorphic computing market, focusing on key market segments, including [A] type of offering, [B] type of application, [C] type of deployment, [D] type of end user, and [E] geographical regions.
- Competitive Landscape: A comprehensive analysis of the companies engaged in the neuromorphic computing market, based on several relevant parameters, such as [A] year of establishment, [B] company size, [C] location of headquarters and [D] ownership structure.
- Company Profiles: Elaborate profiles of prominent players engaged in the neuromorphic computing market, providing details on [A] location of headquarters, [B] company size, [C] company mission, [D] company footprint, [E] management team, [F] contact details, [G] financial information, [H] operating business segments, [I] neuromorphic computing portfolio, [J] moat analysis, [K] recent developments, and an informed future outlook.
- Megatrends: An evaluation of ongoing megatrends in neuromorphic computing industry.
- Patent Analysis: An insightful analysis of patents filed / granted in the neuromorphic computing domain, based on relevant parameters, including [A] type of patent, [B] patent publication year, [C] patent age and [D] leading players.
- Recent Developments: An overview of the recent developments made in the neuromorphic computing market, along with analysis based on relevant parameters, including [A] year of initiative, [B] type of initiative, [C] geographical distribution and [D] most active players.
- Porter's Five Forces Analysis: An analysis of five competitive forces prevailing in the neuromorphic computing market, including threats of new entrants, bargaining power of buyers, bargaining power of suppliers, threats of substitute products and rivalry among existing competitors.
- SWOT Analysis: An insightful SWOT framework, highlighting the strengths, weaknesses, opportunities and threats in the domain. Additionally, it provides Harvey ball analysis, highlighting the relative impact of each SWOT parameter.
- Value Chain Analysis: A comprehensive analysis of the value chain, providing information on the different phases and stakeholders involved in the neuromorphic computing market.
Key Questions Answered in this Report
- How many companies are currently engaged in neuromorphic computing market?
- Which are the leading companies in this market?
- What factors are likely to influence the evolution of this market?
- What is the current and future market size?
- What is the CAGR of this market?
- How is the current and future market opportunity likely to be distributed across key market segments?
Reasons to Buy this Report
- The report provides a comprehensive market analysis, offering detailed revenue projections of the overall market and its specific sub-segments. This information is valuable to both established market leaders and emerging entrants.
- Stakeholders can leverage the report to gain a deeper understanding of the competitive dynamics within the market. By analyzing the competitive landscape, businesses can make informed decisions to optimize their market positioning and develop effective go-to-market strategies.
- The report offers stakeholders a comprehensive overview of the market, including key drivers, barriers, opportunities, and challenges. This information empowers stakeholders to stay abreast of market trends and make data-driven decisions to capitalize on growth prospects.
Additional Benefits
- Complimentary Excel Data Packs for all Analytical Modules in the Report
- 15% Free Content Customization
- Detailed Report Walkthrough Session with Research Team
- Free Updated report if the report is 6-12 months old or older
TABLE OF CONTENTS
SECTION I: REPORT OVERVIEW
1. PREFACE
- 1.1. Introduction
- 1.2. Market Share Insights
- 1.3. Key Market Insights
- 1.4. Report Coverage
- 1.5. Key Questions Answered
- 1.6. Chapter Outlines
2. RESEARCH METHODOLOGY
- 2.1. Chapter Overview
- 2.2. Research Assumptions
- 2.3. Database Building
- 2.3.1. Data Collection
- 2.3.2. Data Validation
- 2.3.3. Data Analysis
- 2.4. Project Methodology
- 2.4.1. Secondary Research
- 2.4.1.1. Annual Reports
- 2.4.1.2. Academic Research Papers
- 2.4.1.3. Company Websites
- 2.4.1.4. Investor Presentations
- 2.4.1.5. Regulatory Filings
- 2.4.1.6. White Papers
- 2.4.1.7. Industry Publications
- 2.4.1.8. Conferences and Seminars
- 2.4.1.9. Government Portals
- 2.4.1.10. Media and Press Releases
- 2.4.1.11. Newsletters
- 2.4.1.12. Industry Databases
- 2.4.1.13. Roots Proprietary Databases
- 2.4.1.14. Paid Databases and Sources
- 2.4.1.15. Social Media Portals
- 2.4.1.16. Other Secondary Sources
- 2.4.2. Primary Research
- 2.4.2.1. Introduction
- 2.4.2.2. Types
- 2.4.2.2.1. Qualitative
- 2.4.2.2.2. Quantitative
- 2.4.2.3. Advantages
- 2.4.2.4. Techniques
- 2.4.2.4.1. Interviews
- 2.4.2.4.2. Surveys
- 2.4.2.4.3. Focus Groups
- 2.4.2.4.4. Observational Research
- 2.4.2.4.5. Social Media Interactions
- 2.4.2.5. Stakeholders
- 2.4.2.5.1. Company Executives (CXOs)
- 2.4.2.5.2. Board of Directors
- 2.4.2.5.3. Company Presidents and Vice Presidents
- 2.4.2.5.4. Key Opinion Leaders
- 2.4.2.5.5. Research and Development Heads
- 2.4.2.5.6. Technical Experts
- 2.4.2.5.7. Subject Matter Experts
- 2.4.2.5.8. Scientists
- 2.4.2.5.9. Doctors and Other Healthcare Providers
- 2.4.2.6. Ethics and Integrity
- 2.4.2.6.1. Research Ethics
- 2.4.2.6.2. Data Integrity
- 2.4.3. Analytical Tools and Databases
- 2.4.1. Secondary Research
3. MARKET DYNAMICS
- 3.1. Forecast Methodology
- 3.1.1. Top-Down Approach
- 3.1.2. Bottom-Up Approach
- 3.1.3. Hybrid Approach
- 3.2. Market Assessment Framework
- 3.2.1. Total Addressable Market (TAM)
- 3.2.2. Serviceable Addressable Market (SAM)
- 3.2.3. Serviceable Obtainable Market (SOM)
- 3.2.4. Currently Acquired Market (CAM)
- 3.3. Forecasting Tools and Techniques
- 3.3.1. Qualitative Forecasting
- 3.3.2. Correlation
- 3.3.3. Regression
- 3.3.4. Time Series Analysis
- 3.3.5. Extrapolation
- 3.3.6. Convergence
- 3.3.7. Forecast Error Analysis
- 3.3.8. Data Visualization
- 3.3.9. Scenario Planning
- 3.3.10. Sensitivity Analysis
- 3.4. Key Considerations
- 3.4.1. Demographics
- 3.4.2. Market Access
- 3.4.3. Reimbursement Scenarios
- 3.4.4. Industry Consolidation
- 3.5. Robust Quality Control
- 3.6. Key Market Segmentations
- 3.7. Limitations
4. MACRO-ECONOMIC INDICATORS
- 4.1. Chapter Overview
- 4.2. Market Dynamics
- 4.2.1. Time Period
- 4.2.1.1. Historical Trends
- 4.2.1.2. Current and Forecasted Estimates
- 4.2.2. Currency Coverage
- 4.2.2.1. Overview of Major Currencies Affecting the Market
- 4.2.2.2. Impact of Currency Fluctuations on the Industry
- 4.2.3. Foreign Exchange Impact
- 4.2.3.1. Evaluation of Foreign Exchange Rates and Their Impact on Market
- 4.2.3.2. Strategies for Mitigating Foreign Exchange Risk
- 4.2.4. Recession
- 4.2.4.1. Historical Analysis of Past Recessions and Lessons Learnt
- 4.2.4.2. Assessment of Current Economic Conditions and Potential Impact on the Market
- 4.2.5. Inflation
- 4.2.5.1. Measurement and Analysis of Inflationary Pressures in the Economy
- 4.2.5.2. Potential Impact of Inflation on the Market Evolution
- 4.2.6. Interest Rates
- 4.2.6.1. Overview of Interest Rates and Their Impact on the Market
- 4.2.6.2. Strategies for Managing Interest Rate Risk
- 4.2.7. Commodity Flow Analysis
- 4.2.7.1. Type of Commodity
- 4.2.7.2. Origins and Destinations
- 4.2.7.3. Values and Weights
- 4.2.7.4. Modes of Transportation
- 4.2.8. Global Trade Dynamics
- 4.2.8.1. Import Scenario
- 4.2.8.2. Export Scenario
- 4.2.9. War Impact Analysis
- 4.2.9.1. Russian-Ukraine War
- 4.2.9.2. Israel-Hamas War
- 4.2.10. COVID Impact / Related Factors
- 4.2.10.1. Global Economic Impact
- 4.2.10.2. Industry-specific Impact
- 4.2.10.3. Government Response and Stimulus Measures
- 4.2.10.4. Future Outlook and Adaptation Strategies
- 4.2.11. Other Indicators
- 4.2.11.1. Fiscal Policy
- 4.2.11.2. Consumer Spending
- 4.2.11.3. Gross Domestic Product (GDP)
- 4.2.11.4. Employment
- 4.2.11.5. Taxes
- 4.2.11.6. R&D Innovation
- 4.2.11.7. Stock Market Performance
- 4.2.11.8. Supply Chain
- 4.2.11.9. Cross-Border Dynamics
- 4.2.1. Time Period
SECTION II: QUALITATIVE INSIGHTS
5. EXECUTIVE SUMMARY
6. INTRODUCTION
- 6.1. Chapter Overview
- 6.2. Overview of Neuromorphic Computing Market
- 6.2.1. Type of Offering
- 6.2.2. Type of Application
- 6.2.3. Type of Deployment
- 6.2.4. Type of End User
- 6.3. Future Perspective
7. REGULATORY SCENARIO
SECTION III: MARKET OVERVIEW
8. COMPREHENSIVE DATABASE OF LEADING PLAYERS
9. COMPETITIVE LANDSCAPE
- 9.1. Chapter Overview
- 9.2. Neuromorphic Computing: Overall Market Landscape
- 9.2.1. Analysis by Year of Establishment
- 9.2.2. Analysis by Company Size
- 9.2.3. Analysis by Location of Headquarters
- 9.2.4. Analysis by Ownership Structure
10. WHITE SPACE ANALYSIS
11. COMPANY COMPETITIVENESS ANALYSIS
12. STARTUP ECOSYSTEM IN THE NEUROMORPHIC COMPUTING MARKET
- 12.1. Neuromorphic Computing: Market Landscape of Startups
- 12.1.1. Analysis by Year of Establishment
- 12.1.2. Analysis by Company Size
- 12.1.3. Analysis by Company Size and Year of Establishment
- 12.1.4. Analysis by Location of Headquarters
- 12.1.5. Analysis by Company Size and Location of Headquarters
- 12.1.6. Analysis by Ownership Structure
- 12.2. Key Findings
SECTION IV: COMPANY PROFILES
13. COMPANY PROFILES
- 13.1. Chapter Overview
- 13.2. Accenture *
- 13.2.1. Company Overview
- 13.2.2. Company Mission
- 13.2.3. Company Footprint
- 13.2.4. Management Team
- 13.2.5. Contact Details
- 13.2.6. Financial Performance
- 13.2.7. Operating Business Segments
- 13.2.8. Service / Product Portfolio (project specific)
- 13.2.9. MOAT Analysis
- 13.2.10. Recent Developments and Future Outlook
- 13.3. BrainChip Holdings
- 13.4. Cadence Design Systems
- 13.5. CEA-Leti
- 13.6. General Vision
- 13.7. Gr AI Matter Labs
- 13.8. Hewlett Packard
- 13.9. HRL Laboratories
- 13.10. IBM
- 13.11. Innatera Nanosystems
- 13.12. Instar Robotics
- 13.13. Intel
- 13.14. Known
- 13.15. Koniku
- 13.16. Numenta
- 13.17. Qualcomm
- 13.18. Samsung Electronics
- 13.19. SK Hynix
- 13.20. NVIDIA
- 13.21. SynSense
- 13.22. Vicarious
SECTION V: MARKET TRENDS
14. MEGA TRENDS ANALYSIS
15. UNMEET NEED ANALYSIS
16. PATENT ANALYSIS
17. RECENT DEVELOPMENTS
- 17.1. Chapter Overview
- 17.2. Recent Funding
- 17.3. Recent Partnerships
- 17.4. Other Recent Initiatives
SECTION VI: MARKET OPPORTUNITY ANALYSIS
18. GLOBAL NEUROMORPHIC COMPUTING MARKET
- 18.1. Chapter Overview
- 18.2. Key Assumptions and Methodology
- 18.3. Trends Disruption Impacting Market
- 18.4. Demand Side Trends
- 18.5. Supply Side Trends
- 18.6. Global Neuromorphic Computing, Historical Trends (Since 2019) and Forecasted Estimates (Till 2035)
- 18.7. Multivariate Scenario Analysis
- 18.7.1. Conservative Scenario
- 18.7.2. Optimistic Scenario
- 18.8. Investment Feasibility Index
- 18.9. Key Market Segmentations
19. MARKET OPPORTUNITIES BASED ON TYPE OF OFFERING
- 19.1. Chapter Overview
- 19.2. Key Assumptions and Methodology
- 19.3. Revenue Shift Analysis
- 19.4. Market Movement Analysis
- 19.5. Penetration-Growth (P-G) Matrix
- 19.6. Neuromorphic Computing Market for Hardware: Historical Trends (Since 2019) and Forecasted Estimates (Till 2035)
- 19.7. Neuromorphic Computing Market for Software: Historical Trends (Since 2019) and Forecasted Estimates (Till 2035)
- 19.8. Data Triangulation and Validation
- 19.8.1. Secondary Sources
- 19.8.2. Primary Sources
- 19.8.3. Statistical Modeling
20. MARKET OPPORTUNITIES BASED ON TYPE OF APPLICATION
- 20.1. Chapter Overview
- 20.2. Key Assumptions and Methodology
- 20.3. Revenue Shift Analysis
- 20.4. Market Movement Analysis
- 20.5. Penetration-Growth (P-G) Matrix
- 20.6. Neuromorphic Computing Market for Data Processing: Historical Trends (Since 2019) and Forecasted Estimates (Till 2035)
- 20.7. Neuromorphic Computing Market for Image Processing: Historical Trends (Since 2019) and Forecasted Estimates (Till 2035)
- 20.8. Neuromorphic Computing Market for Object Processing: Historical Trends (Since 2019) and Forecasted Estimates (Till 2035)
- 20.9. Neuromorphic Computing Market for Pattern Recognition: Historical Trends (Since 2019) and Forecasted Estimates (Till 2035)
- 20.10. Neuromorphic Computing Market for Signal Processing: Historical Trends (Since 2019) and Forecasted Estimates (Till 2035)
- 20.11. Neuromorphic Computing Market for Others: Historical Trends (Since 2019) and Forecasted Estimates (Till 2035)
- 20.12. Data Triangulation and Validation
- 20.12.1. Secondary Sources
- 20.12.2. Primary Sources
- 20.12.3. Statistical Modeling
21. MARKET OPPORTUNITIES BASED ON TYPE OF DEPLOYMENT
- 21.1. Chapter Overview
- 21.2. Key Assumptions and Methodology
- 21.3. Revenue Shift Analysis
- 21.4. Market Movement Analysis
- 21.5. Penetration-Growth (P-G) Matrix
- 21.6. Neuromorphic Computing Market for Cloud Computing: Historical Trends (Since 2019) and Forecasted Estimates (Till 2035)
- 21.7. Neuromorphic Computing Market for Edge Computing: Historical Trends (Since 2019) and Forecasted Estimates (Till 2035)
- 21.8. Data Triangulation and Validation
- 21.8.1. Secondary Sources
- 21.8.2. Primary Sources
- 21.8.3. Statistical Modeling
22. MARKET OPPORTUNITIES BASED ON TYPE OF END USER
- 22.1. Chapter Overview
- 22.2. Key Assumptions and Methodology
- 22.3. Revenue Shift Analysis
- 22.4. Market Movement Analysis
- 22.5. Penetration-Growth (P-G) Matrix
- 22.6. Neuromorphic Computing Market for Automotive: Historical Trends (Since 2019) and Forecasted Estimates (Till 2035)
- 22.7. Neuromorphic Computing Market for Consumer Electronics: Historical Trends (Since 2019) and Forecasted Estimates (Till 2035)
- 22.8. Neuromorphic Computing Market for Healthcare: Historical Trends (Since 2019) and Forecasted Estimates (Till 2035)
- 22.9. Neuromorphic Computing Market for Industrial: Historical Trends (Since 2019) and Forecasted Estimates (Till 2035)
- 22.10. Neuromorphic Computing Market for IT & Telecom: Historical Trends (Since 2019) and Forecasted Estimates (Till 2035)
- 22.11. Neuromorphic Computing Market for Military & Defense: Historical Trends (Since 2019) and Forecasted Estimates (Till 2035)
- 22.12. Neuromorphic Computing Market for Retail: Historical Trends (Since 2019) and Forecasted Estimates (Till 2035)
- 22.13. Neuromorphic Computing Market for Others: Historical Trends (Since 2019) and Forecasted Estimates (Till 2035)
- 22.14. Data Triangulation and Validation
- 22.14.1. Secondary Sources
- 22.14.2. Primary Sources
- 22.14.3. Statistical Modeling
23. MARKET OPPORTUNITIES FOR NEUROMORPHIC COMPUTING IN NORTH AMERICA
- 23.1. Chapter Overview
- 23.2. Key Assumptions and Methodology
- 23.3. Revenue Shift Analysis
- 23.4. Market Movement Analysis
- 23.5. Penetration-Growth (P-G) Matrix
- 23.6. Neuromorphic Computing Market in North America: Historical Trends (Since 2019) and Forecasted Estimates (Till 2035)
- 23.6.1. Neuromorphic Computing Market in the US: Historical Trends (Since 2019) and Forecasted Estimates (Till 2035)
- 23.6.2. Neuromorphic Computing Market in Canada: Historical Trends (Since 2019) and Forecasted Estimates (Till 2035)
- 23.6.3. Neuromorphic Computing Market in Mexico: Historical Trends (Since 2019) and Forecasted Estimates (Till 2035)
- 23.6.4. Neuromorphic Computing Market in Other North American Countries: Historical Trends (Since 2019) and Forecasted Estimates (Till 2035)
- 23.7. Data Triangulation and Validation
24. MARKET OPPORTUNITIES FOR NEUROMORPHIC COMPUTING IN EUROPE
- 24.1. Chapter Overview
- 24.2. Key Assumptions and Methodology
- 24.3. Revenue Shift Analysis
- 24.4. Market Movement Analysis
- 24.5. Penetration-Growth (P-G) Matrix
- 24.6. Neuromorphic Computing Market in Europe: Historical Trends (Since 2019) and Forecasted Estimates (Till 2035)
- 24.6.1. Neuromorphic Computing Market in Austria: Historical Trends (Since 2019) and Forecasted Estimates (Till 2035)
- 24.6.2. Neuromorphic Computing Market in Belgium: Historical Trends (Since 2019) and Forecasted Estimates (Till 2035)
- 24.6.3. Neuromorphic Computing Market in Denmark: Historical Trends (Since 2019) and Forecasted Estimates (Till 2035)
- 24.6.4. Neuromorphic Computing Market in France: Historical Trends (Since 2019) and Forecasted Estimates (Till 2035)
- 24.6.5. Neuromorphic Computing Market in Germany: Historical Trends (Since 2019) and Forecasted Estimates (Till 2035)
- 24.6.6. Neuromorphic Computing Market in Ireland: Historical Trends (Since 2019) and Forecasted Estimates (Till 2035)
- 24.6.7. Neuromorphic Computing Market in Italy: Historical Trends (Since 2019) and Forecasted Estimates (Till 2035)
- 24.6.8. Neuromorphic Computing Market in Netherlands: Historical Trends (Since 2019) and Forecasted Estimates (Till 2035)
- 24.6.9. Neuromorphic Computing Market in Norway: Historical Trends (Since 2019) and Forecasted Estimates (Till 2035)
- 24.6.10. Neuromorphic Computing Market in Russia: Historical Trends (Since 2019) and Forecasted Estimates (Till 2035)
- 24.6.11. Neuromorphic Computing Market in Spain: Historical Trends (Since 2019) and Forecasted Estimates (Till 2035)
- 24.6.12. Neuromorphic Computing Market in Sweden: Historical Trends (Since 2019) and Forecasted Estimates (Till 2035)
- 24.6.13. Neuromorphic Computing Market in Sweden: Historical Trends (Since 2019) and Forecasted Estimates (Till 2035)
- 24.6.14. Neuromorphic Computing Market in Switzerland: Historical Trends (Since 2019) and Forecasted Estimates (Till 2035)
- 24.6.15. Neuromorphic Computing Market in the UK: Historical Trends (Since 2019) and Forecasted Estimates (Till 2035)
- 24.6.16. Neuromorphic Computing Market in Other European Countries: Historical Trends (Since 2019) and Forecasted Estimates (Till 2035)
- 24.7. Data Triangulation and Validation
25. MARKET OPPORTUNITIES FOR NEUROMORPHIC COMPUTING IN ASIA
- 25.1. Chapter Overview
- 25.2. Key Assumptions and Methodology
- 25.3. Revenue Shift Analysis
- 25.4. Market Movement Analysis
- 25.5. Penetration-Growth (P-G) Matrix
- 25.6. Neuromorphic Computing Market in Asia: Historical Trends (Since 2019) and Forecasted Estimates (Till 2035)
- 25.6.1. Neuromorphic Computing Market in China: Historical Trends (Since 2019) and Forecasted Estimates (Till 2035)
- 25.6.2. Neuromorphic Computing Market in India: Historical Trends (Since 2019) and Forecasted Estimates (Till 2035)
- 25.6.3. Neuromorphic Computing Market in Japan: Historical Trends (Since 2019) and Forecasted Estimates (Till 2035)
- 25.6.4. Neuromorphic Computing Market in Singapore: Historical Trends (Since 2019) and Forecasted Estimates (Till 2035)
- 25.6.5. Neuromorphic Computing Market in South Korea: Historical Trends (Since 2019) and Forecasted Estimates (Till 2035)
- 25.6.6. Neuromorphic Computing Market in Other Asian Countries: Historical Trends (Since 2019) and Forecasted Estimates (Till 2035)
- 25.7. Data Triangulation and Validation
26. MARKET OPPORTUNITIES FOR NEUROMORPHIC COMPUTING IN MIDDLE EAST AND NORTH AFRICA (MENA)
- 26.1. Chapter Overview
- 26.2. Key Assumptions and Methodology
- 26.3. Revenue Shift Analysis
- 26.4. Market Movement Analysis
- 26.5. Penetration-Growth (P-G) Matrix
- 26.6. Neuromorphic Computing Market in Middle East and North Africa (MENA): Historical Trends (Since 2019) and Forecasted Estimates (Till 2035)
- 26.6.1. Neuromorphic Computing Market in Egypt: Historical Trends (Since 2019) and Forecasted Estimates (Till 205)
- 26.6.2. Neuromorphic Computing Market in Iran: Historical Trends (Since 2019) and Forecasted Estimates (Till 2035)
- 26.6.3. Neuromorphic Computing Market in Iraq: Historical Trends (Since 2019) and Forecasted Estimates (Till 2035)
- 26.6.4. Neuromorphic Computing Market in Israel: Historical Trends (Since 2019) and Forecasted Estimates (Till 2035)
- 26.6.5. Neuromorphic Computing Market in Kuwait: Historical Trends (Since 2019) and Forecasted Estimates (Till 2035)
- 26.6.6. Neuromorphic Computing Market in Saudi Arabia: Historical Trends (Since 2019) and Forecasted Estimates (Till 2035)
- 26.6.7. Neuromorphic Computing Marke in United Arab Emirates (UAE): Historical Trends (Since 2019) and Forecasted Estimates (Till 2035)
- 26.6.8. Neuromorphic Computing Market in Other MENA Countries: Historical Trends (Since 2019) and Forecasted Estimates (Till 2035)
- 26.7. Data Triangulation and Validation
27. MARKET OPPORTUNITIES FOR NEUROMORPHIC COMPUTING IN LATIN AMERICA
- 27.1. Chapter Overview
- 27.2. Key Assumptions and Methodology
- 27.3. Revenue Shift Analysis
- 27.4. Market Movement Analysis
- 27.5. Penetration-Growth (P-G) Matrix
- 27.6. Neuromorphic Computing Market in Latin America: Historical Trends (Since 2019) and Forecasted Estimates (Till 2035)
- 27.6.1. Neuromorphic Computing Market in Argentina: Historical Trends (Since 2019) and Forecasted Estimates (Till 2035)
- 27.6.2. Neuromorphic Computing Market in Brazil: Historical Trends (Since 2019) and Forecasted Estimates (Till 2035)
- 27.6.3. Neuromorphic Computing Market in Chile: Historical Trends (Since 2019) and Forecasted Estimates (Till 2035)
- 27.6.4. Neuromorphic Computing Market in Colombia Historical Trends (Since 2019) and Forecasted Estimates (Till 2035)
- 27.6.5. Neuromorphic Computing Market in Venezuela: Historical Trends (Since 2019) and Forecasted Estimates (Till 2035)
- 27.6.6. Neuromorphic Computing Market in Other Latin American Countries: Historical Trends (Since 2019) and Forecasted Estimates (Till 2035)
- 27.7. Data Triangulation and Validation
28. MARKET OPPORTUNITIES FOR NEUROMORPHIC COMPUTING IN REST OF THE WORLD
- 28.1. Chapter Overview
- 28.2. Key Assumptions and Methodology
- 28.3. Revenue Shift Analysis
- 28.4. Market Movement Analysis
- 28.5. Penetration-Growth (P-G) Matrix
- 28.6. Neuromorphic Computing Market in Rest of the World: Historical Trends (Since 2019) and Forecasted Estimates (Till 2035)
- 28.6.1. Neuromorphic Computing Market in Australia: Historical Trends (Since 2019) and Forecasted Estimates (Till 2035)
- 28.6.2. Neuromorphic Computing Market in New Zealand: Historical Trends (Since 2019) and Forecasted Estimates (Till 2035)
- 28.6.3. Neuromorphic Computing Market in Other Countries
- 28.7. Data Triangulation and Validation
29. MARKET CONCENTRATION ANALYSIS: DISTRIBUTION BY LEADING PLAYERS
- 29.1. Leading Player 1
- 29.2. Leading Player 2
- 29.3. Leading Player 3
- 29.4. Leading Player 4
- 29.5. Leading Player 5
- 29.6. Leading Player 6
- 29.7. Leading Player 7
- 29.8. Leading Player 8
30. ADJACENT MARKET ANALYSIS
SECTION VII: STRATEGIC TOOLS
31. KEY WINNING STRATEGIES
32. PORTER'S FIVE FORCES ANALYSIS
33. SWOT ANALYSIS
34. VALUE CHAIN ANALYSIS
35. ROOTS STRATEGIC RECOMMENDATIONS
- 35.1. Chapter Overview
- 35.2. Key Business-related Strategies
- 35.2.1. Research & Development
- 35.2.2. Product Manufacturing
- 35.2.3. Commercialization / Go-to-Market
- 35.2.4. Sales and Marketing
- 35.3. Key Operations-related Strategies
- 35.3.1. Risk Management
- 35.3.2. Workforce
- 35.3.3. Finance
- 35.3.4. Others
SECTION VIII: OTHER EXCLUSIVE INSIGHTS
36. INSIGHTS FROM PRIMARY RESEARCH
37. REPORT CONCLUSION
SECTION IX: APPENDIX
38. TABULATED DATA
39. LIST OF COMPANIES AND ORGANIZATIONS
40. CUSTOMIZATION OPPORTUNITIES
41. ROOTS SUBSCRIPTION SERVICES
42. AUTHOR DETAILS
- 発行日
- 発行
- Roots Analysis
- ページ情報
- 英文 177 Pages
- 納期
- 7~10営業日