
廃棄物発電市場:産業動向・世界の予測 (~2035年):技術タイプ・廃棄物タイプ・形態・用途・企業規模・主要地域別
Waste To Energy Market Till 2035: Distribution by Type of Technology, Type of Waste, Type of Form, Areas of Application, Company Size, and Key Geographical Regions: Industry Trends and Global Forecasts- 発行日
- ページ情報
- 英文 196 Pages
- 納期
- 7~10営業日
- 商品コード
- 1796408
- カスタマイズ可能 お客様のご希望に応じて、既存データの加工や未掲載情報(例:国別セグメント)の追加などの対応が可能です。詳細はお問い合わせください。
- 翻訳ツール提供対象 PDF対応AI翻訳ツールの無料貸し出しサービスのご利用が可能です
- 医薬品関連専門 医薬品関連専門を専門とする市場調査会社です。
概要
廃棄物発電市場:概要
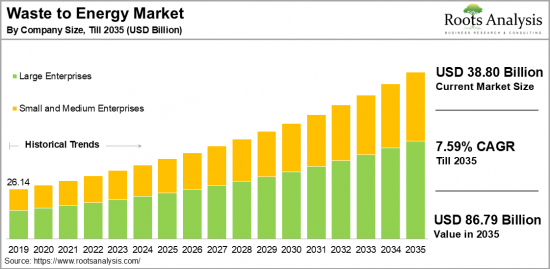
Roots Analysisによると、世界の廃棄物発電の市場規模は、2035年までの予測期間中にCAGR 7.59%で、現在の388億米ドルから2035年までに867億9,000万米ドルに成長すると予測されています。
廃棄物発電市場の機会:分類
技術タイプ
- 嫌気性消化
- 生化学的処理
- 焼却
- 物理的処理
- 熱化学的処理
- その他
廃棄物タイプ
- 農業廃棄物
- 都市固形廃棄物 (MSW)
- その他
形態
- 電気
- 温水
- 蒸気
用途
- エネルギー生成
- 廃棄物処理
- 廃棄物量削減
- その他
企業規模
- 大企業
- 中小企業
地域
- 北米
- 米国
- カナダ
- メキシコ
- その他の北米諸国
- 欧州
- オーストリア
- ベルギー
- デンマーク
- フランス
- ドイツ
- アイルランド
- イタリア
- オランダ
- ノルウェー
- ロシア
- スペイン
- スウェーデン
- スイス
- 英国
- その他の欧州諸国
- アジア
- 中国
- インド
- 日本
- シンガポール
- 韓国
- その他のアジア諸国
- ラテンアメリカ
- ブラジル
- チリ
- コロンビア
- ベネズエラ
- その他のラテンアメリカ諸国
- 中東・北アフリカ
- エジプト
- イラン
- イラク
- イスラエル
- クウェート
- サウジアラビア
- アラブ首長国連邦
- その他の中東・北アフリカ諸国
- 世界のその他の地域
- オーストラリア
- ニュージーランド
- その他の国
廃棄物発電市場:成長と動向
一般的に「エネルギー回収型廃棄物処理」と呼ばれる廃棄物発電 (WTE) は、熱化学的および生化学的手法を用いて都市廃棄物からエネルギーを取り出し、電力、蒸気、燃料を生み出す技術です。これらの先進的技術によって、廃棄物の性質や生成するエネルギーの用途に応じて、元の廃棄物体積を最大90%まで削減することが可能です。WTEプラントには大きく2つの利点があります。第一に、環境に配慮した廃棄物管理・処分手段を提供すること、第二にクリーンな電力を生み出すことです。固形廃棄物や液体廃棄物の処理戦略としてWTEを導入することにより、特に温室効果ガス排出削減の点で、都市ごみ処理が環境に与える影響を大幅に軽減しています。
世界人口の増加と経済発展によりエネルギー需要が高まり、WTE施設はその需要を満たす上で不可欠な存在となっています。これらのプラントは信頼性の高い再生可能エネルギー源として機能し、化石燃料への依存を効果的に低減します。さらに、埋立地の利用削減や温室効果ガス排出削減を目的とする各国政府の厳格な規制も、廃棄物発電プログラムの拡大を後押ししています。総じて、こうした要因により、廃棄物発電市場は予測期間中に拡大すると見込まれています。
当レポートでは、世界の廃棄物発電の市場を調査し、 市場概要、背景、市場影響因子の分析、市場規模の推移・予測、各種区分・地域別の詳細分析、競合情勢、主要企業のプロファイルなどをまとめています。
目次
セクションI:レポート概要
第1章 序文
第2章 調査手法
第3章 市場力学
第4章 マクロ経済指標
セクションII:定性的洞察
第5章 エグゼクティブサマリー
第6章 イントロダクション
第7章 規制シナリオ
セクションIII:市場概要
第8章 主要企業の包括的データベース
第9章 競合情勢
第10章 ホワイトスペース分析
第11章 企業の競争力分析
第12章 廃棄物発電市場におけるスタートアップエコシステム
セクションIV:企業プロファイル
第13章 企業プロファイル
- 章の概要
- A2A SpA
- Abu Dhabi National Energy
- Allseas
- AVR
- Babcock &Wilcox
- Biffa
- China Everbright Environment
- Covanta
- EDF
- Foster Wheeler
- Green Conversion Systems
- Hitachi Zosen
- Huawei
- JANSEN Combustion and Boiler
- Keppel Seghers
- Martin
- Mitsubishi Heavy
- MVV Energie
セクションV:市場動向
第14章 メガトレンド分析
第15章 アンメットニーズの分析
第16章 特許分析
第17章 最近の動向
セクションVI:市場機会の分析
第18章 世界の廃棄物発電市場
第19章 技術別の市場機会
第20章 廃棄物タイプ別の市場機会
第21章 形態別の市場機会
第22章 用途別の市場機会
第23章 北米における廃棄物発電の市場機会
第24章 欧州における廃棄物発電の市場機会
第25章 アジアにおける廃棄物発電の市場機会
第26章 中東・北アフリカにおける廃棄物発電の市場機会
第27章 ラテンアメリカにおける廃棄物発電の市場機会
第28章 世界のその他の地域における廃棄物発電の市場機会
第29章 市場集中分析:主要企業の分布
第30章 隣接市場分析
セクションVII:戦略ツール
第31章 勝利の鍵となる戦略
第32章 ポーターのファイブフォース分析
第33章 SWOT分析
第34章 バリューチェーン分析
第35章 ROOTS戦略提言
セクションVIII:その他の独占的洞察
第36章 1次調査からの洞察
第37章 報告書の結論
セクションIX:付録
第38章 表形式データ
第39章 企業・団体一覧
第40章 カスタマイズの機会
第41章 ROOTSサブスクリプションサービス
第42章 著者詳細
目次
Waste To Energy Market Overview
As per Roots Analysis, the global waste to energy market size is estimated to grow from USD 38.80 billion in the current year to USD 86.79 billion by 2035, at a CAGR of 7.59% during the forecast period, till 2035.
The opportunity for waste to energy market has been distributed across the following segments:
Type of Technology
- Anaerobic Digestion
- Biochemical
- Incineration
- Physical
- Thermochemical
- Others
Type of Waste
- Agricultural Waste
- Municipal Solid Waste (MSW)
- Others
Type of Form
- Electricity
- Hot Water
- Steam
Areas of Application
- Generation of Energy
- Treatment of Waste
- Reduction of Waste Volume
- Others
Company Size
- Large Enterprises
- Small and Medium Enterprises
Geographical Regions
- North America
- US
- Canada
- Mexico
- Other North American countries
- Europe
- Austria
- Belgium
- Denmark
- France
- Germany
- Ireland
- Italy
- Netherlands
- Norway
- Russia
- Spain
- Sweden
- Switzerland
- UK
- Other European countries
- Asia
- China
- India
- Japan
- Singapore
- South Korea
- Other Asian countries
- Latin America
- Brazil
- Chile
- Colombia
- Venezuela
- Other Latin American countries
- Middle East and North Africa
- Egypt
- Iran
- Iraq
- Israel
- Kuwait
- Saudi Arabia
- UAE
- Other MENA countries
- Rest of the World
- Australia
- New Zealand
- Other countries
WASTE TO ENERGY MARKET: GROWTH AND TRENDS
Waste-to-Energy (WTE), commonly known as energy from waste, encompasses the utilization of thermochemical and biochemical techniques to harness energy from urban waste, resulting in electricity, steam, and fuels. These cutting-edge technologies can reduce the original waste volume by up to 90%, depending on the composition of the waste and the desired application of the energy generated. WTE plants offer two main benefits: they provide environmentally responsible waste management and disposal options while producing clean electricity. The growing implementation of WTE as a strategy for handling both solid and liquid waste has significantly alleviated the environmental impacts of municipal solid waste management, especially in terms of lowering greenhouse gas emissions.
The increase in global population and economic development has led to a rising demand for energy, making WTE facilities vital in fulfilling this requirement. These plants act as a reliable source of renewable energy, effectively reducing reliance on fossil fuels. Further, strict government regulations aimed at minimizing landfill usage and reducing greenhouse gas emissions further support the growth of waste-to-energy programs. Overall, owing to these factors, the waste to energy market is expected to increase during the forecast period.
WASTE TO ENERGY MARKET: KEY SEGMENTS
Market Share by Type of Technology
Based on type of technology, the global waste to energy market is segmented into anaerobic digestion, biochemical, incineration, physical, thermochemical and others. According to our estimates, currently, the incineration segment captures the majority share of the market. This can be attributed to effectiveness in minimizing waste volume while producing energy through high-temperature combustion. This method has become widely accepted and is favored for its reliability and capability to handle various waste types.
However, thermochemical technologies segment is expected to grow at a relatively higher CAGR during the forecast period. This can be attributed to the application of technologies such as gasification and pyrolysis in this segment. The improvements in efficiency and their correspondence with the rising demand for sustainable energy solutions are propelling market expansion.
Market Share by Type of Waste
Based on type of waste, the waste to energy market is segmented into agricultural waste, municipal solid waste (MSW), and others. According to our estimates, currently, the municipal solid waste (MSW) segment captures the majority of the market. This can be attributed to the significant availability and steady generation of this waste from households, businesses, and institutions. This segment is recognized for its capability to effectively transform waste into renewable energy while simultaneously decreasing landfill usage and greenhouse gas emissions.
However, the agricultural waste segment is expected to grow at a relatively higher CAGR during the forecast period. This can be attributed to the technological innovations that improve the efficiency of converting agricultural waste into energy, aligning with global trends towards renewable energy and sustainable waste management practices.
Market Share by Type of Form
Based on type of form, the waste to energy market is segmented into electricity, hot water and steam. According to our estimates, currently, the electricity segment captures the majority of the market. This can be attributed to the rising demand for sustainable energy options and the influence of government regulations that encourage renewable energy production from waste.
However, the hot water and steam segment is expected to grow at a relatively higher CAGR during the forecast period. This increase is due to the innovations in waste to energy technologies and growing uses in industrial processes that need thermal energy.
Market Share by Areas of Application
Based on areas of application, the waste to energy market is segmented into generation of energy, treatment of waste, reduction of waste volume and others. According to our estimates, currently, the generation of energy segment captures the majority of the market. This can be attributed to the global transition toward sustainable energy initiatives and rising government incentives to encourage eco-friendly practices.
However, the reduction of waste volume segment is expected to grow at a relatively higher CAGR during the forecast period. This increase is due to innovations in waste processing technologies that not only reduce waste but also aid in the generation of cleaner energy, thus promoting sustainability objectives.
Market Share by Company Size
Based on company size, the waste to energy market is segmented into large and small and medium enterprise. According to our estimates, currently, the large enterprise segment captures the majority of the market. However, small and medium-sized enterprises are expected to grow at a relatively higher CAGR during the forecast period. This can be attributed to their agility, innovative approaches, focus on specialized markets, and capacity to adapt to evolving customer demands and market dynamics.
Market Share by Geographical Regions
Based on geographical regions, the waste to energy market is segmented into North America, Europe, Asia, Latin America, Middle East and North Africa, and the rest of the world. According to our estimates, currently, Asia captures the majority share of the market. This increase can be attributed to the rising economic activities, which in turn have led to an increase in waste generation. Consequently, various Asian governments have established waste-to-energy facilities, further promoting the growth of the waste-to-energy sector.
Example Players in Waste to Energy Market
- A2A SpA
- Abu Dhabi National Energy
- Allseas
- AVR
- Babcock & Wilcox
- Biffa
- China Everbright Environment
- Covanta
- EDF
- Foster Wheeler
- Green Conversion Systems
- Hitachi Zosen
- Huawei
- JANSEN Combustion and Boiler
- Keppel Seghers
- Martin
- Mitsubishi Heavy
- MVV Energie
- Recology
- SUEZ
- Sims
- Stericycle
- Velocys
- Veolia Environnement
- Viridor
- Waste Connections
- Waste Management
- Wheelabrator Technologies
- WM Intellectual Property Holdings
- Xcel Energy
WASTE TO ENERGY MARKET: RESEARCH COVERAGE
The report on the waste to energy market features insights on various sections, including:
- Market Sizing and Opportunity Analysis: An in-depth analysis of the waste to energy market, focusing on key market segments, including [A] type of technology, [B] type of waste, [C] type of form, [D] areas of application, [E] company size, and [F] key geographical regions.
- Competitive Landscape: A comprehensive analysis of the companies engaged in the waste to energy market, based on several relevant parameters, such as [A] year of establishment, [B] company size, [C] location of headquarters and [D] ownership structure.
- Company Profiles: Elaborate profiles of prominent players engaged in the waste to energy market, providing details on [A] location of headquarters, [B] company size, [C] company mission, [D] company footprint, [E] management team, [F] contact details, [G] financial information, [H] operating business segments, [I] service / product portfolio, [J] moat analysis, [K] recent developments, and an informed future outlook.
- Megatrends: An evaluation of ongoing megatrends in the waste to energy industry.
- Patent Analysis: An insightful analysis of patents filed / granted in the waste to energy domain, based on relevant parameters, including [A] type of patent, [B] patent publication year, [C] patent age and [D] leading players.
- Porter's Five Forces Analysis: An analysis of five competitive forces prevailing in the waste to energy market, including threats of new entrants, bargaining power of buyers, bargaining power of suppliers, threats of substitute products and rivalry among existing competitors.
- Recent Developments: An overview of the recent developments made in the waste to energy market, along with analysis based on relevant parameters, including [A] year of initiative, [B] type of initiative, [C] geographical distribution and [D] most active players.
- SWOT Analysis: An insightful SWOT framework, highlighting the strengths, weaknesses, opportunities and threats in the domain. Additionally, it provides Harvey ball analysis, highlighting the relative impact of each SWOT parameter.
- Value Chain Analysis: A comprehensive analysis of the value chain, providing information on the different phases and stakeholders involved in the waste to energy market.
KEY QUESTIONS ANSWERED IN THIS REPORT
- How many companies are currently engaged in waste to energy market?
- Which are the leading companies in this market?
- What factors are likely to influence the evolution of this market?
- What is the current and future market size?
- What is the CAGR of this market?
- How is the current and future market opportunity likely to be distributed across key market segments?
REASONS TO BUY THIS REPORT
- The report provides a comprehensive market analysis, offering detailed revenue projections of the overall market and its specific sub-segments. This information is valuable to both established market leaders and emerging entrants.
- Stakeholders can leverage the report to gain a deeper understanding of the competitive dynamics within the market. By analyzing the competitive landscape, businesses can make informed decisions to optimize their market positioning and develop effective go-to-market strategies.
- The report offers stakeholders a comprehensive overview of the market, including key drivers, barriers, opportunities, and challenges. This information empowers stakeholders to stay abreast of market trends and make data-driven decisions to capitalize on growth prospects.
ADDITIONAL BENEFITS
- Complimentary Excel Data Packs for all Analytical Modules in the Report
- 15% Free Content Customization
- Detailed Report Walkthrough Session with Research Team
- Free Updated report if the report is 6-12 months old or older
TABLE OF CONTENTS
SECTION I: REPORT OVERVIEW
1. PREFACE
- 1.1. Introduction
- 1.2. Market Share Insights
- 1.3. Key Market Insights
- 1.4. Report Coverage
- 1.5. Key Questions Answered
- 1.6. Chapter Outlines
2. RESEARCH METHODOLOGY
- 2.1. Chapter Overview
- 2.2. Research Assumptions
- 2.3. Database Building
- 2.3.1. Data Collection
- 2.3.2. Data Validation
- 2.3.3. Data Analysis
- 2.4. Project Methodology
- 2.4.1. Secondary Research
- 2.4.1.1. Annual Reports
- 2.4.1.2. Academic Research Papers
- 2.4.1.3. Company Websites
- 2.4.1.4. Investor Presentations
- 2.4.1.5. Regulatory Filings
- 2.4.1.6. White Papers
- 2.4.1.7. Industry Publications
- 2.4.1.8. Conferences and Seminars
- 2.4.1.9. Government Portals
- 2.4.1.10. Media and Press Releases
- 2.4.1.11. Newsletters
- 2.4.1.12. Industry Databases
- 2.4.1.13. Roots Proprietary Databases
- 2.4.1.14. Paid Databases and Sources
- 2.4.1.15. Social Media Portals
- 2.4.1.16. Other Secondary Sources
- 2.4.2. Primary Research
- 2.4.2.1. Introduction
- 2.4.2.2. Types
- 2.4.2.2.1. Qualitative
- 2.4.2.2.2. Quantitative
- 2.4.2.3. Advantages
- 2.4.2.4. Techniques
- 2.4.2.4.1. Interviews
- 2.4.2.4.2. Surveys
- 2.4.2.4.3. Focus Groups
- 2.4.2.4.4. Observational Research
- 2.4.2.4.5. Social Media Interactions
- 2.4.2.5. Stakeholders
- 2.4.2.5.1. Company Executives (CXOs)
- 2.4.2.5.2. Board of Directors
- 2.4.2.5.3. Company Presidents and Vice Presidents
- 2.4.2.5.4. Key Opinion Leaders
- 2.4.2.5.5. Research and Development Heads
- 2.4.2.5.6. Technical Experts
- 2.4.2.5.7. Subject Matter Experts
- 2.4.2.5.8. Scientists
- 2.4.2.5.9. Doctors and Other Healthcare Providers
- 2.4.2.6. Ethics and Integrity
- 2.4.2.6.1. Research Ethics
- 2.4.2.6.2. Data Integrity
- 2.4.3. Analytical Tools and Databases
- 2.4.1. Secondary Research
3. MARKET DYNAMICS
- 3.1. Forecast Methodology
- 3.1.1. Top-Down Approach
- 3.1.2. Bottom-Up Approach
- 3.1.3. Hybrid Approach
- 3.2. Market Assessment Framework
- 3.2.1. Total Addressable Market (TAM)
- 3.2.2. Serviceable Addressable Market (SAM)
- 3.2.3. Serviceable Obtainable Market (SOM)
- 3.2.4. Currently Acquired Market (CAM)
- 3.3. Forecasting Tools and Techniques
- 3.3.1. Qualitative Forecasting
- 3.3.2. Correlation
- 3.3.3. Regression
- 3.3.4. Time Series Analysis
- 3.3.5. Extrapolation
- 3.3.6. Convergence
- 3.3.7. Forecast Error Analysis
- 3.3.8. Data Visualization
- 3.3.9. Scenario Planning
- 3.3.10. Sensitivity Analysis
- 3.4. Key Considerations
- 3.4.1. Demographics
- 3.4.2. Market Access
- 3.4.3. Reimbursement Scenarios
- 3.4.4. Industry Consolidation
- 3.5. Robust Quality Control
- 3.6. Key Market Segmentations
- 3.7. Limitations
4. MACRO-ECONOMIC INDICATORS
- 4.1. Chapter Overview
- 4.2. Market Dynamics
- 4.2.1. Time Period
- 4.2.1.1. Historical Trends
- 4.2.1.2. Current and Forecasted Estimates
- 4.2.2. Currency Coverage
- 4.2.2.1. Overview of Major Currencies Affecting the Market
- 4.2.2.2. Impact of Currency Fluctuations on the Industry
- 4.2.3. Foreign Exchange Impact
- 4.2.3.1. Evaluation of Foreign Exchange Rates and Their Impact on Market
- 4.2.3.2. Strategies for Mitigating Foreign Exchange Risk
- 4.2.4. Recession
- 4.2.4.1. Historical Analysis of Past Recessions and Lessons Learnt
- 4.2.4.2. Assessment of Current Economic Conditions and Potential Impact on the Market
- 4.2.5. Inflation
- 4.2.5.1. Measurement and Analysis of Inflationary Pressures in the Economy
- 4.2.5.2. Potential Impact of Inflation on the Market Evolution
- 4.2.6. Interest Rates
- 4.2.6.1. Overview of Interest Rates and Their Impact on the Market
- 4.2.6.2. Strategies for Managing Interest Rate Risk
- 4.2.7. Commodity Flow Analysis
- 4.2.7.1. Type of Commodity
- 4.2.7.2. Origins and Destinations
- 4.2.7.3. Values and Weights
- 4.2.7.4. Modes of Transportation
- 4.2.8. Global Trade Dynamics
- 4.2.8.1. Import Scenario
- 4.2.8.2. Export Scenario
- 4.2.9. War Impact Analysis
- 4.2.9.1. Russian-Ukraine War
- 4.2.9.2. Israel-Hamas War
- 4.2.10. COVID Impact / Related Factors
- 4.2.10.1. Global Economic Impact
- 4.2.10.2. Industry-specific Impact
- 4.2.10.3. Government Response and Stimulus Measures
- 4.2.10.4. Future Outlook and Adaptation Strategies
- 4.2.11. Other Indicators
- 4.2.11.1. Fiscal Policy
- 4.2.11.2. Consumer Spending
- 4.2.11.3. Gross Domestic Product (GDP)
- 4.2.11.4. Employment
- 4.2.11.5. Taxes
- 4.2.11.6. R&D Innovation
- 4.2.11.7. Stock Market Performance
- 4.2.11.8. Supply Chain
- 4.2.11.9. Cross-Border Dynamics
- 4.2.1. Time Period
SECTION II: QUALITATIVE INSIGHTS
5. EXECUTIVE SUMMARY
6. INTRODUCTION
- 6.1. Chapter Overview
- 6.2. Overview of Waste to energy market
- 6.2.1. Type of Technology
- 6.2.2. Type of Waste
- 6.2.3. Type of Form
- 6.2.4. Areas of Application
- 6.3. Future Perspective
7. REGULATORY SCENARIO
SECTION III: MARKET OVERVIEW
8. COMPREHENSIVE DATABASE OF LEADING PLAYERS
9. COMPETITIVE LANDSCAPE
- 9.1. Chapter Overview
- 9.2. Waste to Energy: Overall Market Landscape
- 9.2.1. Analysis by Year of Establishment
- 9.2.2. Analysis by Company Size
- 9.2.3. Analysis by Location of Headquarters
- 9.2.4. Analysis by Ownership Structure
10. WHITE SPACE ANALYSIS
11. COMPANY COMPETITIVENESS ANALYSIS
12. STARTUP ECOSYSTEM IN THE WASTE TO ENERGY MARKET
- 12.1. Waste to Energy Market: Market Landscape of Startups
- 12.1.1. Analysis by Year of Establishment
- 12.1.2. Analysis by Company Size
- 12.1.3. Analysis by Company Size and Year of Establishment
- 12.1.4. Analysis by Location of Headquarters
- 12.1.5. Analysis by Company Size and Location of Headquarters
- 12.1.6. Analysis by Ownership Structure
- 12.2. Key Findings
SECTION IV: COMPANY PROFILES
13. COMPANY PROFILES
- 13.1. Chapter Overview
- 13.2. A2A SpA*
- 13.2.1. Company Overview
- 13.2.2. Company Mission
- 13.2.3. Company Footprint
- 13.2.4. Management Team
- 13.2.5. Contact Details
- 13.2.6. Financial Performance
- 13.2.7. Operating Business Segments
- 13.2.8. Service / Product Portfolio (project specific)
- 13.2.9. MOAT Analysis
- 13.2.10. Recent Developments and Future Outlook
- 13.3. Abu Dhabi National Energy
- 13.4. Allseas
- 13.5. AVR
- 13.6. Babcock & Wilcox
- 13.7. Biffa
- 13.8. China Everbright Environment
- 13.9. Covanta
- 13.10. EDF
- 13.11. Foster Wheeler
- 13.12. Green Conversion Systems
- 13.13. Hitachi Zosen
- 13.14. Huawei
- 13.15. JANSEN Combustion and Boiler
- 13.16. Keppel Seghers
- 13.17. Martin
- 13.18. Mitsubishi Heavy
- 13.19. MVV Energie
SECTION V: MARKET TRENDS
14. MEGA TRENDS ANALYSIS
15. UNMET NEED ANALYSIS
16. PATENT ANALYSIS
17. RECENT DEVELOPMENTS
- 17.1. Chapter Overview
- 17.2. Recent Funding
- 17.3. Recent Partnerships
- 17.4. Other Recent Initiatives
SECTION VI: MARKET OPPORTUNITY ANALYSIS
18. GLOBAL WASTE TO ENERGY MARKET
- 18.1. Chapter Overview
- 18.2. Key Assumptions and Methodology
- 18.3. Trends Disruption Impacting Market
- 18.4. Demand Side Trends
- 18.5. Supply Side Trends
- 18.6. Global Waste to Energy Market, Historical Trends (Since 2019) and Forecasted Estimates (Till 2035)
- 18.7. Multivariate Scenario Analysis
- 18.7.1. Conservative Scenario
- 18.7.2. Optimistic Scenario
- 18.8. Investment Feasibility Index
- 18.9. Key Market Segmentations
19. MARKET OPPORTUNITIES BASED ON TYPE OF TECHNOLOGY
- 19.1. Chapter Overview
- 19.2. Key Assumptions and Methodology
- 19.3. Revenue Shift Analysis
- 19.4. Market Movement Analysis
- 19.5. Penetration-Growth (P-G) Matrix
- 19.6. Waste To Energy Market for Anaerobic Digestion: Historical Trends (Since 2019) and Forecasted Estimates (Till 2035)
- 19.7. Waste To Energy Market for Biochemical: Historical Trends (Since 2019) and Forecasted Estimates (Till 2035)
- 19.8. Waste To Energy Market for Incineration: Historical Trends (Since 2019) and Forecasted Estimates (Till 2035)
- 19.9. Waste To Energy Market for Physical: Historical Trends (Since 2019) and Forecasted Estimates (Till 2035)
- 19.10. Waste To Energy Market for Thermochemical: Historical Trends (Since 2019) and Forecasted Estimates (Till 2035)
- 19.11. Waste To Energy Market for Others: Historical Trends (Since 2019) and Forecasted Estimates (Till 2035)
- 19.12. Data Triangulation and Validation
- 19.12.1. Secondary Sources
- 19.12.2. Primary Sources
- 19.12.3. Statistical Modeling
20. MARKET OPPORTUNITIES BASED ON TYPE OF WASTE
- 20.1. Chapter Overview
- 20.2. Key Assumptions and Methodology
- 20.3. Revenue Shift Analysis
- 20.4. Market Movement Analysis
- 20.5. Penetration-Growth (P-G) Matrix
- 20.6. Waste To Energy Market for Agricultural Waste: Historical Trends (Since 2019) and Forecasted Estimates (Till 2035)
- 20.7. Waste To Energy Market for Municipal Solid Waste (MSW): Historical Trends (Since 2019) and Forecasted Estimates (Till 2035)
- 20.8. Waste To Energy Market for Others: Historical Trends (Since 2019) and Forecasted Estimates (Till 2035)
- 20.9. Data Triangulation and Validation
- 20.9.1. Secondary Sources
- 20.9.2. Primary Sources
- 20.9.3. Statistical Modeling
21. MARKET OPPORTUNITIES BASED ON TYPE OF FORM
- 21.1. Chapter Overview
- 21.2. Key Assumptions and Methodology
- 21.3. Revenue Shift Analysis
- 21.4. Market Movement Analysis
- 21.5. Penetration-Growth (P-G) Matrix
- 21.6. Waste To Energy Market for Electricity: Historical Trends (Since 2019) and Forecasted Estimates (Till 2035)
- 21.7. Waste To Energy Market for Hot Water: Historical Trends (Since 2019) and Forecasted Estimates (Till 2035)
- 21.8. Waste To Energy Market for Steam: Historical Trends (Since 2019) and Forecasted Estimates (Till 2035)
- 21.9. Data Triangulation and Validation
- 21.9.1. Secondary Sources
- 21.9.2. Primary Sources
- 21.9.3. Statistical Modeling
22. MARKET OPPORTUNITIES BASED ON AREAS OF APPLICATION
- 22.1. Chapter Overview
- 22.2. Key Assumptions and Methodology
- 22.3. Revenue Shift Analysis
- 22.4. Market Movement Analysis
- 22.5. Penetration-Growth (P-G) Matrix
- 22.6. Waste To Energy Market for Generation of Energy: Historical Trends (Since 2019) and Forecasted Estimates (Till 2035)
- 22.7. Waste To Energy Market for Treatment of Waste: Historical Trends (Since 2019) and Forecasted Estimates (Till 2035)
- 22.8. Waste To Energy Market for Reduction of Waste Volume: Historical Trends (Since 2019) and Forecasted Estimates (Till 2035)
- 22.9. Waste To Energy Market for Others: Historical Trends (Since 2019) and Forecasted Estimates (Till 2035)
- 22.10. Data Triangulation and Validation
- 22.10.1. Secondary Sources
- 22.10.2. Primary Sources
- 22.10.3. Statistical Modeling
23. MARKET OPPORTUNITIES FOR WASTE TO ENERGY IN NORTH AMERICA
- 23.1. Chapter Overview
- 23.2. Key Assumptions and Methodology
- 23.3. Revenue Shift Analysis
- 23.4. Market Movement Analysis
- 23.5. Penetration-Growth (P-G) Matrix
- 23.6. Waste To Energy Market in North America: Historical Trends (Since 2019) and Forecasted Estimates (Till 2035)
- 23.6.1. Waste To Energy Market in the US: Historical Trends (Since 2019) and Forecasted Estimates (Till 2035)
- 23.6.2. Waste To Energy Market in Canada: Historical Trends (Since 2019) and Forecasted Estimates (Till 2035)
- 23.6.3. Waste To Energy Market in Mexico: Historical Trends (Since 2019) and Forecasted Estimates (Till 2035)
- 23.6.4. Waste To Energy Market in Other North American Countries: Historical Trends (Since 2019) and Forecasted Estimates (Till 2035)
- 23.7. Data Triangulation and Validation
24. MARKET OPPORTUNITIES FOR WASTE TO ENERGY IN EUROPE
- 24.1. Chapter Overview
- 24.2. Key Assumptions and Methodology
- 24.3. Revenue Shift Analysis
- 24.4. Market Movement Analysis
- 24.5. Penetration-Growth (P-G) Matrix
- 24.6. Waste To Energy Market in Europe: Historical Trends (Since 2019) and Forecasted Estimates (Till 2035)
- 24.6.1. Waste To Energy Market in Austria: Historical Trends (Since 2019) and Forecasted Estimates (Till 2035)
- 24.6.2. Waste To Energy Market in Belgium: Historical Trends (Since 2019) and Forecasted Estimates (Till 2035)
- 24.6.3. Waste To Energy Market in Denmark: Historical Trends (Since 2019) and Forecasted Estimates (Till 2035)
- 24.6.4. Waste To Energy Market in France: Historical Trends (Since 2019) and Forecasted Estimates (Till 2035)
- 24.6.5. Waste To Energy Market in Germany: Historical Trends (Since 2019) and Forecasted Estimates (Till 2035)
- 24.6.6. Waste To Energy Market in Ireland: Historical Trends (Since 2019) and Forecasted Estimates (Till 2035)
- 24.6.7. Waste To Energy Market in Italy: Historical Trends (Since 2019) and Forecasted Estimates (Till 2035)
- 24.6.8. Waste To Energy Market in Netherlands: Historical Trends (Since 2019) and Forecasted Estimates (Till 2035)
- 24.6.9. Waste To Energy Market in Norway: Historical Trends (Since 2019) and Forecasted Estimates (Till 2035)
- 24.6.10. Waste To Energy Market in Russia: Historical Trends (Since 2019) and Forecasted Estimates (Till 2035)
- 24.6.11. Waste To Energy Market in Spain: Historical Trends (Since 2019) and Forecasted Estimates (Till 2035)
- 24.6.12. Waste To Energy Market in Sweden: Historical Trends (Since 2019) and Forecasted Estimates (Till 2035)
- 24.6.13. Waste To Energy Market in Sweden: Historical Trends (Since 2019) and Forecasted Estimates (Till 2035)
- 24.6.14. Waste To Energy Market in Switzerland: Historical Trends (Since 2019) and Forecasted Estimates (Till 2035)
- 24.6.15. Waste To Energy Market in the UK: Historical Trends (Since 2019) and Forecasted Estimates (Till 2035)
- 24.6.16. Waste To Energy Market in Other European Countries: Historical Trends (Since 2019) and Forecasted Estimates (Till 2035)
- 24.7. Data Triangulation and Validation
25. MARKET OPPORTUNITIES FOR WASTE TO ENERGY IN ASIA
- 25.1. Chapter Overview
- 25.2. Key Assumptions and Methodology
- 25.3. Revenue Shift Analysis
- 25.4. Market Movement Analysis
- 25.5. Penetration-Growth (P-G) Matrix
- 25.6. Waste To Energy Market in Asia: Historical Trends (Since 2019) and Forecasted Estimates (Till 2035)
- 25.6.1. Waste To Energy Market in China: Historical Trends (Since 2019) and Forecasted Estimates (Till 2035)
- 25.6.2. Waste To Energy Market in India: Historical Trends (Since 2019) and Forecasted Estimates (Till 2035)
- 25.6.3. Waste To Energy Market in Japan: Historical Trends (Since 2019) and Forecasted Estimates (Till 2035)
- 25.6.4. Waste To Energy Market in Singapore: Historical Trends (Since 2019) and Forecasted Estimates (Till 2035)
- 25.6.5. Waste To Energy Market in South Korea: Historical Trends (Since 2019) and Forecasted Estimates (Till 2035)
- 25.6.6. Waste To Energy Market in Other Asian Countries: Historical Trends (Since 2019) and Forecasted Estimates (Till 2035)
- 25.7. Data Triangulation and Validation
26. MARKET OPPORTUNITIES FOR WASTE TO ENERGY IN MIDDLE EAST AND NORTH AFRICA (MENA)
- 26.1. Chapter Overview
- 26.2. Key Assumptions and Methodology
- 26.3. Revenue Shift Analysis
- 26.4. Market Movement Analysis
- 26.5. Penetration-Growth (P-G) Matrix
- 26.6. Waste To Energy Market in Middle East and North Africa (MENA): Historical Trends (Since 2019) and Forecasted Estimates (Till 2035)
- 26.6.1. Waste To Energy Market in Egypt: Historical Trends (Since 2019) and Forecasted Estimates (Till 205)
- 26.6.2. Waste To Energy Market in Iran: Historical Trends (Since 2019) and Forecasted Estimates (Till 2035)
- 26.6.3. Waste To Energy Market in Iraq: Historical Trends (Since 2019) and Forecasted Estimates (Till 2035)
- 26.6.4. Waste To Energy Market in Israel: Historical Trends (Since 2019) and Forecasted Estimates (Till 2035)
- 26.6.5. Waste To Energy Market in Kuwait: Historical Trends (Since 2019) and Forecasted Estimates (Till 2035)
- 26.6.6. Waste To Energy Market in Saudi Arabia: Historical Trends (Since 2019) and Forecasted Estimates (Till 2035)
- 26.6.7. Waste To Energy Market in United Arab Emirates (UAE): Historical Trends (Since 2019) and Forecasted Estimates (Till 2035)
- 26.6.8. Waste To Energy Market in Other MENA Countries: Historical Trends (Since 2019) and Forecasted Estimates (Till 2035)
- 26.7. Data Triangulation and Validation
27. MARKET OPPORTUNITIES FOR WASTE TO ENERGY IN LATIN AMERICA
- 27.1. Chapter Overview
- 27.2. Key Assumptions and Methodology
- 27.3. Revenue Shift Analysis
- 27.4. Market Movement Analysis
- 27.5. Penetration-Growth (P-G) Matrix
- 27.6. Waste To Energy Market in Latin America: Historical Trends (Since 2019) and Forecasted Estimates (Till 2035)
- 27.6.1. Waste To Energy Market in Argentina: Historical Trends (Since 2019) and Forecasted Estimates (Till 2035)
- 27.6.2. Waste To Energy Market in Brazil: Historical Trends (Since 2019) and Forecasted Estimates (Till 2035)
- 27.6.3. Waste To Energy Market in Chile: Historical Trends (Since 2019) and Forecasted Estimates (Till 2035)
- 27.6.4. Waste To Energy Market in Colombia Historical Trends (Since 2019) and Forecasted Estimates (Till 2035)
- 27.6.5. Waste To Energy Market in Venezuela: Historical Trends (Since 2019) and Forecasted Estimates (Till 2035)
- 27.6.6. Waste To Energy Market in Other Latin American Countries: Historical Trends (Since 2019) and Forecasted Estimates (Till 2035)
- 27.7. Data Triangulation and Validation
28. MARKET OPPORTUNITIES FOR WASTE TO ENERGY IN REST OF THE WORLD
- 28.1. Chapter Overview
- 28.2. Key Assumptions and Methodology
- 28.3. Revenue Shift Analysis
- 28.4. Market Movement Analysis
- 28.5. Penetration-Growth (P-G) Matrix
- 28.6. Waste To Energy Market in Rest of the World: Historical Trends (Since 2019) and Forecasted Estimates (Till 2035)
- 28.6.1. Waste To Energy Market in Australia: Historical Trends (Since 2019) and Forecasted Estimates (Till 2035)
- 28.6.2. Waste To Energy Market in New Zealand: Historical Trends (Since 2019) and Forecasted Estimates (Till 2035)
- 28.6.3. Waste To Energy Market in Other Countries
- 28.7. Data Triangulation and Validation
29. MARKET CONCENTRATION ANALYSIS: DISTRIBUTION BY LEADING PLAYERS
- 29.1. Leading Player 1
- 29.2. Leading Player 2
- 29.3. Leading Player 3
- 29.4. Leading Player 4
- 29.5. Leading Player 5
- 29.6. Leading Player 6
- 29.7. Leading Player 7
- 29.8. Leading Player 8
30. ADJACENT MARKET ANALYSIS
SECTION VII: STRATEGIC TOOLS
31. KEY WINNING STRATEGIES
32. PORTER'S FIVE FORCES ANALYSIS
33. SWOT ANALYSIS
34. VALUE CHAIN ANALYSIS
35. ROOTS STRATEGIC RECOMMENDATIONS
- 35.1. Chapter Overview
- 35.2. Key Business-related Strategies
- 35.2.1. Research & Development
- 35.2.2. Product Manufacturing
- 35.2.3. Commercialization / Go-to-Market
- 35.2.4. Sales and Marketing
- 35.3. Key Operations-related Strategies
- 35.3.1. Risk Management
- 35.3.2. Workforce
- 35.3.3. Finance
- 35.3.4. Others
SECTION VIII: OTHER EXCLUSIVE INSIGHTS
36. INSIGHTS FROM PRIMARY RESEARCH
37. REPORT CONCLUSION
SECTION IX: APPENDIX
38. TABULATED DATA
39. LIST OF COMPANIES AND ORGANIZATIONS
40. CUSTOMIZATION OPPORTUNITIES
41. ROOTS SUBSCRIPTION SERVICES
42. AUTHOR DETAILS
- 発行日
- 発行
- Roots Analysis
- ページ情報
- 英文 196 Pages
- 納期
- 7~10営業日


