
|
市場調査レポート
商品コード
1762534
自動細胞処理システム市場業界動向と世界の予測 - 細胞治療処理ステップ別、事業規模別、エンドユーザー別、主要地域別Automated Cell Processing System Market: Industry Trends and Global Forecasts - Distribution by Cell Therapy Processing Step, Scale of Operation, End User and Key Geographical Regions |
||||||
カスタマイズ可能
|
|||||||
| 自動細胞処理システム市場業界動向と世界の予測 - 細胞治療処理ステップ別、事業規模別、エンドユーザー別、主要地域別 |
|
出版日: 2025年07月04日
発行: Roots Analysis
ページ情報: 英文 184 Pages
納期: 即日から翌営業日
|

全表示
- 概要
- 図表
- 目次
自動細胞処理システム市場:概要
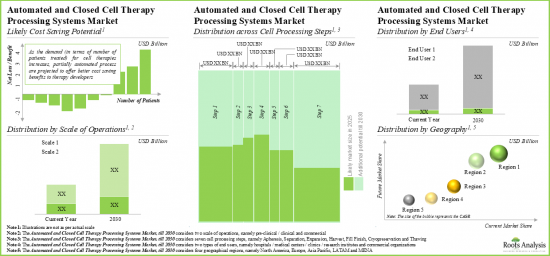
世界の自動細胞処理システムの市場規模は、今年2億2,000万米ドルとなりました。同市場は、予測期間中に16%のCAGRで拡大すると予測されています。
市場規模と機会分析は、以下のパラメータでセグメント化されています:
細胞治療処理ステップ
- アフェレシス
- 分離
- 拡大
- 収穫
- 充填/仕上げ
- 凍結保存
- 解凍
事業規模
- 前臨床/臨床業務
- 商業組織
エンドユーザー
- 病院/ 医療センター/ クリニック/ 研究機関/ 学術機関
- 細胞治療メーカー/ 開発者
主要地域
- 北米
- 欧州
- アジア太平洋
- ラテンアメリカ
- 中東・北アフリカ
自動細胞処理システム市場:成長と動向
近年、バイオテクノロジー業界における数々の画期的な開発により、細胞療法候補の数が増加しています。事実、現在2,000以上の細胞・遺伝子治療候補が、無数の疾患適応症の治療のために研究されています。さらに、FDAが承認した治療法の結果は、腫瘍性疾患、希少疾患、慢性疾患の治療における細胞治療の大きな可能性を示しました。そのため、この治療法はここ数年、ヘルスケア業界の関係者から大きな注目を集めています。しかし、従来の細胞治療の製造工程は労働集約的で時間がかかるため、製造コストが高くなっていました。さらに、この手作業による細胞治療の製造工程は、バッチ間のばらつきにつながります。その結果、より洗練された、時間効率の高い製造ソリューションが新たに必要とされています。
長年にわたり、先進的で革新的な自動化ツールや技術がいくつか開発されてきました。これらの自動化されたクローズドな細胞処理システムは、先進的な細胞治療の製造に関連するコストを大幅に削減する可能性があることが実証されています。そのような自動化システムの一つ、すなわちGMP-In-A Boxは、スループットの向上、バッチ運転間のアイドル時間の短縮、手作業の削減など、いくつかの利点を提供します。このような自動化の利点により、細胞処理システム市場は今後有利な成長を遂げると思われます。
自動細胞処理システム市場:主要インサイト
本レポートでは、自動細胞処理システム市場の現状を掘り下げ、業界内の潜在的な成長機会を特定しています。本レポートの主な調査結果は以下の通りです。
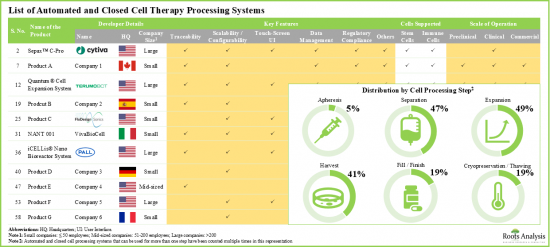
- 現在、細胞治療の開発、生産、凍結保存の様々な段階を自動化するために、60を超える革新的な自動化・閉鎖システムが各社別開発されています。
- 市場情勢は断片化されており、既存の参入企業と新規参入者の両方が、異なる操作規模にわたって細胞を処理するための明確な特徴を持つ新規技術の開発に従事しています。
- 2010年以降、自動化されたクローズド細胞処理システムの開発に注力する新興企業が数多く設立され、この新分野は大手・中小企業両方の関心を集めています。
- 利用可能なシステムの大半は、現行の規制要件に準拠しています。例としては、BATON、NANT 001、ロボット細胞培養システム、ボルタループなどがあります。
- この分野における利害関係者の関心の高まりは、最近の提携活動にも反映されています。最近の提携のほとんどは、新規技術に焦点を当てたもので、国際的な参入企業と国内企業の両方が積極的に参加しています。
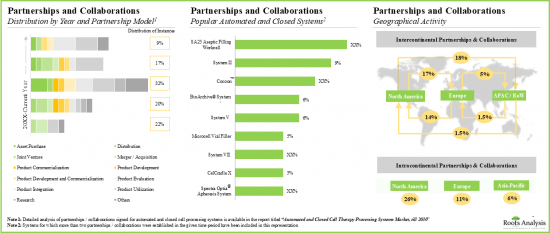
- この領域におけるパートナーシップの数はCAGR 24%で増加しており、これらのパートナーシップの70%以上が2018年以降に締結されています。
- SA25無菌充填作業セル(vanrx pharma systems)の活用または統合に焦点を当てたいくつかの取引が、細胞治療製品の充填/仕上げのために締結されました。
- 競争優位性を追求するため、装置開発者は現在、それぞれの製品や提携製品への高度な機能の統合に注力しています。
- 大手製薬会社を含む、細胞治療の開発に携わる300以上の利害関係者を評価した結果、この分野の装置プロバイダーにとって、戦略的パートナーシップの可能性がいくつかあることが明らかになっています。
- 様々な処理工程におけるコスト削減の可能性を考慮すると、自動化・閉鎖型細胞治療システム市場は今後10年間、年率16%で成長すると予想されます。
自動細胞処理システム市場の参入企業例
- AstraZeneca
- Baxter
- Bayer
- Cytiva(Acquired by Danaher Corporation)
- Cellular Therapeutics
- Lonza
- Merck
- Pall(Acquired by Danaher Corporation)
- Terumo BCT
- ThermoGenesis
目次
第1章 序文
第2章 エグゼクティブサマリー
第3章 イントロダクション
- 文脈と背景
- 細胞療法
- 細胞治療製造
- 細胞治療薬の製造に関連する主な課題
- 自動化および閉鎖型細胞処理システムの概要
- 主要な成長の原動力と障害
- 最近の動向と今後の動向
第4章 競合情勢
- 章の概要
- 自動化および閉鎖型細胞治療処理システム:市場情勢
- 自動化および閉鎖型細胞治療処理システム:開発者の情勢
第5章 製品競争力分析
- 章の概要
- 前提/主要パラメータ
- 調査手法
- 製品競争力分析
第6章 企業プロファイル
- 章の概要
- Cytiva
- Pall
- Terumo BCT
- ThermoGenesis
第7章 パートナーシップ
- 章の概要
- パートナーシップモデル
- 自動化および閉鎖型細胞治療処理システム:最近のパートナーシップ
第8章 自動化および閉鎖型細胞治療処理システム分野における大手製薬会社の取り組み
- 章の概要
- 大手製薬会社別取り組み
- AbbVieの取り組み
- Bristol Myers Squibbの取り組み
- Gilead Sciencesが取り組む取り組み
- GlaxoSmithKlineの取り組み
- Johnson & Johnsonの取り組み
- Novartisの取り組み
- Rocheの取り組み
- Sanofiの取り組み
- 武田薬品工業の取り組み
- 大手製薬会社の取り組みのサマリー
第9章 パートナー候補
- 章の概要
- 範囲と調査手法
- 自動化・閉鎖型細胞治療処理システム:細胞治療開発の潜在的な戦略的パートナー
- 自動化・閉鎖型細胞治療処理システム:細胞治療製造の潜在的な戦略的パートナー
第10章 ケーススタディ:部分自動化システムと完全自動化システムを使用した費用便益分析
第11章 市場規模の評価と機会分析
- 章の概要
- 主要な前提と調査手法
- 自動化および閉鎖型細胞治療処理システム市場全体(2035年まで)
第12章 結論
第13章 インタビュー/アンケート記録
第14章 付録1:表形式データ
第15章 付録2:企業・団体一覧
List of Tables
- Table 3.1. Cell and Advanced Therapies: Key Applications
- Table 3.2. Assessment of Key Cell Therapy Manufacturing Steps
- Table 4.1. List of Automated and Closed Cell Therapy Processing Systems: Information on Cell Processing Step
- Table 4.2. List of Automated and Closed Cell Therapy Processing Systems: Information on Types of Cells
- Table 4.3. List of Automated and Closed Cell Therapy Processing Systems: Information on Type of Culture
- Table 4.4. List of Automated and Closed Cell Therapy Processing Systems: Information on Scale of Operation
- Table 4.5. List of Automated and Closed Cell Therapy Processing Systems: Information on Key Features
- Table 4.6. List of Automated and Closed Cell Therapy Processing Systems: Information on Application Area
- Table 4.7. List of Automated and Closed Cell Therapy Processing Systems: Information on Regulatory Certifications / Accreditations Obtained
- Table 4.8. List of Automated and Closed Cell Therapy Processing Systems: Information on End Users
- Table 4.9. List of Automated and Closed Cell Therapy Processing System Providers
- Table 4.10. List of Automated and Closed Cell Therapy Processing System Providers: Information on Type of Support Service(s) Offered
- Table 6.1. Cytiva: Key Highlights
- Table 6.2. Cytiva: Product Portfolio
- Table 6.3. Pall: Key Highlights
- Table 6.4. Pall: Product Portfolio
- Table 6.5. Terumo BCT: Key Highlights
- Table 6.6. Terumo BCT: Product Portfolio
- Table 6.7. Terumo BCT: Recent Developments and Future Outlook
- Table 6.8. ThermoGenesis: Key Highlights
- Table 6.9. ThermoGenesis: Product Portfolio
- Table 6.10. ThermoGenesis: Recent Developments and Future Outlook
- Table 7.1. Automated and Closed Cell Processing Systems: List of Partnerships, Since 2016
- Table 8.1. Automated and Closed Cell Processing Systems: List of Big Pharma Players
- Table 9.1. Likely Partners for Automated and Closed Cell Therapy Processing System Providers: Dendritic Cell Therapy Developers
- Table 9.2. Likely Partners for Automated and Closed Cell Therapy Processing System Providers: Stem Cell Therapy Developers
- Table 9.3. Likely Partners for Automated and Closed Cell Therapy Processing System Providers: T-cell Therapy Developers
- Table 9.4. Likely Partners for Automated and Closed Cell Therapy Processing System Providers: Natural Killer Cell Therapy Developers
- Table 9.5. Likely Partners for Automated and Closed Cell Therapy Processing System Providers: Dendritic Cell Therapy Manufacturers
- Table 9.6. Likely Partners for Automated and Closed Cell Therapy Processing System Providers: Stem Cell Therapy Manufacturers
- Table 9.7. Likely Partners for Automated and Closed Cell Therapy Processing System Providers: T-cell Therapy Manufacturers
- Table 9.8. Likely Partners for Automated and Closed Cell Therapy Processing System Providers: Natural Killer Cell Therapy Manufacturers
- Table 10.1. Comparative Analysis of Manual, Partially Automated and Fully Automated Cell Processing Systems, Since 2020
- Table 10.2. Cost Saving Potential of Fully Automated Systems
- Table 14.1. Automated and Closed Cell Therapy Processing Systems: Distribution by Cell Processing Step
- Table 14.2. Automated and Closed Cell Therapy Processing Systems: Distribution by Types of Cells
- Table 14.3. Automated and Closed Cell Therapy Processing Systems: Distribution by Type of Culture
- Table 14.4. Automated and Closed Cell Therapy Processing Systems: Distribution by Scale of Operation
- Table 14.5. Automated and Closed Cell Therapy Processing Systems: Distribution by Key Features
- Table 14.6. Automated and Closed Cell Therapy Processing Systems: Distribution by Application Area
- Table 14.7. Automated and Closed Cell Therapy Processing Systems: Distribution by Regulatory Certifications / Accreditations
- Table 14.8. Automated and Closed Cell Therapy Processing Systems: Distribution by End Users
- Table 14.9. Automated and Closed Cell Therapy Processing System Providers: Distribution Year of Establishment
- Table 14.10. Automated and Closed Cell Therapy Processing System Providers: Distribution by Company Size
- Table 14.11. Automated and Closed Cell Therapy Processing System Providers: Distribution by Type of Support Services Offered
- Table 14.12. Automated and Closed Cell Therapy Processing System Providers: Distribution by Geographical Location
- Table 14.13. Automated and Closed Cell Therapy Processing System Providers: Distribution by Geographical Location (Country-Wise)
- Table 14.14. Leading Developers: Distribution by Number of Automated and Closed Cell Therapy Processing Systems
- Table 14.15. Terumo BCT: Annual Revenues, Since FY 2016
- Table 14.16. ThermoGenesis: Annual Revenues, Since FY 2016
- Table 14.17. Recent Partnerships: Cumulative Distribution by Year of Partnership
- Table 14.18. Recent Partnerships: Distribution by Type of Partnership Model Adopted
- Table 14.19. Recent Partnerships: Year-wise Trend by Type of Partnership Model Adopted
- Table 14.20. Recent Partnerships: Distribution by Type of Therapy
- Table 14.21. Recent Partnerships: Distribution by Type of Therapy and Type of Partnership Model Adopted
- Table 14.22. Recent Partnerships: Distribution by Cell Processing Step
- Table 14.23. Recent Partnerships: Distribution by Automated and Closed Cell Processing System
- Table 14.24. Recent Partnerships: Distribution by Type of Partner
- Table 14.25. Recent Partnerships: Distribution by Type of Cell Processing Step and Developer
- Table 14.26. Recent Partnerships: Most Active Players
- Table 14.27. Recent Partnerships: Country-Wise Distribution
- Table 14.28. Recent Partnerships: Intercontinental and Intracontinental Distribution
- Table 14.29. Big Pharma Initiatives Summary
- Table 14.30. Cost Saving Analysis: Comparative Analysis of Manual, Partially Automated and Fully Automated Processing Systems, Till 2035
- Table 14.31. Cost Saving Potential of Fully Automated Processing Systems Based on Number of Patients
- Table 14.32. Cost Saving Potential of Fully Automated Processing Systems Across Different Regions
- Table 14.33. Overall Automated and Closed Cell Therapy Processing Systems Market, Till 2035 (USD Million)
- Table 14.34. Automated and Closed Cell Therapy Processing Systems Market: Distribution by Cell Therapy Processing Step (USD Million)
- Table 14.35. Automated and Closed Cell Therapy Processing Systems Market: Share of Cell Apheresis Systems, Till 2035 (USD Million)
- Table 14.36. Automated and Closed Cell Therapy Processing Systems Market: Share of Cell Separation Systems, Till 2035 (USD Million)
- Table 14.37. Automated and Closed Cell Therapy Processing Systems Market: Share of Cell Expansion Systems, Till 2035 (USD Million)
- Table 14.38. Automated and Closed Cell Therapy Processing Systems Market: Share of Cell Harvesting Systems, Till 2035 (USD Million)
- Table 14.39. Automated and Closed Cell Therapy Processing Systems Market: Share of Fill Finish Systems, Till 2035 (USD Million)
- Table 14.40. Automated and Closed Cell Therapy Processing Systems Market: Share of Cryopreservation Systems, Till 2035 (USD Million)
- Table 14.41. Automated and Closed Cell Therapy Processing Systems Market: Share of Thawing Systems, Till 2035 (USD Million)
- Table 14.42. Automated and Closed Cell Therapy Processing Systems Market: Distribution by Scale of Operation (USD Million)
- Table 14.43. Automated and Closed Cell Therapy Processing Systems Market: Share of Preclinical / Clinical Scale Operations, Till 2035 (USD Million)
- Table 14.44. Automated and Closed Cell Therapy Processing Systems Market: Share of Commercial Operations, Till 2035 (USD Million)
- Table 14.45. Automated and Closed Cell Therapy Processing Systems Market: Distribution by End User (USD Million)
- Table 14.46. Automated and Closed Cell Therapy Processing Systems Market: Share of Hospitals / Medical Centers / Clinics / Research Institutes / Academic Institutes, Till 2035 (USD Million)
- Table 14.47. Automated and Closed Cell Therapy Processing Systems Market: Share of Commercial Organizations, Till 2035 (USD Million)
- Table 14.48. Automated and Closed Cell Therapy Processing Systems Market: Distribution by Key Geographical Regions (USD Million)
- Table 14.49. Automated and Closed Cell Therapy Processing Systems Market: Share of North America, Till 2035 (USD Million)
- Table 14.50. Automated and Closed Cell Therapy Processing Systems Market: Share of Europe, Till 2035 (USD Million)
- Table 14.51. Automated and Closed Cell Therapy Processing Systems Market: Share of Asia-Pacific, Till 2035 (USD Million)
- Table 14.52. Automated and Closed Cell Therapy Processing Systems Market: Share of LATAM, Till 2035 (USD Million)
- Table 14.53. Automated and Closed Cell Therapy Processing Systems Market: Share of MENA, Till 2035 (USD Million)
List of Figures
- Figure 3.1. Key Steps Involved in Manufacturing of Cell Therapies
- Figure 3.2. Key Considerations while Automating Cell Therapy Manufacturing Process
- Figure 3.3. Role of Automated and Closed Systems across Each Cell Therapy Processing Step
- Figure 3.4. Advantages offered by Automated and Closed Cell Processing Systems
- Figure 3.5. Challenges Associated with Automated and Closed Cell Processing Systems
- Figure 3.6. Growth Drivers and Roadblocks in the Automated and Closed Systems Market
- Figure 4.1. Automated and Closed Cell Therapy Processing Systems: Distribution by Cell Processing Step
- Figure 4.2. Automated and Closed Cell Therapy Processing Systems: Distribution by Types of Cells
- Figure 4.3. Automated and Closed Cell Therapy Processing Systems: Distribution by Type of Culture
- Figure 4.4. Automated and Closed Cell Therapy Processing Systems: Distribution by Scale of Operation
- Figure 4.5. Automated and Closed Cell Therapy Processing Systems: Distribution by Key Features
- Figure 4.6. Automated and Closed Cell Therapy Processing Systems: Distribution by Application Area
- Figure 4.7. Automated and Closed Cell Therapy Processing Systems: Distribution by Regulatory Certifications / Accreditations
- Figure 4.8. Automated and Closed Cell Therapy Processing Systems: Distribution by End Users
- Figure 4.9. Automated and Closed Cell Therapy Processing System Providers: Distribution by Year of Establishment
- Figure 4.10. Automated and Closed Cell Therapy Processing System Providers: Distribution by Company Size
- Figure 4.11. Automated and Closed Cell Therapy Processing System Providers: Distribution by Type of Support Services Offered
- Figure 4.12. Automated and Closed Cell Therapy Processing System Providers: Distribution by Geographical Location
- Figure 4.13. Automated and Closed Cell Therapy Processing System Providers: Distribution by Geographical Location (Country-Wise)
- Figure 4.14. Leading Developers: Distribution by Number of Automated and Closed Cell Therapy Processing Systems
- Figure 5.1. Product Competitiveness Analysis: Automated and Closed Systems for Cell Apheresis
- Figure 5.2. Product Competitiveness Analysis: Automated and Closed Systems for Cell Separation
- Figure 5.3. Product Competitiveness Analysis: Automated and Closed Systems for Cell Expansion
- Figure 5.4. Product Competitiveness Analysis: Automated and Closed Systems for Cell Harvesting
- Figure 5.5. Product Competitiveness Analysis: Automated and Closed Systems for Fill Finish
- Figure 5.6. Product Competitiveness Analysis: Automated and Closed Systems for Cryopreservation
- Figure 5.7. Product Competitiveness Analysis: Automated and Closed Systems for Thawing
- Figure 6.1. Terumo BCT: Annual Revenues, Since FY 2016
- Figure 6.2. ThermoGenesis: Annual Revenues, Since FY 2016
- Figure 7.1. Recent Partnerships: Cumulative Distribution by Year of Partnership
- Figure 7.2. Recent Partnerships: Distribution by Type of Partnership Model Adopted
- Figure 7.3. Recent Partnerships: Year-wise Trend by Type of Partnership Model Adopted
- Figure 7.4. Recent Partnerships: Distribution by Type of Therapy
- Figure 7.5. Recent Partnerships: Distribution by Type of Therapy and Type of Partnership Model Adopted
- Figure 7.6. Recent Partnerships: Distribution by Cell Processing Step
- Figure 7.7. Recent Partnerships: Distribution by Automated and Closed Cell Processing System
- Figure 7.8. Recent Partnerships: Distribution by Type of Partner
- Figure 7.9. Recent Partnerships: Distribution by Type of Cell Processing Step and Developer
- Figure 7.10. Recent Partnerships: Most Active Players
- Figure 7.11. Recent Partnerships: Country-Wise Distribution
- Figure 7.12. Recent Partnerships: Intercontinental and Intracontinental Distribution
- Figure 8.1. Big Pharma Initiatives Summary
- Figure 10.1. Cost Saving Analysis: Comparative Analysis of Manual, Partially Automated and Fully Automated Processing Systems, Till 2035
- Figure 10.2. Cost Saving Potential of Fully Automated Processing Systems Based on Number of Patients
- Figure 10.3. Cost Saving Potential of Fully Automated Processing Systems Across Different Regions
- Figure 11.1. Overall Automated and Closed Cell Therapy Processing Systems Market, Till 2035 (USD Million)
- Figure 11.2. Automated and Closed Cell Therapy Processing Systems Market: Distribution by Cell Therapy Processing Step (USD Million)
- Figure 11.3. Automated and Closed Cell Therapy Processing Systems Market: Share of Cell Apheresis Systems, Till 2035 (USD Million)
- Figure 11.4. Automated and Closed Cell Therapy Processing Systems Market: Share of Cell Separation Systems, Till 2035 (USD Million)
- Figure 11.5. Automated and Closed Cell Therapy Processing Systems Market: Share of Cell Expansion Systems, Till 2035 (USD Million)
- Figure 11.6. Automated and Closed Cell Therapy Processing Systems Market: Share of Cell Harvesting Systems, Till 2035 (USD Million)
- Figure 11.7. Automated and Closed Cell Therapy Processing Systems Market: Share of Fill Finish Systems, Till 2035 (USD Million)
- Figure 11.8. Automated and Closed Cell Therapy Processing Systems Market: Share of Cryopreservation Systems, Till 2035 (USD Million)
- Figure 11.9. Automated and Closed Cell Therapy Processing Systems Market: Share of Thawing Systems, Till 2035 (USD Million)
- Figure 11.10. Automated and Closed Cell Therapy Processing Systems Market: Distribution by Scale of Operation (USD Million)
- Figure 11.11. Automated and Closed Cell Therapy Processing Systems Market: Share of Preclinical / Clinical Scale Operations, Till 2035 (USD Million)
- Figure 11.12. Automated and Closed Cell Therapy Processing Systems Market: Share of Commercial Operations, Till 2035 (USD Million)
- Figure 11.13. Automated and Closed Cell Therapy Processing Systems Market: Distribution by End User (USD Million)
- Figure 11.14. Automated and Closed Cell Therapy Processing Systems Market: Share of Hospitals / Medical Centers / Clinics / Research Institutes / Academic Institutes, Till 2035 (USD Million)
- Figure 11.16. Automated and Closed Cell Therapy Processing Systems Market: Share of Commercial Organizations, Till 2035 (USD Million)
- Figure 11.17. Automated and Closed Cell Therapy Processing Systems Market: Distribution by Key Geographical Regions (USD Million)
- Figure 11.18. Automated and Closed Cell Therapy Processing Systems Market: Share of North America, Till 2035 (USD Million)
- Figure 11.19. Automated and Closed Cell Therapy Processing Systems Market: Share of Europe, Till 2035 (USD Million)
- Figure 11.20. Automated and Closed Cell Therapy Processing Systems Market: Share of Asia-Pacific, Till 2035 (USD Million)
- Figure 11.21. Automated and Closed Cell Therapy Processing Systems Market: Share of LATAM, Till 2035 (USD Million)
- Figure 11.22. Automated and Closed Cell Therapy Processing Systems Market: Share of MENA, Till 2035 (USD Million)
AUTOMATED CELL PROCESSING SYSTEM MARKET: OVERVIEW
As per Roots Analysis, the global automated cell processing system market valued at USD 220 million in the current year is projected to grow at a CAGR of 16% during the forecast period.
The market sizing and opportunity analysis has been segmented across the following parameters:
Cell Therapy Processing Step
- Apheresis
- Separation
- Expansion
- Harvest
- Fill / Finish
- Cryopreservation
- Thawing
Scale of Operation
- Pre-clinical / Clinical Operations
- Commercial Organizations
End User
- Hospitals / Medical Centers / Clinics / Research Institutes / Academic Institutes
- Cell Therapy Manufacturers / Developers
Key Geographical Regions
- North America
- Europe
- Asia-Pacific
- Latin America
- Middle East and North Africa
AUTOMATED CELL PROCESSING SYSTEM MARKET: GROWTH AND TRENDS
Recently there has been a rise in the number of cell therapies candidates, driven by numerous developmental breakthroughs in the biotechnology industry. In fact, more than 2,000 cell and gene therapy candidates are currently being investigated for the treatment of a myriad of disease indications. Further, the results of FDA approved therapies demonstrated the vast potential of cellular therapies in the treatment of oncological disorders, rare diseases, and chronic diseases. Thus, this therapeutic modality has garnered considerable attention from players engaged in the healthcare industry in the past few years. However, the conventional cell therapy manufacturing process is labor-intensive and time-consuming which results in high cost of production. Moreover, this manual process of cell therapy manufacturing leads to batch-to-batch variation. Consequently, there is an emerging and pressing need for more sophisticated and time efficient solutions for production.
Over the years, several advanced and innovative automation tools and technologies have been developed. These automated and closed cell processing systems have been demonstrated to hold the potential for significant reduction in the cost associated with the manufacturing of advanced cell therapies. One such automated system, namely GMP-In-A Box, offers several advantages, including increased throughput, decreased idle time between batch runs and reduced manual labor. Owing to such benefits of automation, the cell processing systems market is poised to witness lucrative growth in the coming future.
AUTOMATED CELL PROCESSING SYSTEM MARKET: KEY INSIGHTS
The report delves into the current state of the automated cell processing system market and identifies potential growth opportunities within industry. Some key findings from the report include:
- Presently, over 60 innovative, automated and closed systems have been developed by different companies in order to automate various stages of cell therapy development, production, and cryopreservation.
- The market landscape is fragmented, featuring both established players and new entrants, engaged in developing novel technologies with distinct features, for processing cells across different scales of operation.
- Since 2010, many startups, focused on developing automated and closed cell processing systems, have been established; this upcoming domain has captured the interest of both big and small players.
- Majority of the available systems are compliant with the current regulatory requirements; examples include BATON, NANT 001, robotic cell culture systems and the volta loop.
- The increasing interest of stakeholders in this field is also reflected in the recent partnership activity; most recent deals are focused on novel technologies and involve the active participation of both international and indigenous players.
- The number of partnerships in this domain have increased at a CAGR of 24%; more than 70% of these partnerships have been signed since 2018.
- Several deals focused on utilization or integration of SA25 aseptic filling work cell (vanrx pharma systems) were signed for fill / finish of cell therapy products.
- In pursuit of a competitive advantage, equipment developers are presently focusing on the integration of advanced features into their respective products and affiliated offerings.
- An evaluation of more than 300+ stakeholders engaged in the development of cell therapies, including big pharma players, reveals several likely strategic partnership opportunities for equipment providers in this field.
- Given their cost saving potential across different processing steps, we expect the automated and closed cell therapy systems market to grow at an annualized rate of 16% over the next decade.
Example Players in the Automated Cell Processing System Market
- AstraZeneca
- Baxter
- Bayer
- Cytiva (Acquired by Danaher Corporation)
- Cellular Therapeutics
- Lonza
- Merck
- Pall (Acquired by Danaher Corporation)
- Terumo BCT
- ThermoGenesis
AUTOMATED CELL PROCESSING SYSTEM MARKET: RESEARCH COVERAGE
- Market Sizing and Opportunity Analysis: The report features an in-depth analysis of the global automated cell processing system market, focusing on key market segments, including [A] cell therapy processing step, [B] scale of operation, [C] end user and [D] key geographical regions.
- Market Landscape: A comprehensive evaluation of the automated and closed systems, based on several relevant parameters, such as [A] cell therapy processing step, [B] their key features, [C] product specifications, [D] type of cells supported, [E] type of cell culture, [F] scale of operation, [G] application, [H] end users, [I] key support services offered and [J] regulatory certification / accreditations obtained.
- Product Competitiveness Analysis: A comprehensive competitive analysis of automated and closed systems, examining factors, such as [A] supplier power and [B] portfolio-related parameters.
- Company Profiles: In-depth profiles of key players that are engaged in offering automated and closed cell therapy processing systems, focusing on [A] overview of the company, [B] financial information (if available), [C] detailed description of the system(s) they offer and [D] recent developments and an informed future outlook.
- Partnerships and Collaborations: An insightful analysis of the deals inked by stakeholders in the automated cell processing system market, based on several parameters, such as [A] year of partnership, [B] type of partnership, [C] type of therapy, [D] type of cell processing step, [E] key automated and closed cell processing systems, [F] partner's focus area, [G] most active players (in terms of number of partnerships signed), and [H] geographical location of collaborators.
- Big Pharma Initiatives: A comprehensive evaluation of recent initiatives undertaken by big pharma players engaged in the automated cell processing system market.
KEY QUESTIONS ANSWERED IN THIS REPORT
- How many companies are currently engaged in this market?
- Which are the leading companies in this market?
- What factors are likely to influence the evolution of this market?
- What is the current and future market size?
- What is the CAGR of this market?
- How is the current and future market opportunity likely to be distributed across key market segments?
REASONS TO BUY THIS REPORT
- The report provides a comprehensive market analysis, offering detailed revenue projections of the overall market and its specific sub-segments. This information is valuable to both established market leaders and emerging entrants.
- Stakeholders can leverage the report to gain a deeper understanding of the competitive dynamics within the market. By analyzing the competitive landscape, businesses can make informed decisions to optimize their market positioning and develop effective go-to-market strategies.
- The report offers stakeholders a comprehensive overview of the market, including key drivers, barriers, opportunities, and challenges. This information empowers stakeholders to stay abreast of market trends and make data-driven decisions to capitalize on growth prospects.
ADDITIONAL BENEFITS
- Complimentary PPT Insights Packs
- Complimentary Excel Data Packs for all Analytical Modules in the Report
- 15% Free Content Customization
- Detailed Report Walkthrough Session with Research Team
- Free Updated report if the report is 6-12 months old or older
TABLE OF CONTENTS
1. PREFACE
- 1.1. Scope of the Report
- 1.2. Research Methodology
- 1.2.1. Research Assumptions
- 1.2.2. Project Methodology
- 1.2.3. Forecast Methodology
- 1.2.4. Robust Quality Control
- 1.2.5. Key Considerations
- 1.2.5.1. Demographics
- 1.2.5.2. Economic Factors
- 1.2.5.3. Government Regulations
- 1.2.5.4. Supply Chain
- 1.2.5.6. COVID Impact / Related Factors
- 1.2.5.7. Market Access
- 1.2.5.8. Healthcare Policies
- 1.2.5.9. Industry Consolidation
- 1.3 Key Questions Answered
- 1.4. Chapter Outlines
2. EXECUTIVE SUMMARY
3. INTRODUCTION
- 3.1. Context and Background
- 3.2. Cell Therapies
- 3.3. Cell Therapy Manufacturing
- 3.4. Key Challenges Associated with Manufacturing Cell Therapies
- 3.5. Overview of Automated and Closed Cell Processing Systems
- 3.5.1. Need for Automated and Closed Cell Processing in Cell Therapy Manufacturing
- 3.5.2. Advantages and Affiliated Challenges
- 3.6. Key Growth Drivers and Roadblocks
- 3.7. Recent Developments and Upcoming Trends
4. COMPETITIVE LANDSCAPE
- 4.1. Chapter Overview
- 4.2. Automated and Closed Cell Therapy Processing Systems: Overall Market Landscape
- 4.2.1. Analysis by Cell Processing Step
- 4.2.2. Analysis by Types of Cells
- 4.2.3. Analysis by Type of Culture
- 4.2.4. Analysis by Scale of Operation
- 4.2.5. Analysis by Key Features
- 4.2.6. Analysis by Application Area
- 4.2.7. Analysis by Regulatory Certifications / Accreditations
- 4.2.8. Analysis by End User
- 4.3. Automated and Closed Cell Therapy Processing Systems: Developer Landscape
- 4.3.1. Analysis by Year of Establishment
- 4.3.2. Analysis by Company Size
- 4.3.3. Analysis by Type of Support Service(s) Offered
- 4.3.4. Analysis by Location of Headquarters
5. PRODUCT COMPETITIVENESS ANALYSIS
- 5.1. Chapter Overview
- 5.2. Assumptions / Key Parameters
- 5.3. Methodology
- 5.4. Product Competitiveness Analysis
- 5.4.1. Automated and Closed Cell Processing Systems for Apheresis
- 5.4.2. Automated and Closed Cell Processing Systems for Separation
- 5.4.3. Automated and Closed Cell Processing Systems for Expansion
- 5.4.4. Automated and Closed Cell Processing Systems for Harvest
- 5.4.5. Automated and Closed Cell Processing Systems for Fill Finish
- 5.4.6. Automated and Closed Cell Processing Systems for Cryopreservation
- 5.4.7. Automated and Closed Cell Processing Systems for Thawing
6. COMPANY PROFILES
- 6.1. Chapter Overview
- 6.2. Cytiva
- 6.2.1. Company Overview
- 6.2.2. Product Portfolio
- 6.2.3. Recent Developments and Future Outlook
- 6.3. Pall
- 6.3.1. Company Overview
- 6.3.2. Product Portfolio
- 6.3.3. Recent Developments and Future Outlook
- 6.4. Terumo BCT
- 6.4.1. Company Overview
- 6.4.2. Product Portfolio
- 6.4.3. Financial Information
- 6.4.4. Recent Developments and Future Outlook
- 6.5 ThermoGenesis
- 6.5.1. Company Overview
- 6.5.2. Product Portfolio
- 6.5.3. Financial Information
- 6.5.4. Recent Developments and Future Outlook
7. PARTNERSHIPS
- 7.1. Chapter Overview
- 7.2. Partnership Models
- 7.3. Automated and Closed Cell Therapy Processing Systems: Recent Partnerships
- 7.3.1. Analysis by Year of Partnership
- 7.3.2. Analysis by Type of Partnership
- 7.3.3. Analysis by Type of Therapy
- 7.3.4. Analysis by Cell Processing Step
- 7.3.5. Analysis by Type of Automated and Closed Cell Processing Systems
- 7.3.6. Analysis by Partner's Focus Area
- 7.3.7. Most Active Players: Analysis by Number of Partnerships
- 7.3.8. Geographical Analysis
- 7.3.8.1. Country-Wise Distribution
- 7.3.8.2. Intercontinental and Intracontinental Agreements
8. BIG PHARMA INITIATIVES IN AUTOMATED AND CLOSED CELL THERAPY PROCESSING SYSTEMS DOMAIN
- 8.1. Chapter Overview
- 8.2. Initiatives Undertaken by Big Pharma Players
- 8.2.1. Initiatives Undertaken by AbbVie
- 8.2.2. Initiatives Undertaken by Bristol Myers Squibb
- 8.2.3. Initiatives Undertaken by Gilead Sciences
- 8.2.4. Initiatives Undertaken by GlaxoSmithKline
- 8.2.5. Initiatives Undertaken by Johnson & Johnson
- 8.2.6. Initiatives Undertaken by Novartis
- 8.2.7. Initiatives Undertaken by Roche
- 8.2.8. Initiatives Undertaken by Sanofi
- 8.2.9. Initiatives Undertaken by Takeda Pharmaceutical
- 8.2.10. Summary of Big Pharma Initiatives
9. LIKELY PARTNER
- 9.1. Chapter Overview
- 9.2. Scope and Methodology
- 9.3. Automated and Closed Cell Therapy Processing Systems: Potential Strategic Partners for Cell Therapy Development
- 9.3.1. Dendritic Cell Therapy
- 9.3.2. Stem Cell Therapy
- 9.3.3. T-cell Therapy
- 9.3.4. Natural Killer Cell Therapy
- 9.4. Automated and Closed Cell Therapy Processing Systems: Potential Strategic Partners for Cell Therapy Manufacturing
- 9.4.1. Dendritic Cell Therapy
- 9.4.2. Stem Cell Therapy,
- 9.4.3. T-cell Therapy
- 9.4.4. Natural Killer Cell Therapy
10. CASE STUDY: COST BENEFIT ANALYSIS USING PARTIALLY AUTOMATED AND FULLY AUTOMATED SYSTEMS
- 10.1. Chapter Overview
- 10.2. Comparative Analysis of Manual, Partially Automated and Fully Automated Cell Processing Systems
- 10.3. Likely Cost Saving Potential for Kymriah(R)
- 10.4. Likely Cost Saving Potential for Yescarata(R)
- 10.5. Cost Saving Potential of Fully Automated Processing Systems: Regional Trends
- 10.6. Concluding Remarks
11. MARKET SIZING AND OPPORTUNITY ANALYSIS
- 11.1. Chapter Overview
- 11.2. Key Assumptions and Methodology
- 11.3. Overall Automated and Closed Cell Therapy Processing Systems Market, Till 2035
- 11.3.1. Overall Automated and Closed Cell Therapy Processing Systems Market: Distribution by Cell Therapy Processing Step
- 11.3.1.1. Automated and Closed Cell Therapy Processing Systems Market for Apheresis, Till 2035
- 11.3.1.2. Automated and Closed Cell Therapy Processing Systems Market for Separation, Till 2035
- 11.3.1.3. Automated and Closed Cell Therapy Processing Systems Market for Expansion, Till 2035
- 11.3.1.4. Automated and Closed Cell Therapy Processing Systems Market for Harvest, Till 2035
- 11.3.1.5. Automated and Closed Cell Therapy Processing Systems Market for Fill / Finish, Till 2035
- 11.3.1.6. Automated and Closed Cell Therapy Processing Systems Market for Cryopreservation, Till 2035
- 11.3.1.7. Automated and Closed Cell Therapy Processing Systems Market for Thawing, Till 2035
- 11.3.2. Automated and Closed Cell Therapy Processing Systems Market: Distribution by Scale of Operation
- 11.3.2.1. Automated and Closed Cell Therapy Processing Systems Market for Pre-clinical / Clinical Operations, Till 2035
- 11.3.2.2. Automated and Closed Cell Therapy Processing Systems Market for Commercial Operations, Till 2035
- 11.3.3. Automated and Closed Cell Therapy Processing Systems Market: Distribution by End User
- 11.3.3.1. Automated and Closed Cell Therapy Processing Systems Market for Hospitals / Medical Centers / Clinics / Research Institutes / Academic Institutes, Till 2035
- 11.3.3.2. Automated and Closed Cell Therapy Processing Systems Market for Cell Therapy Manufacturers / Developers, Till 2035
- 11.3.4. Automated and Closed Cell Therapy Processing Systems Market: Distribution by Key Geographic Regions
- 11.3.4.1. Automated and Closed Cell Therapy Processing Systems Market in North America, Till 2035
- 11.3.4.2. Automated and Closed Cell Therapy Processing Systems Market in Europe, Till 2035
- 11.3.4.3. Automated and Closed Cell Therapy Processing Systems Market in Asia-Pacific, Till 2035
- 11.3.4.4. Automated and Closed Cell Therapy Processing Systems Market in Latin America (LATAM), Till 2035
- 11.3.4.5. Automated and Closed Cell Therapy Processing Systems Market in Middle East North America (MENA), Till 2035
- 11.3.1. Overall Automated and Closed Cell Therapy Processing Systems Market: Distribution by Cell Therapy Processing Step
12. CONCLUSION
- 12.1. Chapter Overview
- 12.2. Key Takeaways
