
|
市場調査レポート
商品コード
1682711
プラスミドDNA製造市場:事業規模別、プラスミドDNAのグレード別、応用分野別、治療分野別、エンドユーザー別、地域別:2035年までの業界動向と世界の予測Plasmid DNA Manufacturing Market by Scale of Operation, Application Area, Therapeutic Area, and Geography : Industry Trends and Global Forecasts, Till 2035 |
||||||
カスタマイズ可能
|
|||||||
| プラスミドDNA製造市場:事業規模別、プラスミドDNAのグレード別、応用分野別、治療分野別、エンドユーザー別、地域別:2035年までの業界動向と世界の予測 |
|
出版日: 2025年03月19日
発行: Roots Analysis
ページ情報: 英文 255 Pages
納期: 即日から翌営業日
|

全表示
- 概要
- 図表
- 目次
世界のプラスミドDNA製造の市場規模は、2035年までの予測期間中に14.85%のCAGRで拡大し、現在の1億米ドルから2035年までに5億3,000万米ドルに成長すると予測されています。
先端治療薬(ATMP)の研究開発イニシアチブの増加により、プラスミドDNA製造の分野は大きな成長を遂げています。プラスミドDNAの開発では、既存の課題を克服し、細胞・遺伝子治療開発、核酸ワクチン開発、ウイルスベクター製造など、さまざまな分野でプラスミドDNAの用途をさらに拡大することを目指しています。しかし、プラスミドDNAの製造工程には、機器や設備のメンテナンス、ハイエンドの専門知識の必要性など、高いコストがかかるという様々な課題があるため、製薬業界のいくつかの企業は、プラスミドDNAの製造業務を有能な専門サービス・プロバイダーにアウトソーシングしています。このようなアウトソーシングの動向により、プラスミドDNAの製造能力を提供するサービス・プロバイダーがいくつか出現しています。さらに、競合が激化する中、最先端のプロセス最適化ツールや技術を利用できることが差別化要因として浮上してきました。このため、多くのサービスプロバイダーは、戦略的買収を通じてサービスポートフォリオを積極的に拡大しています。時が経つにつれて、プラスミドDNAサービスプロバイダーのいくつかは、プラスミド設計やエンジニアリングからプロセス開発や最適化まで、エンドツーエンドのサービス能力を開発したと主張しています。前述の要因を考慮すると、プラスミドDNA製造市場は今後数年間で急成長を遂げると予想されます。
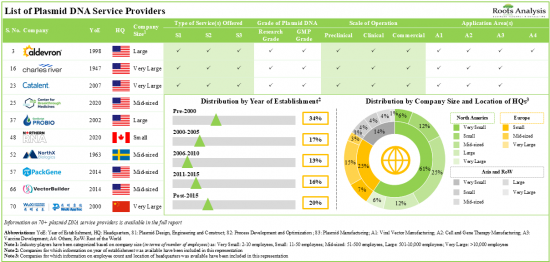
現在、70を超える企業が、様々な応用分野でプラスミドDNAに関する幅広いサービスを提供していると主張しています。
利害関係者の50%以上が、細胞・遺伝子治療開発者にGMPグレードのプラスミドDNA製造サービスを提供しています。最近の動向として、パートナーシップの動きがかなり活発化し、今年締結された取引の大半はプラスミドDNAの開発と製造に焦点を当てたものでした。この領域への関心の高まりは、過去数年間に報告された買収の数にも反映されています。このような取り組みの50%以上は、ポートフォリオの追加に焦点を当てたものでした。プラスミドDNA製造の世界の設備容量は様々な地域に広がっていますが、その45%以上は米国の製造工場に設置されています。細胞治療や遺伝子治療のパイプラインの拡大、核酸ドメインへの投資の増加により、プラスミドDNA製造市場は当面大きな成長を遂げる見通しです。
当レポートでは、世界のプラスミドDNA製造市場について調査し、市場の概要とともに、事業規模別、プラスミドDNAのグレード別、応用分野別、治療分野別、エンドユーザー別、地域別の動向、および市場に参入する企業のプロファイルなどを提供しています。
目次
第1章 序文
第2章 調査手法
第3章 経済およびその他のプロジェクト特有の考慮事項
第4章 エグゼクティブサマリー
第5章 イントロダクション
第6章 市場情勢
第7章 重要な洞察
第8章 パートナーシップとコラボレーション
第9章 買収
第10章 容量分析
第11章 企業競争力分析
第12章 企業プロファイル
第13章 需要分析
第14章 市場への影響分析:促進要因、抑制要因、機会、課題
第15章 世界のプラスミドDNA製造市場
第16章 プラスミドDNA製造市場、事業規模別
第17章 プラスミドDNA製造市場、プラスミドDNAのグレード別
第18章 プラスミドDNA製造市場、応用分野別
第19章 プラスミドDNA製造市場、治療分野別
第20章 プラスミドDNA製造市場、エンドユーザー別
第21章 プラスミドDNA製造市場、地域別
第22章 結論
第23章 エグゼクティブ洞察
第24章 付録I:表形式データ
第25章 付録II:企業および団体一覧
List of Tables
- Table 6.1 List of Plasmid DNA Service Providers
- Table 6.2 Plasmid DNA Service Providers: Information on Type of Service(s) Offered
- Table 6.3 Plasmid DNA Manufacturing Service Providers: Information on Location of Manufacturing Facility
- Table 6.4 Plasmid DNA Service Providers: Information on Key Offerings
- Table 6.5 Plasmid DNA Service Providers: Information on Grade of Plasmid DNA
- Table 6.6 Plasmid DNA Service Providers: Information on Scale of Operation
- Table 6.7 Plasmid DNA Service Providers: Information on Application Area(s)
- Table 8.1 Plasmid DNA Service Providers: List of Partnerships and Collaborations, since 2015
- Table 8.2 Partnerships and Collaborations: Information on Type of Agreement (Country- wise and Continent-wise), since 2015
- Table 9.1 Plasmid DNA Service Providers: List of Acquisitions, since 2015
- Table 9.2 Acquisitions: Key Value Drivers
- Table 9.3 Acquisitions: Deal Multiples
- Table 10.1 Plasmid DNA Manufacturers: Information on Production Capacity (Sample Dataset)
- Table 10.2 Installed Plasmid DNA Manufacturing Capacity: Average Capacity Per Facility based on Company Size (Sample Dataset)
- Table 10.3 Plasmid DNA Manufacturers: Global Plasmid DNA Production Capacity
- Table 11.1 Company Competitiveness Analysis: Benchmarking of Service Strength
- Table 11.2 Company Competitiveness Analysis: Benchmarking of Partnership Activity
- Table 12.1 List of Companies Profiled Table 12.2 AGC Biologics: Company Overview
- Table 12.3 AGC Biologics: Service Portfolio
- Table 12.4 AGC Biologics: Recent Developments and Future Outlook
- Table 12.5 Aldevron (Acquired by Danaher): Company Overview
- Table 12.6 Aldevron (Acquired by Danaher): Service Portfolio
- Table 12.7 Aldevron (Acquired by Danaher): Recent Development and Future Outlook
- Table 12.8 Catalent Pharma Solutions: Company Overview
- Table 12.9 Catalent Pharma Solutions: Service Portfolio
- Table 12.10 Catalent Pharma Solutions: Recent Developments and Future Outlook
- Table 12.11 Centre for Breakthrough Medicines (CBM): Company Overview
- Table 12.12 Centre for Breakthrough Medicines (CBM): Service Portfolio
- Table 12.13 Centre for Breakthrough Medicines (CBM): Recent Developments and Future Outlook
- Table 12.14 Charles River: Company Overview
- Table 12.15 Charles River: Service Portfolio
- Table 12.16 Charles River: Recent Developments and Future Outlook
- Table 12.17 GenScript ProBio (a subsidiary of GenScript): Company Overview
- Table 12.18 GenScript ProBio (a subsidiary of GenScript): Service Portfolio
- Table 12.19 GenScript ProBio (a subsidiary of GenScript): Recent Developments and Future Outlook
- Table 12.20 PackGene Biotech: Company Overview
- Table 12.21 PackGene Biotech: Service Portfolio
- Table 12.22 PackGene Biotech: Recent Developments and Future Outlook
- Table 12.23 VectorBuilder: Company Overview
- Table 12.24 VectorBuilder: Service Portfolio
- Table 12.25 VectorBuilder: Recent Development and Future Outlook
- Table 12.26 VGXI: Company Overview
- Table 12.27 VGXI: Service Portfolio
- Table 12.28 VGXI: Recent Developments and Future Outlook
- Table 12.29 WuXi ATU (a subsidiary of WuXi AppTec): Company Overview
- Table 12.30 WuXi ATU (a subsidiary of WuXi AppTec): Service Portfolio
- Table 12.31 WuXi ATU (a subsidiary of WuXi AppTec): Recent Developments and Future Outlook
- Table 12.32 53Biologics: Company Overview
- Table 12.33 53Biologics: Service Portfolio
- Table 12.34 ANEMOCYTE: Company Overview
- Table 12.35 ANEMOCYTE: Service Portfolio
- Table 12.36 Aurigene Pharmaceutical Services: Company Overview
- Table 12.37 Aurigene Pharmaceutical Services: Service Portfolio
- Table 12.38 BioCina: Company Overview
- Table 12.39 BioCina: Service Portfolio
- Table 12.40 Biovian: Company Overview
- Table 12.41 Biovian: Service Portfolio
- Table 12.42 Boehringer Ingelheim BioXcellence: Company Overview
- Table 12.43 Boehringer Ingelheim BioXcellence: Service Portfolio
- Table 12.44 Cytovance Biologics: Company Overview
- Table 12.45 Cytovance Biologics: Service Portfolio
- Table 12.46 Esco Aster (a subsidiary of Esco Lifesciences): Company Overview
- Table 12.47 Esco Aster (a Subsidiary of Esco Lifesciences): Service Portfolio
- Table 12.48 Eurogentec (a subsidiary of Kaneka): Company Overview
- Table 12.49 Eurogentec (a subsidiary of Kaneka): Service Portfolio
- Table 12.50 Forge Biologics: Company Overview
- Table 12.51 Forge Biologics: Service Portfolio
- Table 12.52 Hanmi Bio Plant (a Subsidiary of Hanmi Pharm): Company Overview
- Table 12.53 Hanmi Bio Plant (a Subsidiary of Hanmi Pharm): Service Portfolio
- Table 12.54 NorthX Biologics: Company Overview
- Table 12.55 NorthX Biologics: Service Portfolio
- Table 12.56 Patheon pharma services (acquired by Thermo Fisher Scientific): Company sOverview
- Table 12.57 Patheon pharma services (acquired by Thermo Fisher Scientific): Service Portfolio
- Table 12.58 Richter-Helm BioLogics: Company Overview
- Table 12.59 Richter-Helm BioLogics: Service Portfolio
- Table 12.60 Southern RNA: Company Overview
- Table 12.61 Southern RNA: Service Portfolio
- Table 12.62 Xpress Biologics (acquired by Polyplus): Company Overview
- Table 12.63 Xpress Biologics (acquired by Polyplus): Service Portfolio
- Table 23.1 JAFRAL Biosolutions: Company Overview
- Table 24.1 Plasmid DNA Service Providers: Distribution by Year of Establishment
- Table 24.2 Plasmid DNA Service Providers: Distribution by Company Size
- Table 24.3 Plasmid DNA Service Providers: Distribution by Location of Headquarters
- Table 24.4 Plasmid DNA Service Providers: Distribution by Type of Company
- Table 24.5 Plasmid DNA Service Providers: Distribution by Type of Venture
- Table 24.6 Plasmid DNA Service Providers: Distribution by Type of Service(s) Offered
- Table 24.7 Plasmid DNA Manufacturers: Distribution by Location of Manufacturing Facility
- Table 24.8 Plasmid DNA Service Providers: Distribution by Key Offerings
- Table 24.9 Plasmid DNA Service Providers: Distribution by Grade of Plasmid DNA
- Table 24.10 Plasmid DNA Service Providers: Distribution by Scale of Operation
- Table 24.11 Plasmid DNA Service Providers: Distribution by Application Area(s)
- Table 24.12 Key Insights: Distribution by Company Size and Location of Headquarters
- Table 24.13 Key Insights: Distribution by Year of Establishment and Type of Venture
- Table 24.14 Key Insights: Distribution by Key Offerings and Location of Headquarters
- Table 24.15 Key Insights: Distribution by Scale of Operation and Company Size
- Table 24.16 Key Insights: Distribution by Grade of Plasmid DNA and Application Area(s)
- Table 24.17 Partnerships and Collaborations: Cumulative Year-Wise Trend, since 2015
- Table 24.18 Partnerships and Collaborations: Distribution by Type of Partnership
- Table 24.19 Partnerships and Collaborations: Distribution by Year and Type of Partnership, since 2015
- Table 24.20 Partnerships and Collaborations: Distribution by Type of Partner
- Table 24.21 Partnerships and Collaborations: Distribution by Type of Partnership and Type of Partner
- Table 24.22 Partnerships and Collaborations: Distribution by Grade of Plasmid DNA
- Table 24.23 Partnerships and Collaborations: Distribution by Scale of Operation
- Table 24.24 Partnerships and Collaborations: Local and International Agreements
- Table 24.25 Partnerships and Collaborations: Intercontinental and Intracontinental Agreements
- Table 24.26 Most Active Players: Distribution by Number of Partnerships
- Table 24.27 Acquisitions: Cumulative Year-Wise Trend, since 2015
- Table 24.28 Acquisitions: Distribution by Type of Acquisition
- Table 24.29 Acquisitions: Local and International Deals
- Table 24.30 Acquisitions: Intercontinental and Intracontinental Deals
- Table 24.31 Acquisitions: Ownership Change Matrix
- Table 24.32 Acquisitions: Distribution by Company Size
- Table 24.33 Acquisitions: Distribution by Key Value Drivers
- Table 24.34 Most Active Players: Distribution by Number of Acquisitions
- Table 24.35 Global Installed Plasmid DNA Manufacturing Capacity (in Liters): Distribution by Company Size
- Table 24.36 Global Installed Plasmid DNA Manufacturing Capacity (in Liters): Distribution by Grade of Plasmid DNA
- Table 24.37 Global Installed Plasmid DNA Manufacturing Capacity (in Liters): Distribution by Scale of Operation
- Table 24.38 Global Installed Plasmid DNA Manufacturing Capacity (in Liters): Distribution by Location of Manufacturing Facility
- Table 24.39 Company Competitiveness Analysis: Benchmarking of Service Strength
- Table 24.40 Company Competitiveness Analysis: Benchmarking of Partnership Activity
- Table 24.41 AGC Biologics: Annual Revenues, FY 2018 Onwards (DKK Million)
- Table 24.42 Danaher: Annual Revenues, FY 2018 Onwards (USD Billion)
- Table 24.43 Catalent Pharma Solutions: Annual Revenues, FY 2018 Onwards (USD Billion)
- Table 24.44 Charles River: Annual Revenues, FY 2018 Onwards (USD Billion)
- Table 24.45 WuXi ATU (a Subsidiary of WuXi AppTec): Annual Revenues, FY 2018 Onwards (RMB Billion)
- Table 24.46 Global Demand for Plasmid DNA, Historical Trends (since 2018) (In Kgs)
- Table 24.47 Global Demand for Plasmid DNA, Forecasted Estimates (till 2035) (In Kgs)
- Table 24.48 Demand for Plasmid DNA: Distribution by Scale of Operation, Historical Trends (since 2018) (In Kgs)
- Table 24.49 Demand for Plasmid DNA: Distribution by Scale of Operation, Forecasted Estimates (till 2035) (In Kgs)
- Table 24.50 Demand for Plasmid DNA: Distribution by Application Area, Historical Trends (since 2018) (In Kgs)
- Table 24.51 Demand for Plasmid DNA: Distribution by Application Area, Forecasted Estimates (till 2035) (In Kgs)
- Table 24.52 Demand for Plasmid DNA: Distribution by Geography, Historical Trends (since 2018) (In Kgs)
- Table 24.53 Demand for Plasmid DNA: Distribution by Geography, Forecasted Estimates (till 2035) (In Kgs)
- Table 24.54 Global Plasmid DNA Manufacturing Market, Historical Trends (since 2018) (USD Million)
- Table 24.55 Global Plasmid DNA Manufacturing Market, Forecasted Estimates (till 2035), Conservative, Base and Optimistic Scenarios (USD Million)
- Table 24.56 Plasmid DNA Manufacturing Market for Commercial Products, Historical Trends (since 2018) (USD Million)
- Table 24.57 Plasmid DNA Manufacturing Market for Commercial Products, Forecasted Estimates (till 2035), Conservative, Base and Optimistic Scenarios (USD Million)
- Table 24.58 Plasmid DNA Manufacturing Market for Clinical Products, Historical Trends (since 2018) (USD Million)
- Table 24.59 Plasmid DNA Manufacturing Market for Clinical Products, Forecasted Estimates (till 2035), Conservative, Base and Optimistic Scenarios (USD Million)
- Table 24.60 Plasmid DNA Manufacturing Market for Preclinical Products, Historical Trends (since 2018) (USD Million)
- Table 24.61 Plasmid DNA Manufacturing Market for Preclinical Products, Forecasted Estimates (till 2035), Conservative, Base and Optimistic Scenarios (USD Million)
- Table 24.62 Plasmid DNA Manufacturing Market for GMP Grade Plasmid DNA, Historical Trends (since 2018) (USD Million)
- Table 24.63 Plasmid DNA Manufacturing Market for GMP Grade Plasmid DNA, Forecasted Estimates (till 2035), Conservative, Base and Optimistic Scenarios (USD Million)
- Table 24.64 Plasmid DNA Manufacturing Market for High Quality Plasmid DNA, Historical Trends (since 2018) (USD Million)
- Table 24.65 Plasmid DNA Manufacturing Market for High Quality Plasmid DNA, Forecasted Estimates (till 2035), Conservative, Base and Optimistic Scenarios (USD Million)
- Table 24.66 Plasmid DNA Manufacturing Market for Research Grade Plasmid DNA, Historical Trends (since 2018) (USD Million)
- Table 24.67 Plasmid DNA Manufacturing Market for Research Grade Plasmid DNA, Forecasted Estimates (till 2035), Conservative, Base and Optimistic Scenarios (USD Million)
- Table 24.68 Plasmid DNA Manufacturing Market for DNA Vaccine Development, Historical Trends (since 2018) (USD Million)
- Table 24.69 Plasmid DNA Manufacturing Market for DNA Vaccine Development, Forecasted Estimates (till 2035), Conservative, Base and Optimistic Scenarios (USD Million)
- Table 24.70 Plasmid DNA Manufacturing Market for mRNA Vaccine Development, Historical Trends (since 2018) (USD Million)
- Table 24.71 Plasmid DNA Manufacturing Market for mRNA Vaccine Development, Forecasted Estimates (till 2035), Conservative, Base and Optimistic Scenarios (USD Million)
- Table 24.72 Plasmid DNA Manufacturing Market for Cell Therapy Manufacturing, Historical Trends (since 2018) (USD Million)
- Table 24.73 Plasmid DNA Manufacturing Market for Cell Therapy Manufacturing, Forecasted Estimates (till 2035), Conservative, Base and Optimistic Scenarios (USD Million)
- Table 24.74 Plasmid DNA Manufacturing Market for Gene Therapy Manufacturing, Historical Trends (since 2018) (USD Million)
- Table 24.75 Plasmid DNA Manufacturing Market for Gene Therapy Manufacturing, Forecasted Estimates (till 2035), Conservative, Base and Optimistic Scenarios (USD Million)
- Table 24.76 Plasmid DNA Manufacturing Market for Viral Vector Manufacturing, Historical Trends (since 2018) (USD Million)
- Table 24.77 Plasmid DNA Manufacturing Market for Viral Vector Manufacturing, Forecasted Estimates (till 2035), Conservative, Base and Optimistic Scenarios (USD Million)
- Table 24.78 Plasmid DNA Manufacturing Market for Oncological Disorders, Historical Trends (since 2018) (USD Million)
- Table 24.79 Plasmid DNA Manufacturing Market for Oncological Disorders, Forecasted Estimates (till 2035), Conservative, Base and Optimistic Scenarios (USD Million)
- Table 24.80 Plasmid DNA Manufacturing Market for Infectious Diseases, Historical Trends (since 2018) (USD Million)
- Table 24.81 Plasmid DNA Manufacturing Market for Infectious Diseases, Forecasted Estimates (till 2035), Conservative, Base and Optimistic Scenarios (USD Million)
- Table 24.82 Plasmid DNA Manufacturing Market for Genetic Disorders, Historical Trends (since 2018) (USD Million)
- Table 24.83 Plasmid DNA Manufacturing Market for Genetic Disorders, Forecasted Estimates (till 2035), Conservative, Base and Optimistic Scenarios (USD Million)
- Table 24.84 Plasmid DNA Manufacturing Market for Other Disorders, Historical Trends (since 2018) (USD Million)
- Table 24.85 Plasmid DNA Manufacturing Market for Other Disorders, Forecasted Estimates (till 2035), Conservative, Base and Optimistic Scenarios (USD Million)
- Table 24.86 Plasmid DNA Manufacturing Market for Pharma and Biotech Companies, Historical Trends (since 2018) (USD Million)
- Table 24.87 Plasmid DNA Manufacturing Market for Pharma and Biotech Companies, Forecasted Estimates (till 2035), Conservative, Base and Optimistic Scenarios (USD Million)
- Table 24.88 Plasmid DNA Manufacturing Market for Academic and Research Institutes, Historical Trends (since 2018) (USD Million)
- Table 24.89 Plasmid DNA Manufacturing Market for Academic and Research Institutes, Forecasted Estimates (till 2035), Conservative, Base and Optimistic Scenarios (USD Million)
- Table 24.90 Plasmid DNA Manufacturing Market for Other End Users, Historical Trends (since 2018) (USD Million)
- Table 24.91 Plasmid DNA Manufacturing Market for Other End Users, Forecasted Estimates (till 2035), Conservative, Base and Optimistic Scenarios (USD Million)
- Table 24.92 Plasmid DNA Manufacturing Market in North America, Historical Trend (since 2018) (USD Million)
- Table 24.93 Plasmid DNA Manufacturing Market in North America, Forecasted Estimates (till 2035), Conservative, Base and Optimistic Scenarios (USD Million)
- Table 24.94 Plasmid DNA Manufacturing Market in Europe, Historical Trend (since 2018) (USD Million)
- Table 24.95 Plasmid DNA Manufacturing Market in Europe, Forecasted Estimates (till 2035), Conservative, Base and Optimistic Scenarios (USD Million)
- Table 24.96 Plasmid DNA Manufacturing Market in Asia, Historical Trend (since 2018) (USD Million)
- Table 24.97 Plasmid DNA Manufacturing Market in Asia, Forecasted Estimates (till 2035), Conservative, Base and Optimistic Scenarios (USD Million)
- Table 24.98 Plasmid DNA Manufacturing Market in Latin America, Historical Trend (since 2018) (USD Million)
- Table 24.99 Plasmid DNA Manufacturing Market in Latin America, Forecasted Estimates (till 2035), Conservative, Base and Optimistic Scenarios (USD Million)
- Table 24.100 Plasmid DNA Manufacturing Market in Middle East and North Africa, Historical Trend (since 2018) (USD Million)
- Table 24.101 Plasmid DNA Manufacturing Market in Middle East and North Africa, Forecasted Estimates (till 2035), Conservative, Base and Optimistic Scenarios (USD Million)
- Table 24.102 Plasmid DNA Manufacturing Market in Rest of the World, Historical Trend (since 2018) (USD Million)
- Table 24.103 Plasmid DNA Manufacturing Market in Rest of the World, Forecasted Estimates (till 2035), Conservative, Base and Optimistic Scenarios (USD Million)
List of Figures
- Figure 4.1 Executive Summary: Overall Market Landscape
- Figure 4.2 Executive Summary: Partnerships and Collaborations
- Figure 4.3 Executive Summary: Acquisitions
- Figure 4.4 Executive Summary: Capacity Analysis
- Figure 4.5 Executive Summary: Demand Analysis
- Figure 4.6 Executive Summary: Market Forecast and Opportunity Analysis
- Figure 5.1 Structure of Plasmid DNA
- Figure 5.2 Steps Involved in Plasmid DNA Manufacturing
- Figure 5.3 Challenges Associated with Plasmid DNA Manufacturing
- Figure 6.1 Plasmid DNA Service Providers: Distribution by Year of Establishment
- Figure 6.2 Plasmid DNA Service Providers: Distribution by Company Size
- Figure 6.3 Plasmid DNA Service Providers: Distribution by Location of Headquarters (Region-wise)
- Figure 6.4 Plasmid DNA Service Providers: Distribution by Location of Headquarters (Country-wise)
- Figure 6.5 Plasmid DNA Service Providers: Distribution by Type of Company
- Figure 6.6 Plasmid DNA Service Providers: Distribution by Type of Venture
- Figure 6.7 Plasmid DNA Service Providers: Distribution by Type of Service(s) Offered
- Figure 6.8 Plasmid DNA Manufacturers: Distribution by Location of Manufacturing Facility
- Figure 6.9 Plasmid DNA Service Providers: Distribution by Key Offerings
- Figure 6.10 Plasmid DNA Service Providers: Distribution by Grade of Plasmid DNA
- Figure 6.11 Plasmid DNA Service Providers: Distribution by Scale of Operation
- Figure 6.12 Plasmid DNA Service Providers: Distribution by Application Area(s)
- Figure 7.1 Key Insights: Distribution by Company Size and Location of Headquarters
- Figure 7.2 Key Insights: Distribution by Year of Establishment and Type of Venture
- Figure 7.3 Key Insights: Distribution by Key Offerings and Location of Headquarters
- Figure 7.4 Key Insights: Distribution by Scale of Operation and Company Size
- Figure 7.5 Key Insights: Distribution by Grade of Plasmid DNA and Application Area(s)
- Figure 7.6 Key Insights: Distribution by Scale of Operation, Application Area(s) and Location of Manufacturing Facility
- Figure 8.1 Partnerships and Collaborations: Cumulative Year-Wise Trend, since 2015
- Figure 8.2 Partnerships and Collaborations: Distribution by Type of Partnership
- Figure 8.3 Partnerships and Collaborations: Distribution by Year and Type of Partnership
- Figure 8.4 Partnerships and Collaborations: Distribution by Type of Partner
- Figure 8.5 Partnerships and Collaborations: Distribution by Type of Partnership and Type of Partner
- Figure 8.6 Partnerships and Collaborations: Distribution by Grade of Plasmid DNA
- Figure 8.7 Partnerships and Collaborations: Distribution by Scale of Operation
- Figure 8.8 Partnerships and Collaborations: Local and International Agreements
- Figure 8.9 Partnerships and Collaborations: Intercontinental and Intracontinental Agreements
- Figure 8.10 Most Active Players: Distribution by Number of Partnerships
- Figure 9.1 Acquisitions: Cumulative Year-Wise Trend, since 2015
- Figure 9.2 Acquisitions: Distribution by Type of Acquisition
- Figure 9.3 Acquisitions: Local and International Deals
- Figure 9.4 Acquisitions: Intercontinental and Intracontinental Deals
- Figure 9.5 Acquisitions: Analysis by Company Size
- Figure 9.6 Acquisitions: Ownership Change Matrix
- Figure 9.7 Acquisitions: Analysis by Key Value Drivers
- Figure 9.8 Most Active Players: Analysis by Number of Acquisitions
- Figure 10.1 Global Installed Plasmid DNA Manufacturing Capacity (in Liters): Distribution by Company Size
- Figure 10.2 Global Installed Plasmid DNA Manufacturing Capacity (in Liters): Distribution by Grade of Plasmid DNA
- Figure 10.3 Global Installed Plasmid DNA Manufacturing Capacity (in Liters): Distribution by Scale of Operation
- Figure 10.4 Global Installed Plasmid DNA Manufacturing Capacity (in Liters): Distribution by Location of Manufacturing Facility
- Figure 10.5 Installed Plasmid DNA Manufacturing Capacity in North America (in Liters)
- Figure 10.6 Installed Plasmid DNA Manufacturing Capacity in Europe (in Liters)
- Figure 10.7 Installed Plasmid DNA Manufacturing Capacity in Asia and Rest of the World (in Liters)
- Figure 11.1 Company Competitiveness Analysis: Benchmarking of Service Strength
- Figure 11.2 Company Competitiveness Analysis: Benchmarking of Partnership Activity
- Figure 11.3 Company Competitiveness Analysis: Very Small and Small Companies Offering Plasmid DNA Manufacturing
- Figure 11.4 Company Competitiveness Analysis: Mid-sized Companies Offering Plasmid DNA Manufacturing
- Figure 11.5 Company Competitiveness Analysis: Large and Very Large Companies Offering Plasmid DNA Manufacturing
- Figure 12.1 AGC Biologics: Annual Revenues, FY 2018 Onwards (DKK Million)
- Figure 12.2 Danaher: Annual Revenues, FY 2017 Onwards (USD Billion)
- Figure 12.3 Catalent Pharma Solutions: Annual Revenues, FY 2018 Onwards (USD Billion)
- Figure 12.4 Charles River: Annual Revenues, FY 2018 Onwards (USD Billion)
- Figure 12.5 GenScript: Annual Revenues, FY 2018 Onwards (USD Million)
- Figure 12.6 Wuxi AppTec: Annual Revenues, FY 2018 Onwards (RMB Billion)
- Figure 13.1 Global Demand for Plasmid DNA, Historical Trends (since 2018) and Forecasted Estimates (till 2035) (In Kgs)
- Figure 13.2 Demand for Plasmid DNA: Distribution by Scale of Operation, 2023 and 2035
- Figure 13.3 Commercial Demand for Plasmid DNA, Historical Trends (since 2018) and Forecasted Estimates (till 2035) (In Kgs)
- Figure 13.4 Clinical Demand for Plasmid DNA, Historical Trends (since 2018) and Forecasted Estimates (till 2035) (In Kgs)
- Figure 13.5 Demand for Plasmid DNA: Distribution by Application Area, 2023 and 2035
- Figure 13.6 Plasmid DNA Demand for mRNA Therapy Development, Historical Trends (since 2020) and Forecasted Estimates (till 2035) (In Kgs)
- Figure 13.7 Plasmid DNA Demand for Gene Therapy Manufacturing, Historical Trends (since 2018) and Forecasted Estimates (till 2035) (In Kgs)
- Figure 13.8 Plasmid DNA Demand for DNA Vaccine Development, Historical Trends (since 2018) and Forecasted Estimates (till 2035) (In Kgs)
- Figure 13.9 Plasmid DNA Demand for Viral Vector Manufacturing, Historical Trends (since 2018) and Forecasted Estimates (till 2035) (In Kgs)
- Figure 13.10 Plasmid DNA Demand for Cell Therapy Manufacturing, Historical Trends (since 2018) and Forecasted Estimates (till 2035)
- Figure 13.11 Demand for Plasmid DNA: Distribution by Geography, 2018, 2023 and 2035
- Figure 13.12 Demand for Plasmid DNA in North America, Historical Trends (since 2018) and Forecasted Estimates (till 2035) (In Kgs)
- Figure 13.13 Demand for Plasmid DNA in Europe, Historical Trends (since 2018) and Forecasted Estimates (till 2035) (In Kgs)
- Figure 13.14 Demand for Plasmid DNA in Asia, Historical Trends (since 2018) and Forecasted Estimates (till 2035) (In Kgs)
- Figure 13.15 Demand for Plasmid DNA in Latin America, Historical Trends (since 2018) and Forecasted Estimates (till 2035) (In Kgs)
- Figure 13.16 Demand for Plasmid DNA in Middle East and North Africa, Historical Trends (since 2018) and Forecasted Estimates (till 2035) (In Kgs)
- Figure 13.17 Demand for Plasmid DNA in Rest of the World, Historical Trends (since 2018) and Forecasted Estimates (till 2035) (In Kgs)
- Figure 14.1 Market Drivers
- Figure 14.2 Market Restraints
- Figure 14.3 Market Opportunities
- Figure 14.4 Market Challenges
- Figure 15.1 Global Plasmid DNA Manufacturing Market, Historical Trends (since 2018) and Forecasted Estimates (till 2035) (USD Million)
- Figure 15.2 Global Plasmid DNA Manufacturing Market, Forecasted Estimates (till 2035): Conservative Scenario (USD Million)
- Figure 15.3 Global Plasmid DNA Manufacturing Market, Forecasted Estimates (till 2035): Optimistic Scenario (USD Million)
- Figure 16.1 Plasmid DNA Manufacturing Market: Distribution by Scale of Operation, 2018, 2023 and 2035
- Figure 16.2 Plasmid DNA Manufacturing Market for Commercial Scale Operations, Historical Trends (since 2018) and Forecasted Estimates (till 2035) (USD Million)
- Figure 16.3 Plasmid DNA Manufacturing Market for Clinical Scale Operations, Historical Trends (since 2018) and Forecasted Estimates (till 2035) (USD Million)
- Figure 16.4 Plasmid DNA Manufacturing Market for Preclinical Scale Operations, Historical Trends (since 2018) and Forecasted Estimates (till 2035) (USD Million)
- Figure 17.1 Plasmid DNA Manufacturing Market: Distribution by Grade of Plasmid DNA, 2018, 2023 and 2035
- Figure 17.2 GMP Grade Plasmid DNA Manufacturing Market, Historical Trends (since 2018) and Forecasted Estimates (till 2035) (USD Million)
- Figure 17.3 Figure 17.3 Research Grade Plasmid DNA Manufacturing Market, Historical Trends (since 2018) and Forecasted Estimates (till 2035) (USD Million)
- Figure 17.4 Figure 17.4 High-Quality Plasmid DNA Manufacturing Market, Historical Trends (since 2018) and Forecasted Estimates (till 2035) (USD Million)
- Figure 18.1 Plasmid DNA Manufacturing Market: Distribution by Application Area, 2018, 2023 and 2035
- Figure 18.2 Plasmid DNA Manufacturing Market for Gene Therapy Manufacturing, Historical Trends (since 2018) and Forecasted Estimates (till 2035) (USD Million)
- Figure 18.3 Plasmid DNA Manufacturing Market for DNA Vaccine Development, Historical Trends (since 2018) and Forecasted Estimates (till 2035) (USD Million)
- Figure 18.4 Plasmid DNA Manufacturing Market for mRNA Vaccine Development, Historical Trends (since 2018) and Forecasted Estimates (till 2035) (USD Million)
- Figure 18.5 Plasmid DNA Manufacturing Market for Viral Vector Manufacturing, Historical Trends (since 2018) and Forecasted Estimates (till 2035) (USD Million)
- Figure 18.6 Plasmid DNA Manufacturing Market for Cell Therapy Manufacturing, Historical Trends (since 2018) and Forecasted Estimates (till 2035) (USD Million)
- Figure 19.1 Plasmid DNA Manufacturing Market: Distribution by Therapeutic Area, 2018, 2023 and 2035
- Figure 19.1 Plasmid DNA Manufacturing Market for Oncological Disorders, Historical Trends (since 2018) and Forecasted Estimates (till 2035) (USD Million)
- Figure 19.2 Plasmid DNA Manufacturing Market for Infectious Diseases, Historical Trends (since 2018) and Forecasted Estimates (till 2035) (USD Million)
- Figure 19.3 Plasmid DNA Manufacturing Market for Genetic Disorders, Historical Trends (since 2018) and Forecasted Estimates (till 2035) (USD Million)
- Figure 19.4 Plasmid DNA Manufacturing Market for Other Disorders, Historical Trends (since 2018) and Forecasted Estimates (till 2035) (USD Million)
- Figure 20.1 Plasmid DNA Manufacturing Market: Distribution by End User, 2018, 2023 and 2035
- Figure 20.2 Plasmid DNA Manufacturing Market for Pharma and Biotech Companies, Historical Trends (since 2018) and Forecasted Estimates (till 2035) (USD Million)
- Figure 20.3 Plasmid DNA Manufacturing Market for Academic and Research Institutes, Historical Trends (since 2018) and Forecasted Estimates (till 2035) (USD Million)
- Figure 20.4 Plasmid DNA Manufacturing Market for Other End Users, Historical Trends (since 2018) and Forecasted Estimates (till 2035) (USD Million)
- Figure 21.1 Plasmid DNA Manufacturing Market: Distribution by Geography, 2018, 2023 and 2035
- Figure 21.2 Plasmid DNA Manufacturing Market in North America, Historical Trends (since 2018) and Forecasted Estimates (till 2035) (USD Million)
- Figure 21.3 Plasmid DNA Manufacturing Market in Europe, Historical Trends (since 2018) and Forecasted Estimates (till 2035) (USD Million)
- Figure 21.4 Plasmid DNA Manufacturing Market in Asia, Historical Trends (since 2018) and Forecasted Estimates (till 2035) (USD Million)
- Figure 21.5 Plasmid DNA Manufacturing Market in Latin America, Historical Trends (since 2018) and Forecasted Estimates (till 2035) (USD Million)
- Figure 21.6 Plasmid DNA Manufacturing Market in Middle East and North Africa, Historical Trends (since 2018) and Forecasted Estimates (till 2035) (USD Million)
- Figure 21.7 Plasmid DNA Manufacturing Market in Rest of the World, Historical Trends (since 2018) and Forecasted Estimates (till 2035) (USD Million)
- Figure 22.1 Concluding Remarks: Overall Market Landscape
- Figure 22.2 Concluding Remarks: Partnerships and Collaborations
- Figure 22.3 Concluding Remarks: Acquisitions
- Figure 22.4 Concluding Remarks: Capacity Analysis
- Figure 22.5 Concluding Remarks: Demand Analysis
- Figure 22.6 Concluding Remarks: Market Forecast and Opportunity Analysis (I/II)
- Figure 22.7 Concluding Remarks: Market Forecast and Opportunity Analysis (II/II)
PLASMID DNA MANUFACTURING MARKET: OVERVIEW
As per Roots Analysis, the global plasmid DNA manufacturing market is estimated to grow from USD 0.1 billion in the current year to USD 0.53 billion by 2035, at a CAGR of 14.85% during the forecast period, till 2035.
The market sizing and opportunity analysis has been segmented across the following parameters:
Scale of Operation
- Commercial
- Clinical
- Preclinical
Application Area
- Cell Therapy Manufacturing
- Gene Therapy Manufacturing
- DNA / RNA Vaccine Development
- Viral Vector Manufacturing
- Other Application Areas
Therapeutic Area
- Metabolic Disorders
- Neurological Disorders
- Oncological Disorders
- Rare Disorders
- Other Disorders
Key Geographical Regions
- North America
- Europe
- Asia
- Latin America
- Middle East and North Africa
- Rest of the World
PLASMID DNA MANUFACTURING MARKET: GROWTH AND TRENDS
Owing to the increasing research and development initiatives for advanced therapeutics medicinal products (ATMPs), the field of plasmid DNA manufacturing is experiencing extensive growth. Ongoing efforts for plasmid DNA aim to overcome existing challenges and further expand the applications of plasmid DNA in various fields, including cell and gene therapy development, nucleic acid vaccine development and viral vector manufacturing. However, due to various challenges associated with plasmid DNA manufacturing process, including the high cost of instruments, equipment maintenance and the requirement of high-end expertise, several players in the pharmaceutical industry are outsourcing their plasmid DNA manufacturing operations to capable, specialty service providers. This outsourcing trend has resulted in the emergence of several service providers offering plasmid DNA manufacturing capabilities. Further, amidst the growing competition, the availability of cutting-edge process optimization tools and technologies has emerged as a differentiating factor. This has led many service providers to actively expand their service portfolios through strategic acquisitions. Over time, several plasmid DNA service providers claim to have developed end-to-end service capabilities, ranging from plasmid design and engineering to process development and optimization. Considering the aforementioned factors, it is anticipated that the plasmid DNA manufacturing market is likely to witness rapid growth over the next few years.
PLASMID DNA MANUFACTURING MARKET: KEY INSIGHTS
The report delves into the current state of the plasmid DNA manufacturing market and identifies potential growth opportunities within the industry. Some key findings from the report include:
1. Presently, over 70 players claim to offer a wide range of services for plasmid DNA across various application areas; majority of such firms are headquartered in North America.
2. More than 50% of the stakeholders provide GMP grade plasmid DNA manufacturing services to cell and gene therapy developers.
3. A considerable increase in partnership activity has been observed in recent years; majority of the deals inked in the current year were focused on plasmid DNA development and manufacturing.
4. The rising interest in this domain is reflected by the number of acquisitions reported in the last few years; more than 50% of such initiatives were focused on portfolio addition.
5. The global installed plasmid DNA manufacturing capacity is spread across various geographies; over 45% of this capacity is installed in the production plants located in the US.
6. Driven by the expanding pipeline of cell and gene therapies, and increasing investments in nucleic acid domain, the market for plasmid DNA manufacturing is poised to witness significant growth in the foreseeable future.
7. The plasmid DNA manufacturing market is likely to grow at a CAGR of ~15% over the next 12 years, primarily driven by the revenues generated from plasmid DNA-based therapeutics intended for oncological disorders.
PLASMID DNA MANUFACTURING MARKET: KEY SEGMENTS
Clinical Operations Occupy the Largest Share of the Plasmid DNA Manufacturing Market
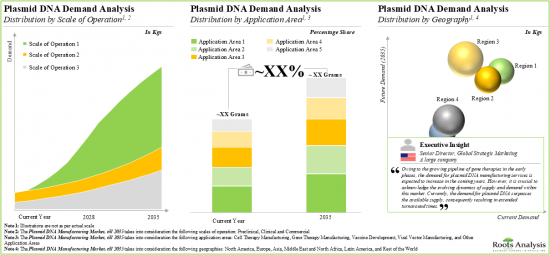
Based on the scale of operation, the market is segmented into preclinical, clinical and commercial scale. Whilst at present, the clinical scale holds the maximum share of the overall market, it is worth highlighting that the plasmid DNA manufacturing market at commercial scale is likely to grow at a relatively higher CAGR.
GMP Grade Plasmid DNA is Likely to Dominate the Plasmid DNA Manufacturing Market
Based on the grade of plasmid DNA, the market is segmented into GMP grade plasmid DNA, research grade plasmid DNA and high quality plasmid DNA. At present, GMP grade plasmid DNA captures the highest share of the plasmid DNA manufacturing market. This trend is unlikely to change in the near future.
DNA Vaccine Development is the Fastest Growing Segment of the Plasmid DNA Manufacturing Market During the Forecast Period
Based on the application area, the market is segmented into cell therapy manufacturing, gene therapy manufacturing, DNA / RNA vaccine development, viral vector manufacturing, and other application areas. It is worth highlighting that, at present, gene therapy manufacturing holds a larger share of the plasmid DNA manufacturing market. However, the plasmid DNA manufacturing market for DNA vaccine development is likely to grow at a relatively higher CAGR.
Oncological Disorders Occupy the Largest Share of the Plasmid DNA Manufacturing Market
Based on the therapeutic areas, the market is segmented into metabolic disorders, neurological disorders, oncological disorders, rare disorders, and other disorders. It is worth highlighting that the majority of the current plasmid DNA manufacturing market is captured by oncological disorders. This can be attributed to the growing incidence of oncological disorders, globally, which necessitate the development and production of effective treatments, including cell and gene therapies, and plasmid DNA based vaccines.
Pharma and Biotech Companies are Likely to Dominate the Plasmid DNA Manufacturing Market During the Forecast Period
Based on the end-users, the market is segmented into pharma and biotech companies, academic and research institutes, and other end users. At present, pharma and biotech companies hold the maximum share of the plasmid DNA manufacturing market. This trend is unlikely to change in the near future.
North America Accounts for the Largest Share of the Market
Based on key geographical regions, the market is segmented into North America, Europe, Asia, Latin America, Middle East and North Africa, and the Rest of the World. The majority of the share is expected to be captured by players based in North America. This is likely to remain the same in the forthcoming years.
Example Players in the Plasmid DNA Manufacturing Market
- AGC Biologics
- Aldevron
- Biomay
- Catalent Pharma Solutions
- Charles River
- Cytovance Biologics
- Forge Biologics
- GenScript ProBio
- Thermo Fisher Scientific
- VGXI
Primary Research Overview
The opinions and insights presented in this study were influenced by discussions conducted with multiple stakeholders. The research report features detailed transcripts of interviews held with the following industry stakeholders:
- Chief Executive Officer and Co-Founder, Small Company, Slovenia
- Senior Director, Large Company, USA
- Business Development Manager, Mid-sized Company, Spain
- Client Engagement Manager, Mid-sized Company, US
PLASMID DNA MANUFACTURING MARKET: RESEARCH COVERAGE
- Market Sizing and Opportunity Analysis: The report features an in-depth analysis of the plasmid DNA manufacturing market, focusing on key market segments, including [A] scale of operation, [B] grade of plasmid DNA, [C] application area, [D] therapeutic area, [E] end user and [F] key geographical regions.
- Market Landscape: A comprehensive evaluation of plasmid DNA manufacturing service providers, considering various parameters, such as [A] year of establishment, [B] company size (in terms of the number of employees), [C] location of headquarters, [D] type of company, [E] type of venture, [F] type of service(s) offered, [G] location of manufacturing facility, [H] key offerings, [I] grade of plasmid DNA, [J] scale of operation and [K] application area(s).
- Key Insights: An insightful analysis, highlighting the contemporary market trends in the plasmid DNA manufacturing market through different representations, based on relevant parameters, such as [A] company size and location of headquarters; [B] company size and type of venture; [C] key offerings and location of headquarters; [D] scale of operation and company size; [E] grade of plasmid DNA and application area(s); [F] scale of operation, application area(s) and location of manufacturing facility.
- Company Competitiveness Analysis: A comprehensive competitive analysis of pDNA manufacturing service providers, examining factors, such as supplier strength, their respective capabilities and partnership activity.
- Company Profiles: In-depth profiles of key industry players offering plasmid manufacturing services, focusing on [A] company overviews, [B] financial information (if available), [C] recent developments and [D] an informed future outlook.
- Partnerships and Collaborations: An analysis of partnerships established in this sector, covering manufacturing and supply agreements, product development and manufacturing agreements, technology utilization agreements, service alliances, and product development agreements.
- Acquisitions: An analysis of acquisitions reported in this sector, since 2015, based on multiple parameters, such as [A] year of acquisition, [B] type of acquisition, [C] geographical location, [D] company size and ownership of the companies involved, [E] key value drivers, and [F] acquisition deal multiples (based on revenues).
- Capacity Analysis: Estimation of global pDNA manufacturing capacity, derived from data provided by various stakeholders in the public domain. This analysis emphasizes the distribution of the available capacity on the basis of [A] company size (very small, small, mid-sized, large and very large), [B] grade of plasmid DNA (research grade plasmid DNA, and GMP grade plasmid DNA), [C] scale of operation (pre-commercial and commercial), and [D] location of manufacturing facility (North America, Europe, Asia and rest of the world).
- Demand Analysis: Informed estimates of the annual demand for plasmid DNA based on several relevant parameters, such as [A] scale of operation, [B] application area, and [C] geography. This analysis includes target patient population, dosing frequency and dose strength.
- Market Impact Analysis: The report analyzes various factors such as drivers, restraints, opportunities, and challenges affecting the market growth.
KEY QUESTIONS ANSWERED IN THIS REPORT
- How many companies are currently engaged in this market?
- Which are the leading companies in this market?
- What kind of partnership models are commonly adopted by industry stakeholders?
- What is the current annual demand for plasmid DNA?
- What are the factors that are likely to influence the evolution of this market?
- What is the current and future market size?
- What is the CAGR of this market?
- How is the current and future market opportunity likely to be distributed across key market segments?
REASONS TO BUY THIS REPORT
- The report provides a comprehensive market analysis, offering detailed revenue projections of the overall market and its specific sub-segments. This information is valuable to both established market leaders and emerging entrants.
- Stakeholders can leverage the report to gain a deeper understanding of the competitive dynamics within the market. By analyzing the competitive landscape, businesses can make informed decisions to optimize their market positioning and develop effective go-to-market strategies.
- The report offers stakeholders a comprehensive overview of the market, including key drivers, barriers, opportunities, and challenges. This information empowers stakeholders to stay abreast of market trends and make data-driven decisions to capitalize on growth prospects.
ADDITIONAL BENEFITS
- Complimentary PPT Insights Packs
- Complimentary Excel Data Packs for all Analytical Modules in the Report
- 10% Free Content Customization
- Detailed Report Walkthrough Session with Research Team
- Free Updated report if the report is 6-12 months old or older
TABLE OF CONTENTS
1. PREFACE
- 1.1. Introduction
- 1.2. Project Objectives
- 1.3. Scope of the Report
- 1.4. Inclusions and Exclusions
- 1.5. Key Questions Answered
- 1.6. Chapter Outlines
2. RESEARCH METHODOLOGY
- 2.1. Chapter Overview
- 2.2. Research Assumptions
- 2.3. Project Methodology
- 2.4. Forecast Methodology
- 2.5. Robust Quality Control
- 2.6. Key Considerations
- 2.6.1. Demographics
- 2.6.2. Economic Factors
- 2.6.3. Government Regulations
- 2.6.4. Supply Chain
- 2.6.5. COVID Impact / Related Factors
- 2.6.6. Market Access
- 2.6.7. Healthcare Policies
- 2.6.8. Industry Consolidation
- 2.7. Key Market Segmentations
3.ECONOMIC AND OTHER PROJECT SPECIFIC CONSIDERATIONS
- 3.1. Chapter Overview
- 3.2. Market Dynamics
- 3.2.1. Time Period
- 3.2.1.1. Historical Trends
- 3.2.1.2. Current and Forecasted Estimates
- 3.2.2. Currency Coverage
- 3.2.2.1. Major Currencies Affecting the Market
- 3.2.2.2. Impact of Currency Fluctuations on the Industry
- 3.2.3. Foreign Exchange Impact
- 3.2.3.1. Evaluation of Foreign Exchange Rates and Their Impact on Market
- 3.2.3.2. Strategies for Mitigating Foreign Exchange Risk
- 3.2.4. Recession
- 3.2.4.1. Historical Analysis of Past Recessions and Lessons Learnt
- 3.2.4.2. Assessment of Current Economic Conditions and Potential Impact on the Market
- 3.2.5. Inflation
- 3.2.5.1. Measurement and Analysis of Inflationary Pressures in the Economy
- 3.2.5.2. Potential Impact of Inflation on the Market Evolution
- 3.2.1. Time Period
4. EXECUTIVE SUMMARY
- 4.1. Chapter Overview
5. INTRODUCTION
- 5.1. Chapter Overview
- 5.2. Overview of Plasmids
- 5.2.1. Structure of a Plasmid DNA
- 5.3. Types of Plasmids (By Function)
- 5.3.1. Fertility Plasmids
- 5.3.2. Resistance Plasmids
- 5.3.3. Virulence Plasmids
- 5.3.4. Degradative Plasmids
- 5.3.5. Col Plasmids
- 5.4. Plasmid DNA Manufacturing
- 5.4.1. Steps Involved in Plasmid DNA Manufacturing
- 5.5. Applications of Plasmid DNA in Pharmaceutical Industry
- 5.5.1. Cell and Gene Therapy Manufacturing
- 5.5.2. Viral Vector Manufacturing
- 5.5.3. Vaccine Development
- 5.5.4. Other Research Applications
- 5.6. Challenges Associated with Plasmid DNA Manufacturing
- 5.7. Need for Outsourcing Plasmid DNA Manufacturing
- 5.8. Future Perspectives
6. OVERALL MARKET LANDSCAPE
- 6.1. Chapter Overview
- 6.2. Plasmid DNA Service Providers: Overall Market Landscape
- 6.2.1. Analysis by Year of Establishment
- 6.2.2. Analysis by Company Size
- 6.2.3. Analysis by Location of Headquarters
- 6.2.4. Analysis by Type of Company
- 6.2.5. Analysis by Type of Venture
- 6.2.6. Analysis by Type of Service(s) Offered
- 6.2.7. Analysis by Location of Manufacturing Facility
6.2.8. Analysis by Key Offerings
6.2.9. Analysis by Grade of Plasmid DNA
6.2.10. Analysis by Scale of Operation
6.2.11. Analysis by Application Area(s)
7. KEY INSIGHTS
- 7.1. Chapter Overview
- 7.2. Plasmid DNA Service Providers: Key Insights
7.2.1. Analysis by Company Size and Location of Headquarters
7.2.2. Analysis by Year of Establishment and Type of Venture
7.2.3. Analysis by Key Offerings and Location of Headquarters
7.2.4. Analysis by Scale of Operation and Company Size
7.2.5. Analysis by Grade of Plasmid DNA and Application Area(s)
7.2.6. Analysis by Scale of Operation, Application Area(s) and Location of Manufacturing Facility
8. PARTNERSHIPS AND COLLABORATIONS
- 8.1. Chapter Overview
- 8.2. Partnership Models
- 8.3. Plasmid DNA Services: Partnerships and Collaborations
- 8.3.1. Analysis by Year of Partnership
- 8.3.2. Analysis by Type of Partnership
- 8.3.3. Analysis by Year and Type of Partnership
- 8.3.4. Analysis by Type of Partner
- 8.3.5. Analysis by Type of Partnership and Type of Partner
- 8.3.6. Analysis by Grade of Plasmid DNA
- 8.3.7. Analysis by Scale of Operation
- 8.3.8. Analysis by Geography
- 8.3.8.1. Local and International Agreements
- 8.3.8.2. Intercontinental and Intracontinental Agreements
- 8.3.9. Most Active Players: Analysis by Number of Partnerships
9. ACQUISITIONS
- 9.1. Chapter Overview
- 9.2. Acquisitions Models
- 9.3. Plasmid DNA Services Providers: Acquisitions
- 9.3.1. Analysis by Year of Acquisition
- 9.3.2. Analysis by Type of Acquisition
- 9.3.3. Analysis by Geography
- 9.3.3.1. Local and International Acquisitions
- 9.3.3.2. Intercontinental and Intracontinental Acquisitions
9.3.4. Ownership Change Matrix
9.3.5. Analysis by Company Size
9.3.6. Analysis by Key Value Drivers
9.3.7. Valuation Analysis: Acquisition Deal Multiples
9.3.8. Most Active Players: Analysis by Number of Acquisitions
10. CAPACITY ANALYSIS
- 10.1. Chapter Overview
- 10.2. Key Assumptions and Methodology
- 10.3. Plasmid DNA Manufacturing: Global Installed Capacity
- 10.3.1. Analysis by Company Size
- 10.3.2. Analysis by Grade of Plasmid DNA
- 10.3.3. Analysis by Scale of Operation
- 10.3.4. Analysis by Location of Manufacturing Facility
- 10.3.4.1. Analysis of Plasmid DNA Manufacturing Capacity in North America
- 10.3.4.2. Analysis of Plasmid DNA Manufacturing Capacity in Europe
- 10.3.4.3. Analysis of Plasmid DNA Manufacturing Capacity in Asia and Rest of the World
- 10.4. Concluding Remarks
11. COMPANY COMPETITIVENSS ANALYSIS
- 11.1. Chapter Overview
- 11.2. Assumptions and Key Parameters
- 11.3. Methodology
- 11.4. Plasmid DNA Manufacturing Service Providers: Company Competitiveness Analysis
- 11.4.1. Benchmarking of Service Strength
- 11.4.2. Benchmarking of Partnership Activity
- 11.4.3. Very Small and Small Companies Offering Plasmid DNA Manufacturing
- 11.4.4. Mid-sized Companies Offering Plasmid DNA Manufacturing
- 11.4.5. Large and Very Large Companies Offering Plasmid DNA Manufacturing
12. COMPANY PROFILES
- 12.1. Chapter Overview
- 12.2. Prominent Players
- 12.2.1. AGC Biologics
- 12.2.1.1. Company Overview
- 12.2.1.2. Financial Information
- 12.2.1.3. Service Portfolio
- 12.2.1.4. Recent Developments and Future Outlook
- 12.2.2. Aldevron (acquired by Danaher)
- 12.2.2.1. Company Overview
- 12.2.2.2. Financial Information
- 12.2.2.3. Service Portfolio
- 12.2.2.4. Recent Developments and Future Outlook
- 12.2.3. Catalent Pharma Solutions
- 12.2.3.1. Company Overview
- 12.2.3.2. Financial Information
- 12.2.3.3. Service Portfolio
- 12.2.3.4. Recent Developments and Future Outlook
- 12.2.4. Centre for Breakthrough Medicines (CBM)
- 12.2.4.1. Company Overview
- 12.2.4.2. Service Portfolio
- 12.2.4.3. Recent Developments and Future Outlook
- 12.2.5. Charles River
- 12.2.5.1. Company Overview
- 12.2.5.2. Financial Information
- 12.2.5.3. Service Portfolio
- 12.2.5.4. Recent Developments and Future Outlook
- 12.2.6. GenScript ProBio (a subsidiary of GenScript)
- 12.2.6.1. Company Overview
- 12.2.6.2. Financial Information
- 12.2.6.3. Service Portfolio
- 12.2.6.4. Recent Developments and Future Outlook
- 12.2.7. PackGene Biotech
- 12.2.7.1. Company Overview
- 12.2.7.2. Service Portfolio
- 12.2.7.3. Recent Developments and Future Outlook
- 12.2.8. VectorBuilder
- 12.2.8.1. Company Overview
- 12.2.8.2. Service Portfolio
- 12.2.8.3. Recent Developments and Future Outlook
- 12.2.9. VGXI
- 12.2.9.1. Company Overview
- 12.2.9.2. Service Portfolio
- 12.2.9.3. Recent Developments and Future Outlook
- 12.2.10. WuXi ATU (a subsidiary of WuXi AppTec)
- 12.2.10.1. Company Overview
- 12.2.10.2. Financial Information
- 12.2.10.3. Service Portfolio
- 12.2.10.4. Recent Developments and Future Outlook
- 12.2.1. AGC Biologics
- 12.3. Other Key Players
- 12.3.1. 53Biologics
- 12.3.1.1. Company Overview
- 12.3.1.2. Service Portfolio
- 12.3.2. ANEMOCYTE
- 12.3.2.1. Company Overview
- 12.3.2.2. Service Portfolio
- 12.3.3. Aurigene Pharmaceutical Services
- 12.3.3.1. Company Overview
- 12.3.3.2. Service Portfolio
- 12.3.4. BioCina
- 12.3.4.1. Company Overview
- 12.3.4.2. Service Portfolio
- 12.3.5. Biovian
- 12.3.5.1. Company Overview
- 12.3.5.2. Service Portfolio
- 12.3.6. Boehringer Ingelheim BioXcellence
- 12.3.6.1. Company Overview
- 12.3.6.2. Service Portfolio
- 12.3.7. Cytovance Biologics
- 12.3.7.1. Company Overview
- 12.3.7.2. Service Portfolio
- 12.3.8. Esco Aster (a subsidiary of Esco Lifesciences)
- 12.3.8.1. Company Overview
- 12.3.8.2. Service Portfolio
- 12.3.9. Eurogentec (a subsidiary of Kaneka)
- 12.3.9.1. Company Overview
- 12.3.9.2. Service Portfolio
- 12.3.10. Forge Biologics
- 12.3.10.1. Company Overview
- 12.3.10.2. Service Portfolio
- 12.3.11. Hanmi Bio Plant (a Subsidiary of Hanmi Pharm)
- 12.3.11.1. Company Overview
- 12.3.11.2. Service Portfolio
- 12.3.12. NorthX Biologics
- 12.3.12.1. Company Overview
- 12.3.12.2. Service Portfolio
- 12.3.13. Patheon pharma services (acquired by Thermo Fisher Scientific)
- 12.3.13.1. Company Overview
- 12.3.13.2. Service Portfolio
- 12.3.14. Richter-Helm BioLogics
- 12.3.14.1. Company Overview
- 12.3.14.2. Service Portfolio
- 12.3.15. Southern RNA
- 12.3.15.1. Company Overview
- 12.3.15.2. Service Portfolio
- 12.3.16. Xpress Biologics (acquired by Polyplus)
- 12.3.16.1. Company Overview
- 12.3.16.2. Service Portfolio
- 12.3.1. 53Biologics
13. DEMAND ANALYSIS
- 13.1. Chapter Overview
- 13.2. Key Assumptions and Methodology
- 13.3. Global Demand for Plasmid DNA, Historical Trends (since 2018) and Forecasted Estimates (till 2035)
- 13.3.1. Analysis by Scale of Operation
- 13.3.1.1. Commercial Demand for Plasmid DNA, Historical Trends (since 2018) and Forecasted Estimates (till 2035)
- 13.3.1.2. Clinical Demand for Plasmid DNA, Historical Trends (since 2018) and Forecasted Estimates (till 2035)
- 13.3.1.3. Preclinical Demand for Plasmid DNA, Historical Trends (since 2018) and Forecasted Estimates (till 2035)
- 13.3.2. Analysis by Application Area
- 13.3.2.1. Plasmid DNA Demand for mRNA Therapy Development, Historical Trends (since 2018) and Forecasted Estimates (till 2035)
- 13.3.2.2. Plasmid DNA Demand for Gene Therapy Manufacturing, Historical Trends (since 2018) and Forecasted Estimates (till 2035)
- 13.3.2.3. Plasmid DNA Demand for DNA Vaccine Development, Historical Trends (since 2018) and Forecasted Estimates (till 2035)
- 13.3.2.4. Plasmid DNA Demand for Viral Vector Manufacturing, Historical Trends (since 2018) and Forecasted Estimates (till 2035)
- 13.3.2.5. Plasmid DNA Demand for Cell Therapy Manufacturing, Historical Trends (since 2018) and Forecasted Estimates (till 2035)
- 13.3.3. Analysis by Geography
- 13.3.3.1. Demand for Plasmid DNA in North America, Historical Trends (since 2018) and Forecasted Estimates (till 2035)
- 13.3.3.2. Demand for Plasmid DNA in Europe, Historical Trends (since 2018) and Forecasted Estimates (till 2035)
- 13.3.3.3. Demand for Plasmid DNA in Asia, Historical Trends (since 2018) and Forecasted Estimates (till 2035)
- 13.3.3.4. Demand for Plasmid DNA in Latin America, Historical Trends (since 2018) and Forecasted Estimates (till 2035)
- 13.3.3.5. Demand for Plasmid DNA in Middle East and North Africa, Historical Trends (since 2018) and Forecasted Estimates (till 2035)
- 13.3.3.6. Demand for Plasmid DNA in Rest of the World, Historical Trends (since 2018) and Forecasted Estimates (till 2035)
- 13.3.1. Analysis by Scale of Operation
14. MARKET IMPACT ANALYSIS: DRIVERS, RESTRAINTS, OPPORTUNITIES AND CHALLENGES
- 14.1. Chapter Overview
- 14.2. Market Drivers
- 14.3. Market Restraints
- 14.4. Market Opportunities
- 14.5. Market Challenges
- 14.6. Conclusion
15. GLOBAL PLASMID DNA MANUFACTURING MARKET
- 15.1. Chapter Overview
- 15.2. Assumptions and Methodology
- 15.3. Global Plasmid DNA Manufacturing Market, Historical Trends (since 2018) and Forecasted Estimates (till 2035)
- 15.3.1. Scenario Analysis
- 15.3.1.1. Conservative Scenario
- 15.3.1.2. Optimistic Scenario
- 15.3.1. Scenario Analysis
- 15.4. Key Market Segmentations
16. PLASMID DNA MANUFACTURING MARKET, BY SCALE OF OPERATION
- 16.1. Chapter Overview
- 16.2. Key Assumptions and Methodology
- 16.3. Plasmid DNA Manufacturing Market: Distribution By Scale of Operation, 2018, 2023 and 2035
- 16.3.1. Commercial Scale of Operation: Historical Trends (since 2018) and Forecasted Estimates (till 2035)
- 16.3.2. Clinical Scale of Operation: Historical Trends (since 2018) and Forecasted Estimates (till 2035)
- 16.3.3. Preclinical Scale of Operation: Historical Trends (since 2018) and Forecasted Estimates (till 2035)
- 16.4. Data Triangulation and Validation
17. PLASMID DNA MANUFACTURING MARKET, BY GRADE OF PLASMID DNA
- 17.1. Chapter Overview
- 17.2. Key Assumptions and Methodology
- 17.3. Plasmid DNA Manufacturing Market: Distribution By Scale of Operation, 2018, 2023 and 2035
- 17.3.1. GMP Grade Plasmid DNA: Historical Trends (since 2018) and Forecasted Estimates (till 2035)
- 17.3.2. Research Grade Plasmid DNA: Historical Trends (since 2018) and Forecasted Estimates (till 2035)
- 17.3.3. High-Quality Plasmid DNA: Historical Trends (since 2018) and Forecasted Estimates (till 2035)
- 17.4. Data Triangulation and Validation
18. PLASMID DNA MANUFACTURING MARKET, BY APPLICATION AREA
- 18.1. Chapter Overview
- 18.2. Key Assumptions and Methodology
- 18.3. Plasmid DNA Manufacturing Market: Distribution By Application Area, 2018, 2023 and 2035
- 18.3.1. Gene Therapy Manufacturing: Historical Trends (since 2018) and Forecasted Estimates (till 2035)
- 18.3.2. DNA Vaccine Development: Historical Trends (since 2018) and Forecasted Estimates (till 2035)
- 18.3.3. mRNA Vaccine Development: Historical Trends (since 2018) and Forecasted Estimates (till 2035)
- 18.3.4. Viral Vector Manufacturing: Historical Trends (since 2018) and Forecasted Estimates (till 2035)
- 18.3.5. Cell Therapy Manufacturing: Historical Trends (since 2018) and Forecasted Estimates (till 2035)
- 18.4. Data Triangulation and Validation
19. PLASMID DNA MANUFACTURING MARKET, BY THERAAPEUTIC AREA
- 19.1. Chapter Overview
- 19.2. Key Assumptions and Methodology
- 19.3. Plasmid DNA Manufacturing Market: Distribution By Therapeutic Area, 2018, 2023 and 2035
- 19.3.1. Oncological Disorders: Historical Trends (since 2018) and Forecasted Estimates (till 2035)
- 19.3.2. Infectious Diseases: Historical Trends (since 2018) and Forecasted Estimates (till 2035)
- 19.3.3. Genetic Disorders: Historical Trends (since 2018) and Forecasted Estimates (till 2035)
- 19.3.4. Other Disorders: Historical Trends (since 2018) and Forecasted Estimates (till 2035)
- 19.4. Data Triangulation and Validation
20. PLASMID DNA MANUFACTURING MARKET, BY END USER
- 20.1. Chapter Overview
- 20.2. Key Assumptions and Methodology
- 20.3. Plasmid DNA Manufacturing Market: Distribution By End Uset, 2018, 2023 and 2035
- 20.3.1. Pharma and Biotech Companies: Historical Trends (since 2018) and Forecasted Estimates (till 2035)
- 20.3.2. Academic and Research Institutes: Historical Trends (since 2018) and Forecasted Estimates (till 2035)
- 20.3.3. Other End Users: Historical Trends (since 2018) and Forecasted Estimates (till 2035)
- 20.4. Data Triangulation and Validation
21. PLASMID DNA MANUFACTURING MARKET, BY GEOGRAPHY
- 21.1. Chapter Overview
- 21.2. Key Assumptions and Methodology
- 21.3. Plasmid DNA Manufacturing Market: Distribution By Geography, 2018, 2023 and 2035
- 21.3.1. North America: Historical Trends (since 2018) and Forecasted Estimates (till 2035)
- 21.3.2. Europe: Historical Trends (since 2018) and Forecasted Estimates (till 2035)
- 21.3.3. Asia: Historical Trends (since 2018) and Forecasted Estimates (till 2035)
- 21.3.4. Latin America: Historical Trends (since 2018) and Forecasted Estimates (till 2035)
- 21.3.5. Middle East and North Africa: Historical Trends (since 2018) and Forecasted Estimates (till 2035)
- 21.3.6. Rest of the World: Historical Trends (since 2018) and Forecasted Estimates (till 2035)
- 21.4. Data Triangulation and Validation
22. CONCLUSION
- 22.1. Chapter Overview
23. EXECUTIVE INSIGHTS
- 23.1. Chapter Overview
- 23.2. Company A
- 23.2.1. Company Snapshot
- 23.2.2. Interview Transcript: Chief Executive Officer and Co-Founder
- 23.3. Company B
- 23.3.1. Company Snapshot
- 23.3.2. Interview Transcript: Senior Director of Global Strategic Marketing
- 23.4. Company C
- 23.4.1. Company Snapshot
- 23.4.2. Interview Transcript: Business Development Manager
- 23.5. Company D
- 23.5.1. Company Snapshot
- 23.5.2. Interview Transcript: Client Engagement Manager
