表紙:医薬品受託製造市場:産業動向と世界予測 (~2035年) - 製造される製品タイプ別、APIタイプ別、APIの薬理活性別、FDFタイプ別、剤形別、包装タイプ別、エンドユーザー別、事業規模別、地域別
市場調査レポート
商品コード
1549405

医薬品受託製造市場:産業動向と世界予測 (~2035年) - 製造される製品タイプ別、APIタイプ別、APIの薬理活性別、FDFタイプ別、剤形別、包装タイプ別、エンドユーザー別、事業規模別、地域別

Pharmaceutical Contract Manufacturing Market: Industry Trends and Global Forecasts, Till 2035: Distribution by Type of Product Manufactured, Type of FDF, Dosage Form, Type of Packaging Offered, Scale of Operation, End Users and Key Geographical Regions

出版日: | 発行: Roots Analysis | ページ情報: 英文 545 Pages | 納期: 即日から翌営業日

● お客様のご希望に応じて、既存データの加工や未掲載情報(例:国別セグメント)の追加などの対応が可能です。  詳細はお問い合わせください。

価格
価格表記: USDを日本円(税抜)に換算
本日の銀行送金レート: 1USD=147.72円
医薬品受託製造市場:産業動向と世界予測 (~2035年) - 製造される製品タイプ別、APIタイプ別、APIの薬理活性別、FDFタイプ別、剤形別、包装タイプ別、エンドユーザー別、事業規模別、地域別
出版日: 2024年06月12日
発行: Roots Analysis
ページ情報: 英文 545 Pages
納期: 即日から翌営業日
  • 全表示
  • 概要
  • 図表
  • 目次
概要

医薬品受託製造の市場規模は、2024年に990億米ドルに達するとみられ、2024年から2035年の予測期間中に4.3%のCAGRで拡大すると予測されています。

急速に進化する医薬品情勢において、低分子医薬品はイノベーションと開発を形作る上で極めて重要な役割を果たし続けています。現在、低分子医薬品は医薬品全体の90%を占めていますが、近年では幅広い疾患に対応できることから、生物学的製剤が注目を集めています。この分野では新規低分子医薬品の承認も再び増加しており、2020年だけでも50種類以上の候補薬が米国FDAの承認を受けています。この傾向により、医薬品開発調査受託機関(CRO)が提供するサービスの需要が大幅に高まっています。

こうした新薬候補の製造には、専門施設、高度な設備、および業務の専門知識が必要であることに留意することが重要です。その結果、製薬会社は開発および製造業務を独自に実施することが課題になる可能性があります。さらに、製造能力の確立または取得に関連する時間とコストにより、小規模および大規模の製薬会社は、製造業務を受託製造組織(CMO)および契約開発製造組織(CDMO)にアウトソーシングする傾向が高まっています。より安全で効果的な医薬品に対する切迫したニーズにより、受託製造サービスの需要がさらに高まっています。

効率、トレーサビリティ、コスト効率の向上を求める声を受けて、医薬品の受託製造は大きな技術的進歩を遂げています。製造業務をCMOやCDMOにアウトソーシングするには、生産ワークフローを最適化し、規制遵守を確保し、製品の品質基準を維持するための専門的なソリューションを実装する必要があります。さらに、患者のニーズの多様性に応えるために柔軟な製造能力を必要とする個別化医療への注目が高まっています。製薬会社がこうした進化する動向に適応するにつれて、今後数年間で受託製造サービスの特定の要件に合わせた高度なソリューションの需要が増加すると予想されます。

当レポートでは、世界の医薬品受託製造市場について調査し、市場の概要とともに、製造される製品タイプ別、APIタイプ別、APIの薬理活性別、FDFタイプ別、剤形別、包装タイプ別、エンドユーザー別、事業規模別、地域別の動向、および市場に参入する企業のプロファイルなどを提供しています。

目次

第1章 序文

第2章 調査手法

第3章 経済およびその他のプロジェクト特有の考慮事項

第4章 エグゼクティブサマリー

第5章 イントロダクション

第6章 医薬品受託製造:規制状況

第7章 医薬品受託製造:市場情勢

第8章 地域能力

第9章 企業プロファイル

  • 章の概要
  • 北米に拠点を置く医薬品受託製造機関
  • 欧州に拠点を置く医薬品受託製造機関
  • アジア太平洋およびその他の地域に拠点を置く医薬品受託製造機関

第10章 ショートプロファイル

第11章 製造と購入の意思決定の枠組み

第12章 合併と買収

第13章 最近の拡張

第14章 容量分析

第15章 需要分析

第16章 市場への影響分析:促進要因、抑制要因、機会、課題

第17章 世界の医薬品受託製造市場

第18章 医薬品受託製造市場(製造される製品タイプ別)

第19章 API受託製造市場(APIタイプ別)

第20章 API受託製造市場(APIの薬理活性別)

第21章 FDF受託製造市場(FDFタイプ別)

第22章 FDF受託製造市場(剤形別)

第23章 医薬品受託製造市場(包装タイプ別)

第24章 医薬品受託製造市場(エンドユーザー別)

第25章 医薬品受託製造市場(事業規模別)

第26章 医薬品受託製造市場(主要地域別)

第27章 医薬品受託製造市場(主要企業別)

第28章 ケーススタディ:低分子薬と高分子薬/治療法の比較

第29章 結論

第30章 エグゼクティブ洞察

  • 章の概要
  • Ajinomoto Althea
  • Bachem
  • CiVentiChem
  • CordenPharma
  • Helsinn Group
  • Novasep
  • Sovereign Pharma
  • Wavelength Pharmaceuticals

第31章 付録1:表形式のデータ

第32章 付録2:企業・団体一覧

図表

List of Tables

  • Table 6.1 Sustainable Packaging Providers: Information on Year of Establishment, Company Size and Location of Headquarters
  • Table 6.2 Sustainable Packaging Providers: Information on Type of Offering and ISO Certifications / Accreditations
  • Table 6.3 Sustainable Packaging Providers: Information on Type of Packaging
  • Table 6.4 Sustainable Packaging Providers: Information on Type of Eco-friendly Packaging and Technology Used
  • Table 6.5 Sustainable Packaging Providers: Information on Origin of Packaging Material and Type of Packaging Material Used
  • Table 6.6 Sustainable Packaging Providers: Information on Dosage Form
  • Table 6.7 Sustainable Packaging Providers: Information on Packaging Applications
  • Table 7.1 List of Companies: Detailed Profiles
  • Table 7.2 Drug Plastics: Company Overview
  • Table 7.3 Drug Plastics: Sustainable Packaging Offerings
  • Table 7.4 DS Smith: Company Overview
  • Table 7.5 DS Smith: Sustainable Packaging Offerings
  • Table 7.6 MM Board & Paper: Company Overview
  • Table 7.7 MM Board & Paper: Sustainable Packaging Offerings
  • Table 7.8 Mondi: Company Overview
  • Table 7.9 Mondi: Sustainable Packaging Offerings
  • Table 7.10 Mondi: Recent Developments and Future Outlook
  • Table 7.11 PGP Glass: Company Overview
  • Table 7.12 PGP Glass: Sustainable Packaging Offerings
  • Table 7.13 Smurfit Kappa: Company Overview
  • Table 7.14 Smurfit Kappa: Sustainable Packaging Offerings
  • Table 7.15 Smurfit Kappa: Recent Developments and Future Outlook
  • Table 7.16 Syntegon: Company Overview
  • Table 7.17 Syntegon: Sustainable Packaging Offerings
  • Table 7.18 Syntegon: Recent Developments and Future Outlook
  • Table 7.19 List of Other Companies Profiled
  • Table 7.20 Berry Global: Company Overview
  • Table 7.21 Berry Global: Sustainable Packaging Offerings
  • Table 7.22 Berry Global: Recent Developments and Future Outlook
  • Table 7.23 Huhtamaki: Company Overview
  • Table 7.24 Huhtamaki: Sustainable Packaging Offerings
  • Table 7.25 SGD Pharma: Company Overview
  • Table 7.26 SGD Pharma: Sustainable Packaging Offerings
  • Table 7.27 SGD Pharma: Recent Developments and Future Outlook
  • Table 8.1 List of Companies: Short Profiles
  • Table 8.2 Amcor: Company Overview
  • Table 8.3 Amcor: Sustainable Packaging Offerings
  • Table 8.4 Bormioli Pharma: Company Overview
  • Table 8.5 Bormioli Pharma: Sustainable Packaging Offerings
  • Table 8.6 EPL: Company Overview
  • Table 8.7 EPL: Sustainable Packaging Offerings
  • Table 8.8 Gerresheimer: Company Overview
  • Table 8.9 Gerresheimer: Sustainable Packaging Offerings
  • Table 8.10 Greiner Packaging: Company Overview
  • Table 8.11 Greiner Packaging: Sustainable Packaging Offerings
  • Table 8.12 International Paper: Company Overview
  • Table 8.13 International Paper: Sustainable Packaging Offerings
  • Table 8.14 PPC Flexible Packaging: Company Overview
  • Table 8.15 PPC Flexible Packaging: Sustainable Packaging Offerings
  • Table 8.16 Stoelzle Glass: Company Overview
  • Table 8.17 Stoelzle Glass: Sustainable Packaging Offerings
  • Table 8.18 Takemoto Packaging: Company Overview
  • Table 8.19 Takemoto Packaging: Sustainable Packaging Offerings
  • Table 8.20 Tekni-Plex: Company Overview
  • Table 8.21 Tekni-Plex: Sustainable Packaging Offerings
  • Table 10.1 Sustainable Packaging Providers: List of Partnerships and Collaborations, 2019-2024
  • Table 10.2 Partnerships and Collaborations: Information on Location of Headquarters (Country and Region) and Type of Agreement (Country and Region)
  • Table 11.1 Sustainable Packaging Market: List of Funding and Investments, 2019-2024
  • Table 21.1 Packaging Guru: Company Snapshot
  • Table 21.2 eutecma: Company Snapshot
  • Table 21.3 XX: Company Snapshot
  • Table 21.4 Softbox Systems: Company Snapshot
  • Table 21.5 Coveris: Company Snapshot
  • Table 21.6 Korber: Company Snapshot
  • Table 21.7 Bormioli Pharma: Company Snapshot
  • Table 22.1 Sustainable Packaging Providers: Distribution by Year of Establishment
  • Table 22.2 Sustainable Packaging Providers: Distribution by Company Size
  • Table 22.3 Sustainable Packaging Providers: Distribution by Location of Headquarters (Region)
  • Table 22.4 Sustainable Packaging Providers: Distribution by Location of Headquarters (Country)
  • Table 22.5 Sustainable Packaging Providers: Distribution by Company Size and Location of Headquarters (Region)
  • Table 22.6 Sustainable Packaging Providers: Distribution by Type of Offering
  • Table 22.7 Sustainable Packaging Providers: Distribution by ISO Certifications / Accreditations
  • Table 22.8 Sustainable Packaging Providers: Distribution by Type of Packaging
  • Table 22.9 Sustainable Packaging Providers: Distribution by Location of Headquarters (Region) and Type of Packaging
  • Table 22.10 Sustainable Packaging Providers: Distribution by Type of Eco-friendly Packaging
  • Table 22.11 Sustainable Packaging Providers: Distribution by Location of Headquarters (Region) and Type of Eco-friendly Packaging
  • Table 22.12 Sustainable Packaging Providers: Distribution by Origin of Packaging Material
  • Table 22.13 Sustainable Packaging Providers: Distribution by Type of Packaging Material Used
  • Table 22.14 Sustainable Packaging Providers: Distribution by Packaging Applications
  • Table 22.15 Most Active Players: Distribution by Number of Packaging Products Offered
  • Table 22.16 DS Smith: Annual Revenues, FY 2019 - H1 FY 2024 (GBP Million)
  • Table 22.17 MM Board & Paper: Annual Revenues, FY 2019 - FY 2023 (EUR Million)
  • Table 22.18 Mondi: Annual Revenues, FY 2019 - FY 2023 (EUR Million)
  • Table 22.19 PGP Glass: Annual Revenues, FY 2022 - FY 2023 (INR Billion)
  • Table 22.20 Smurfit Kappa: Annual Revenues, FY 2019 - FY 2023 (EUR Million)
  • Table 22.21 Berry Global: Annual Revenues, FY 2019 - Q1 FY 2024 (USD Million)
  • Table 22.22 Huhtamaki: Annual Revenues, FY 2019 - FY 2023 (EUR Million)
  • Table 22.23 Partnerships and Collaborations: Cumulative Year-wise Trend, 2019-2024
  • Table 22.24 Partnerships and Collaborations: Distribution by Type of Partnership
  • Table 22.25 Partnerships and Collaborations: Distribution by Year and Type of Partnership, 2019-2024
  • Table 22.26 Partnerships and Collaborations: Distribution by Type of Partner
  • Table 22.27 Partnerships and Collaborations: Distribution by Type of Eco-friendly Packaging
  • Table 22.28 Most Active Players: Distribution by Number of Partnerships
  • Table 22.29 Partnership and Collaborations: Local and International Agreements
  • Table 22.30 Partnerships and Collaborations: Intracontinental and Intercontinental Agreements
  • Table 22.31 Funding and Investments: Cumulative Year-wise Trend, 2019-2024
  • Table 22.32 Funding and Investments: Distribution of Instances by Type of Funding
  • Table 22.33 Funding and Investments: Distribution by Year and Type of Funding, 2019-2024
  • Table 22.34 Funding and Investments: Distribution by Amount Invested, 2020-2024 (USD Million)
  • Table 22.35 Funding and Investments: Distribution of Type of Funding and Amount Invested (USD Million)
  • Table 22.36 Funding and Investments: Distribution by Geography (Region)
  • Table 22.37 Most Active Players: Distribution by Number of Funding Instances
  • Table 22.38 Most Active Players: Distribution by Amount Raised (USD Million)
  • Table 22.39 Leading Investors: Distribution by Number of Funding Instances
  • Table 22.40 Funding and Investments Summary, 2019-2024 (USD Million)
  • Table 22.41 Global Demand for Sustainable Packaging, till 2035 (Billion Units)
  • Table 22.42 Global Demand for Sustainable Packaging: Distribution by Type of Packaging, till 2035 (Billion Units)
  • Table 22.43 Global Sustainable Packaging Demand for Primary Packaging Containers, till 2035 (Billion Units)
  • Table 22.44 Global Sustainable Packaging Demand for Secondary Packaging Containers, till 2035 (Billion Units)
  • Table 22.45 Global Sustainable Packaging Demand for Tertiary Packaging Containers, till 2035 (Billion Units)
  • Table 22.46 Global Sustainable Packaging Market, till 2035 (USD Billion)
  • Table 22.47 Global Sustainable Packaging Market, Forecasted Estimates (2024-2035): Conservative Scenario (USD Billion)
  • Table 22.48 Global Sustainable Packaging Market, Forecasted Estimates (2024-2035): Optimistic Scenario (USD Billion)
  • Table 22.49 Sustainable Packaging Market: Distribution by Type of Eco-friendly Packaging, 2024, 2028 and 2035
  • Table 22.50 Sustainable Packaging Market for Biodegradable Packaging, till 2035 (USD Billion)
  • Table 22.51 Sustainable Packaging Market for Recyclable / Reusable Packaging, till 2035, Conservative, Base and Optimistic Scenarios (USD Billion)
  • Table 22.52 Sustainable Packaging Market: Distribution by Type of Packaging, 2024, 2028 and 2035
  • Table 22.53 Sustainable Packaging Market for Primary Packaging, till 2035, Conservative, Base and Optimistic Scenarios (USD Billion)
  • Table 22.54 Sustainable Packaging Market for Secondary Packaging, till 2035, Conservative, Base and Optimistic Scenarios (USD Billion)
  • Table 22.55 Sustainable Packaging Market for Tertiary Packaging, till 2035, Conservative, Base and Optimistic Scenarios (USD Billion)
  • Table 22.56 Sustainable Packaging Market: Distribution by Type of Primary Packaging Container, 2024, 2028 and 2035
  • Table 22.57 Primary Sustainable Packaging Market for Vials, till 2035, Conservative, Base and Optimistic Scenarios (USD Billion)
  • Table 22.58 Primary Sustainable Packaging Market for Ampoules, till 2035, Conservative, Base and Optimistic Scenarios (USD Billion)
  • Table 22.59 Primary Sustainable Packaging Market for Bottles, till 2035, Conservative, Base and Optimistic Scenarios (USD Billion)
  • Table 22.60 Primary Sustainable Packaging Market for Cartridges, till 2035, Conservative, Base and Optimistic Scenarios (USD Billion)
  • Table 22.61 Primary Sustainable Packaging Market for Syringes, till 2035, Conservative, Base and Optimistic Scenarios (USD Billion)
  • Table 22.62 Sustainable Packaging Market: Distribution by Type of Secondary Packaging Container, 2024, 2028 and 2035
  • Table 22.63 Secondary Sustainable Packaging Market for Boxes / Cartons, till 2035, Conservative, Base and Optimistic Scenarios (USD Billion)
  • Table 22.64 Secondary Sustainable Packaging Market for Pouches, till 2035, Conservative, Base and Optimistic Scenarios (USD Billion)
  • Table 22.65 Sustainable Packaging Market: Distribution by Type of Tertiary Packaging Container, 2024, 2028 and 2035
  • Table 22.66 Tertiary Sustainable Packaging Market for Boxes, till 2035, Conservative, Base and Optimistic Scenarios (USD Billion)
  • Table 22.67 Tertiary Sustainable Packaging Market for Cartons, till 2035, Conservative, Base and Optimistic Scenarios (USD Billion)
  • Table 22.68 Tertiary Sustainable Packaging Market for Shippers, till 2035, Conservative, Base and Optimistic Scenarios (USD Billion)
  • Table 22.69 Sustainable Packaging Market: Distribution by End-user, 2024, 2028 and 2035
  • Table 22.70 Sustainable Packaging Market for Pharmaceutical and Biotechnology Companies, till 2035, Conservative, Base and Optimistic Scenarios (USD Billion)
  • Table 22.71 Sustainable Packaging Market for Research Institutes, till 2035, Conservative, Base and Optimistic Scenarios (USD Billion)
  • Table 22.72 Sustainable Packaging Market for Other End-users, till 2035, Conservative, Base and Optimistic Scenarios (USD Billion)
  • Table 22.73 Sustainable Packaging Market: Distribution by Key Geographical Regions, 2024, 2028 and 2035
  • Table 22.74 Sustainable Packaging Market in North America, till 2035, Conservative, Base and Optimistic Scenarios (USD Billion)
  • Table 22.75 Sustainable Packaging Market in Europe, till 2035, Conservative, Base and Optimistic Scenarios (USD Billion)
  • Table 22.76 Sustainable Packaging Market in Asia-Pacific, till 2035, Conservative, Base and Optimistic Scenarios (USD Billion)
  • Table 22.77 Sustainable Packaging Market in Middle East and North Africa, till 2035, Conservative, Base and Optimistic Scenarios (USD Billion)
  • Table 22.78 Sustainable Packaging Market in Latin America, till 2035, Conservative, Base and Optimistic Scenarios (USD Billion)
  • Table 22.79 Sustainable Packaging Market in Rest of the World, till 2035, Conservative, Base and Optimistic Scenarios (USD Billion)

List of Figures

  • Figure 2.1 Research Methodology: Project Methodology
  • Figure 2.2 Research Methodology: Forecast Methodology
  • Figure 2.3 Research Methodology: Robust Quality Control
  • Figure 2.4 Research Methodology: Key Market Segmentation
  • Figure 3.1 Lessons Learnt from Past Recessions
  • Figure 4.1 Executive Summary: Market Landscape
  • Figure 4.2 Executive Summary: Partnerships and Collaborations
  • Figure 4.3 Executive Summary: Funding and Investments
  • Figure 4.4 Executive Summary: Demand Analysis
  • Figure 4.5 Executive Summary: Market Forecast and Opportunity Analysis
  • Figure 5.1 Steps Involved in Pharmaceutical Aseptic Packaging
  • Figure 5.2 Advantages of Pharmaceutical Packaging
  • Figure 5.3 Types of Pharmaceutical Packaging
  • Figure 5.4 Drawbacks of Conventional Pharmaceutical Packaging Materials
  • Figure 5.5 Raw Materials for Packaging
  • Figure 5.6 ISO Standards for Pharmaceutical Packaging
  • Figure 5.7 Advantages of Sustainable Packaging Materials
  • Figure 5.8 Limitations of Sustainable Packaging Materials
  • Figure 6.1 Sustainable Packaging Providers: Distribution by Year of Establishment
  • Figure 6.2 Sustainable Packaging Providers: Distribution by Company Size
  • Figure 6.3 Sustainable Packaging Providers: Distribution by Location of Headquarters (Region)
  • Figure 6.4 Sustainable Packaging Providers: Distribution by Location of Headquarters (Country)
  • Figure 6.5 Sustainable Packaging Providers: Distribution by Company Size and Location of Headquarters (Region)
  • Figure 6.6 Sustainable Packaging Providers: Distribution by Type of Offering
  • Figure 6.7 Sustainable Packaging Providers: Distribution by ISO Certifications / Accreditations
  • Figure 6.8 Sustainable Packaging Providers: Distribution by Type of Packaging
  • Figure 6.9 Sustainable Packaging Providers: Distribution by Location of Headquarters (Region) and Type of Packaging
  • Figure 6.10 Sustainable Packaging Providers: Distribution by Type of Eco-friendly Packaging
  • Figure 6.11 Sustainable Packaging Providers: Distribution by Location of Headquarters (Region) and Type of Eco-friendly Packaging
  • Figure 6.12 Sustainable Packaging Providers: Distribution by Origin of Packaging Material
  • Figure 6.13 Sustainable Packaging Providers: Distribution by Type of Packaging Material Used
  • Figure 6.14 Sustainable Packaging Providers: Distribution by Packaging Applications
  • Figure 6.15 Most Active Players: Distribution by Number of Packaging Products Offered
  • Figure 7.1 DS Smith: Annual Revenues, FY 2019 - H1 FY 2024 (GBP Million)
  • Figure 7.2 MM Board & Paper: Annual Revenues, FY 2019 - FY 2023 (EUR Million)
  • Figure 7.3 Mondi: Annual Revenues, FY 2019 - FY 2023 (EUR Million)
  • Figure 7.4 PGP Glass: Annual Revenues, FY 2022 - FY 2023 (INR Billion)
  • Figure 7.5 Smurfit Kappa: Annual Revenues, FY 2019 - FY 2023 (EUR Million)
  • Figure 7.6 Berry Global: Annual Revenues, FY 2019 - Q1 FY 2024 (USD Million)
  • Figure 7.7 Huhtamaki: Annual Revenues, FY 2019 - FY 2023 (EUR Million)
  • Figure 9.1 Company Competitiveness Analysis: Companies Based in North America (Peer Group I)
  • Figure 9.2 Company Competitiveness Analysis: Companies Based in Europe (Peer Group IIa)
  • Figure 9.3 Company Competitiveness Analysis: Companies Based in Europe (Peer Group IIb)
  • Figure 9.4 Company Competitiveness Analysis: Companies Based in Asia-Pacific (Peer Group III)
  • Figure 10.1 Partnerships and Collaborations: Cumulative Year-wise Trend, 2019-2024
  • Figure 10.2 Partnerships and Collaborations: Distribution by Type of Partnership
  • Figure 10.3 Partnerships and Collaborations: Distribution by Year and Type of Partnership, 2019-2024
  • Figure 10.4 Partnerships and Collaborations: Distribution by Type of Partner
  • Figure 10.5 Partnerships and Collaborations: Distribution by Type of Eco-friendly Packaging
  • Figure 10.6 Most Active Players: Distribution by Number of Partnerships
  • Figure 10.7 Partnership and Collaborations: Local and International Agreements
  • Figure 10.8 Partnerships and Collaborations: Intracontinental and Intercontinental Agreements
  • Figure 11.1 Funding and Investments: Cumulative Year-wise Trend, 2019-2024
  • Figure 11.2 Funding and Investments: Distribution of Instances by Type of Funding
  • Figure 11.3 Funding and Investments: Distribution by Year and Type of Funding, 2019-2024
  • Figure 11.4 Funding and Investments: Distribution by Amount Invested, 2020-2024 (USD Million)
  • Figure 11.5 Funding and Investments: Distribution of Type of Funding and Amount Invested (USD Million)
  • Figure 11.6 Funding and Investments: Distribution by Geography (Region)
  • Figure 11.7 Most Active Players: Distribution by Number of Funding Instances
  • Figure 11.8 Most Active Players: Distribution by Amount Raised (USD Million)
  • Figure 11.9 Leading Investors: Distribution by Number of Funding Instances
  • Figure 11.10 Funding and Investment Summary, 2019-2024 (USD Million)
  • Figure 12.1 Sustainable Packaging; Market Drivers
  • Figure 12.2 Sustainable Packaging; Market Restraints
  • Figure 12.3 Sustainable Packaging; Market Opportunities
  • Figure 12.4 Sustainable Packaging; Market Challenges
  • Figure 13.1 Global Demand for Sustainable Packaging, till 2035 (Billion Units)
  • Figure 13.2 Global Demand for Sustainable Packaging: Distribution by Type of Packaging, till 2035 (Billion Units)
  • Figure 13.3 Global Sustainable Packaging Demand for Primary Packaging Containers, till 2035 (Billion Units)
  • Figure 13.4 Global Sustainable Packaging Demand for Secondary Packaging Containers, till 2035 (Billion Units)
  • Figure 13.5 Global Sustainable Packaging Demand for Tertiary Packaging Containers, till 2035 (Billion Units)
  • Figure 14.1 Global Sustainable Packaging Market, till 2035 (USD Billion)
  • Figure 14.2 Global Sustainable Packaging Market, Forecasted Estimates (2024-2035): Conservative Scenario (USD Billion)
  • Figure 14.3 Global Sustainable Packaging Market, Forecasted Estimates (2024-2035): Optimistic Scenario (USD Billion)
  • Figure 15.1 Sustainable Packaging Market: Distribution by Type of Eco-friendly Packaging, 2024, 2028 and 2035
  • Figure 15.2 Sustainable Packaging Market for Biodegradable Packaging, till 2035 (USD Billion)
  • Figure 15.3 Sustainable Packaging Market for Recyclable / Reusable Packaging, till 2035 (USD Billion)
  • Figure 16.1 Sustainable Packaging Market: Distribution by Type of Packaging, 2024, 2028 and 2035
  • Figure 16.2 Sustainable Packaging Market for Primary Packaging, till 2035 (USD Billion)
  • Figure 16.3 Sustainable Packaging Market for Secondary Packaging, till 2035 (USD Billion)
  • Figure 16.4 Sustainable Packaging Market for Tertiary Packaging, till 2035 (USD Billion)
  • Figure 17.1 Sustainable Packaging Market: Distribution by Type of Primary Packaging Containers, 2024, 2028 and 2035
  • Figure 17.2 Primary Sustainable Packaging Market for Ampoules, till 2035 (USD Billion)
  • Figure 17.3 Primary Sustainable Packaging Market for Bottles, till 2035 (USD Billion)
  • Figure 17.4 Primary Sustainable Packaging Market for Cartridges, till 2035 (USD Billion)
  • Figure 17.5 Primary Sustainable Packaging Market for Syringes, till 2035 (USD Billion)
  • Figure 17.6 Primary Sustainable Packaging Market for Vials, till 2035 (USD Billion)
  • Figure 17.7 Sustainable Packaging Market: Distribution by Type of Secondary Packaging Containers, 2024, 2028 and 2035
  • Figure 17.8 Secondary Sustainable Packaging Market for Boxes / Cartons, till 2035 (USD Billion)
  • Figure 17.9 Secondary Sustainable Packaging Market for Pouches, till 2035 (USD Billion)
  • Figure 17.10 Sustainable Packaging Market: Distribution by Type of Tertiary Packaging Containers, 2024, 2028 and 2035 (USD Billion)
  • Figure 17.11 Tertiary Sustainable Packaging Market for Boxes, till 2035 (USD Billion)
  • Figure 17.12 Tertiary Sustainable Packaging Market for Cartons, till 2035 (USD Billion)
  • Figure 17.13 Tertiary Sustainable Packaging Market for Shippers, till 2035 (USD Billion)
  • Figure 18.1 Sustainable Packaging Market: Distribution by End-user, 2024, 2028 and 2035
  • Figure 18.2 Sustainable Packaging Market for Pharmaceutical and Biotechnology Companies, till 2035 (USD Billion)
  • Figure 18.3 Sustainable Packaging Market for Research Institutes, till 2035 (USD Billion)
  • Figure 18.4 Sustainable Packaging Market for Other End-users, till 2035 (USD Billion)
  • Figure 19.1 Sustainable Packaging Market: Distribution by Key Geographical Regions, 2024, 2028 and 2035
  • Figure 19.2 Sustainable Packaging Market in North America, till 2035 (USD Billion)
  • Figure 19.3 Sustainable Packaging Market in Europe, till 2035 (USD Billion)
  • Figure 19.4 Sustainable Packaging Market in Asia-Pacific, till 2035 (USD Billion)
  • Figure 19.5 Sustainable Packaging Market in Middle East and North Africa, till 2035 (USD Billion)
  • Figure 19.6 Sustainable Packaging Market in Latin America, till 2035 (USD Billion)
  • Figure 19.7 Sustainable Packaging Market in Rest of the World, till 2035 (USD Billion)
  • Figure 20.1 Conclusion: Market Landscape
  • Figure 20.2 Conclusion: Partnerships and Collaborations
  • Figure 20.3 Conclusion: Funding and Investments
  • Figure 20.4 Conclusion: Demand Analysis
  • Figure 20.5 Conclusion: Market Forecast and Opportunity Analysis
目次
Product Code: RA100285

The Pharmaceutical Contract Manufacturing Market is valued at USD 99 billion in 2024 growing at a CAGR of 4.3% during the forecast period 2024-2035.

In the rapidly evolving pharmaceutical landscape, small molecule drugs continue to play a pivotal role in shaping innovation and development. Currently, small molecules account for 90% of all pharmaceutical drugs, even as biologics have gained more attention in recent years due to their ability to address a wide range of disorders. The sector has also seen a resurgence in the approval of novel small molecule drugs, with over 50 candidates receiving approval from the US FDA in 2020 alone. This trend has significantly boosted the demand for services provided by pharmaceutical contract research organizations (CROs).

It is important to note that the manufacturing of these novel drug candidates necessitates specialized facilities, advanced equipment, and operational expertise. Consequently, pharmaceutical companies may face challenges in conducting development and manufacturing operations independently. Additionally, the time and cost associated with establishing or acquiring manufacturing capabilities have driven both small and large pharmaceutical companies to increasingly outsource their manufacturing operations to contract manufacturing organizations (CMOs) and contract development and manufacturing organizations (CDMOs). The pressing need for safer and more effective drugs has further heightened the demand for contract manufacturing services.

Influenced by the desire for improved efficiency, traceability, and cost-effectiveness, pharmaceutical contract manufacturing is undergoing significant technological advancements. Outsourcing manufacturing operations to CMOs and CDMOs involves implementing specialized solutions to optimize production workflows, ensure regulatory compliance, and uphold product quality standards. Moreover, there is a growing focus on personalized medicine, which requires flexible manufacturing capabilities to cater to diverse patient needs. As pharmaceutical companies adapt to these evolving dynamics, the demand for advanced solutions tailored to the specific requirements of contract manufacturing services is anticipated to increase in the coming years.

Key Market Segments

Type of Product Manufactured

  • API & Intermediates

FDF

Type of API

  • Originator API
  • Generic API

API Potency

  • Low Potent API
  • High Potent API

Type of FDF

  • Originator FDF
  • Generic FDF

Dosage Form

  • Oral Solids
  • Liquids
  • Emulsions
  • Other Dosage Forms

Type of Packaging Offered

  • Bottles
  • Blisters
  • Parenteral
  • Others

Scale of Operation

  • Small Companies
  • Mid-sized Companies
  • Large and Very Large Companies

Type of End-user

  • Oral Solids
  • Liquids
  • Emulsions
  • Other Dosage Forms

Key Geographical Regions

  • North America
  • Europe
  • Asia-Pacific
  • Latin America
  • Middle East and North Africa

Research Coverage:

  • This report provides a comprehensive look at pharmaceutical packaging, including various types and their features, as well as sustainable packaging options. It also explores the regulatory framework, benefits, and challenges of sustainable packaging, emphasizing the need for adoption and highlighting future perspectives and opportunities.
  • A general overview of contract manufacturing services, highlighting details on different types of third-party manufacturers. It also features evolution of global pharmaceutical contract manufacturing market. Further, it provides information on the recent CDMO trends, along the opportunities and future perspectives.
  • A detailed discussion on various guidelines laid down by major regulatory bodies, across different countries, featuring an elaborative assessment of over 420 CMOs in pharmaceutical contract manufacturing industry, along with information on their operational approvals, certifications received, and relative popularity of the key regulatory body. Additionally, the chapter features an insightful multi-dimensional bubble analysis, presenting a comparison of the current regulatory scenario in key geographies.
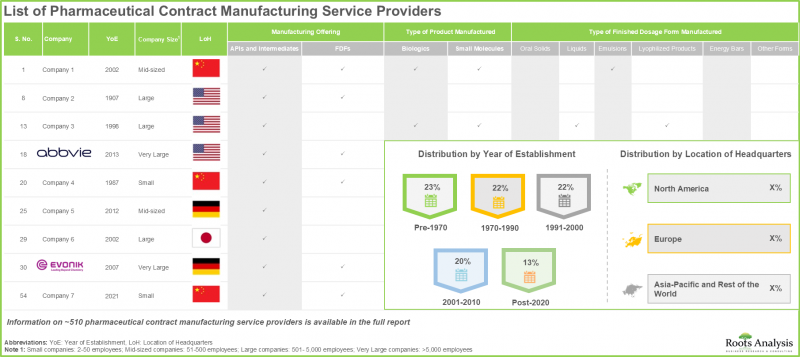
  • An overview of the current market landscape of companies engaged in offering contract manufacturing services for small molecules, including a detailed analysis based on several relevant parameters, such as year of establishment, company size (based on number of employees), location of headquarters, location of manufacturing facility, type of manufacturer (CDMO and CMO), product manufacturing capability (API & Intermediates and FDF), type of services offered (pre-formulation development, formulation development, method / analytical / process / assay development, scale-up, fill-finish / packaging and labelling and regulatory support), type of finished dosage form manufactured (oral solid, liquids, emulsions and lyophilized products), type of packaging offered (blister packaging, tubes, vials / cartridges, ampoules, sachets / pouches / bags, inhalers / nasal sprays, glass / plastic bottles / dropper bottles and prefilled syringes / autoinjectors / pen injectors) and scale of operation (preclinical, clinical and commercial).
  • A detailed regional capability of pharmaceutical contract manufacturing facilities in different regions (North America, Europe, Asia-Pacific and Rest of the World) across the globe.
  • Elaborate profiles of key contract manufacturers in the pharmaceutical contract manufacturing market. Each profile features a brief overview of the pharmaceutical contract manufacturing companies, along with information on location of headquarters, year of establishment, number of employees, leadership team, manufacturing portfolio, financial information, recent developments, and an informed future outlook.
  • A brief description of companies in pharmaceutical contract manufacturing. Each profile features a brief description of the company overview, along with information on the manufacturing portfolio.
  • A qualitative analysis highlighting various factors that need to be taken into consideration by pharmaceutical drug developers, while deciding whether to manufacture their respective products in-house or engage the services of a CMO.
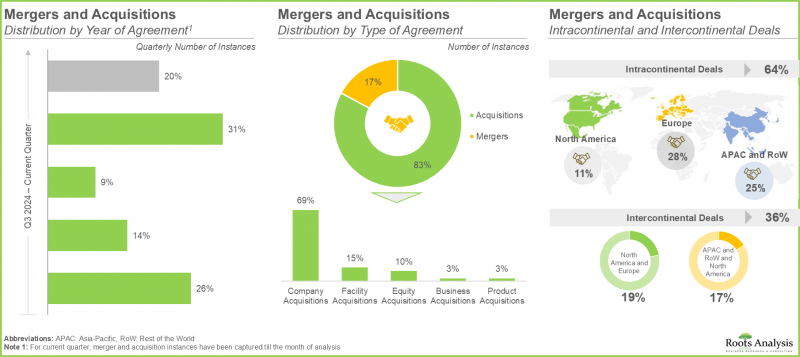
  • A detailed analysis of the various mergers and acquisitions in this domain since 2017, based on several relevant parameters, such as year of agreement, type of agreement, key value drivers of the deal, most active players (in terms of number of agreements signed) and geographical location of the companies. In addition, the chapter provides information on the financial terms of the deals (if available) in order to enumerate the deal multiples (in terms of annual revenues of the acquired firm (at the time of acquisition) and years of experience in this domain).
  • A detailed analysis of acquisitions that have taken place in the pharmaceutical contract manufacturing domain, taking into consideration the historical trend of the activity of players that have acquired other firms since 2017, and offering a means for other industry stakeholders to identify potential acquisition targets. The primary purpose of this analysis was to develop a better understanding of the overall potential and capabilities of companies involved in this domain, that are likely to be acquired in the recent future.
  • An estimate of the overall installed capacity for the manufacturing of pharmaceuticals, based on information reported by various industry stakeholders in the public domain, highlighting the distribution of the available capacity, based on size of manufacturer (small, mid-sized, and large and very large) and geography (North America, Europe, Asia-Pacific and Rest of the World).
  • An informed estimate of the annual clinical and commercial demand for small molecule drugs, across key geographical regions.
  • An in-depth analysis of the factors that can impact the growth of the global pharmaceutical contract manufacturing market. It also features identification and analysis of key drivers, potential restraints, emerging opportunities, and existing challenges.
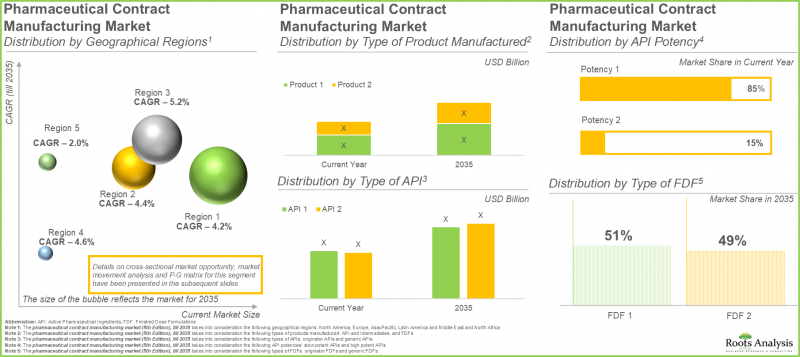
  • A detailed estimate of the current market size and the future growth potential of the pharmaceutical contract manufacturing market over the next decade. Based on multiple parameters, such as likely adoption trends and through reliable secondary and primary validations, we have provided an informed estimate on the market evolution during the forecast period 2024-2035. The report also features the likely distribution of the current and forecasted opportunity within the pharmaceutical contract manufacturing industry. Further, in order to account for future uncertainties and to add robustness to our model, we have provided three forecast scenarios, namely conservative, base, and optimistic scenarios, representing different tracks of the pharmaceutical contract manufacturing market growth.
  • Detailed projections of the current and future opportunity for contract manufacturers in the pharmaceutical CMO market across various types of products manufactured, such as API & Intermediates and FDF.
  • Detailed projections of the current and future opportunity for contract manufacturers in the pharmaceutical contract manufacturing industry across various types of API, such as generic API and originator API.
  • Detailed projections of the current and future opportunity for contract manufacturers in the pharmaceutical contract manufacturing industry across types of API by potency, such as low potent API and high potent API.
  • Detailed projections of the current and future opportunity for contract manufacturers in the pharmaceutical contract manufacturing market across various types of FDF, such as generic FDF and originator FDF.
  • Detailed projections of the current and future opportunity for contract manufacturers in the pharmaceutical CMO market across different types of dosage form offered, such as oral solids, liquids, emulsions, and other dosage forms.
  • Detailed projections of the current and future opportunity for contract manufacturers in the pharmaceutical contract manufacturing market across different type of packaging, such as bottles, blisters, parenteral and others.
  • Detailed projections of the current and future opportunity for contract manufacturers in the pharmaceutical contract manufacturing industry across different type of end-users, such as small, mid-sized and large and very large companies.
  • Detailed projections of the current and future opportunity for contract manufacturers in the pharmaceutical contract manufacturing market across scales of operation, including clinical and commercial.
  • Detailed projections of the current and future opportunity for contract manufacturers in the pharmaceutical contract manufacturing market across key geographical regions, such as North America, Europe, Asia-Pacific, Latin America and Middle East and North Africa.
  • Detailed list of the current pharmaceutical contract manufacturing market across leading players.
  • A case study highlighting a comparison of the key characteristics of large and small molecule drugs, along with information on the steps involved in their respective manufacturing processes.

Key Benefits of Buying this Report

  • The report offers market leaders and newcomers valuable insights into revenue estimations for both the overall market and its sub-segments.
  • Stakeholders can utilize the report to enhance their understanding of the competitive landscape, allowing for improved business positioning and more effective go-to-market strategies.
  • The report provides stakeholders with a pulse on the Pharmaceutical Contract Manufacturing Market, furnishing them with essential information on significant market drivers, barriers, opportunities, and challenges.

Leading Market Companies

  • AMRI Global
  • Altasciences
  • Cambrex
  • Catalent
  • DPT Laboratories
  • Aenova
  • Almac
  • Corden Pharma
  • Fresenius Kabi
  • Glatt
  • Hovione
  • Recipharm
  • Siegfried
  • CMIC Group
  • Nectar Lifesciences
  • Syngene
  • WuXi AppTec

TABLE OF CONTENTS

1. PREFACE

  • 1.1. Introduction
  • 1.2. Market Share Insights
  • 1.3. Key Market Insights
  • 1.4. Report Coverage
  • 1.5. Key Questions Answered
  • 1.6. Chapter Outlines

2. RESEARCH METHODOLOGY

  • 2.1. Chapter Overview
  • 2.2. Research Assumptions
  • 2.3. Project Methodology
  • 2.4. Forecast Methodology
  • 2.5. Robust Quality Control
  • 2.6. Key Considerations
    • 2.6.1. Demographics
    • 2.6.2. Economic Factors
    • 2.6.3. Government Regulations
    • 2.6.4. Supply Chain
    • 2.6.5. COVID Impact / Related Factors
    • 2.6.6. Market Access
    • 2.6.7. Healthcare Policies
    • 2.6.8. Industry Consolidation
  • 2.7. Key Market Segmentations

3. ECONOMIC AND OTHER PROJECT SPECIFIC CONSIDERATIONS

  • 3.1. Chapter Overview
  • 3.2. Market Dynamics
    • 3.2.1. Time Period
      • 3.2.1.1. Historical Trends
      • 3.2.1.2. Current and Forecasted Estimates
    • 3.2.2. Currency Coverage
      • 3.2.2.1. Overview of Major Currencies Affecting the Market
      • 3.2.2.2. Impact of Currency Fluctuations on the Industry
    • 3.2.3. Foreign Exchange Impact
      • 3.2.3.1. Evaluation of Foreign Exchange Rates and Their Impact on Market
      • 3.2.3.2. Strategies for Mitigating Foreign Exchange Risk
    • 3.2.4. Recession
      • 3.2.4.1. Historical Analysis of Past Recessions and Lessons Learnt
      • 3.2.4.2. Assessment of Current Economic Conditions and Potential Impact on the Market
    • 3.2.5. Inflation
      • 3.2.5.1. Measurement and Analysis of Inflationary Pressures in the Economy
      • 3.2.5.2. Potential Impact of Inflation on the Market Evolution

4. EXECUTIVE SUMMARY

5. INTRODUCTION

  • 5.1. Chapter Overview
  • 5.2. Types of Third-party Manufacturers
  • 5.3. Overview of Pharmaceutical Contract Manufacturing
  • 5.4. Evolution of Pharmaceutical Contract Manufacturing
    • 5.4.1. Traditional Pharmaceutical CMOs
  • 5.5. Need for Outsourcing in the Pharmaceutical Industry
  • 5.6. Services Offered by CMOs
  • 5.7. Key Considerations While Selecting a CMO
  • 5.8. Risks and Challenges Associated with Outsourcing Pharmaceutical Manufacturing Operations
  • 5.9. Recent Developments in the Pharmaceutical Contract Manufacturing Industry
    • 5.9.1. Integration of Artificial Intelligence
    • 5.9.2. Strategic Partnerships and Collaborations
      • 5.9.2.1. Strategic Long-Term Alliance
      • 5.9.2.2. Flexible Short-Term Partnership Agreements
    • 5.9.3. Integrated End-to-End Business Model
    • 5.9.4. Dependence on Software Service Providers
  • 5.10. Future Perspectives

6. PHARMACEUTICAL CMOs: REGULATORY LANDSCAPE

  • 6.1. Chapter Overview
  • 6.2. Regulatory Guidelines in North America
    • 6.2.1. Landscape in the US
    • 6.2.2. Landscape in Canadian
  • 6.3. Regulatory Guidelines in Europe
  • 6.4. Regulatory Guidelines in Asia-Pacific and Rest of the World
    • 6.4.1. Landscape in China
    • 6.4.2. Landscape in India
    • 6.4.3. Landscape in Japan
    • 6.4.4. Landscape in South Korea
    • 6.4.5 Landscape in Australia
    • 6.4.6. Landscape in Brazil
  • 6.5. Analysis of Pharmaceutical CMOs by Approval Received from Regulatory Authorities
  • 6.6. Regulatory Landscape: Regional Benchmarking Analysis

7. PHARMACEUTICAL CMOs: MARKET LANDSCAPE

  • 7.1. Chapter Overview
  • 7.2. Pharmaceutical CMOs: List of Companies
    • 7.2.1. Analysis by Year of Establishment
    • 7.2.2. Analysis by Company Size
    • 7.2.3. Analysis by Location of Headquarters
    • 7.2.4. Analysis by Location of Manufacturing Facility
    • 7.2.5. Analysis by Product Manufacturing Capability
    • 7.2.6. Analysis by Type of Product Manufactured
    • 7.2.7. Analysis by Type of Service Offered
    • 7.2.8. Analysis by Type of Finished Dosage Form Manufactured
    • 7.2.9. Analysis by Type of Packaging Offered
    • 7.2.10. Analysis by Scale of Operation

8. REGIONAL CAPABILITY

  • 8.1. Chapter Overview
  • 8.2. Key Assumptions and Methodology
  • 8.3. Overall Landscape of Pharmaceutical Contract Manufacturing Facilities
    • 8.3.1. Pharmaceutical Contract Manufacturing Facilities in North America
    • 8.3.2. Pharmaceutical Contract Manufacturing Facilities in Europe
    • 8.3.3. Pharmaceutical Contract Manufacturing Facilities in Asia-Pacific
    • 8.3.4. Pharmaceutical Contract Manufacturing Facilities in Rest of the World

9. COMPANY PROFILES

  • 9.1. Chapter Overview
  • 9.2. Pharmaceutical CMOs based in North America
    • 9.2.1. AMRI Global
      • 9.2.1.1. Company Overview
      • 9.2.1.2. Service Portfolio
      • 9.2.1.3. Recent Developments and Future Outlook
    • 9.2.2. Altasciences
      • 9.2.2.1. Company Overview
      • 9.2.2.2. Service Portfolio
      • 9.2.2.3. Recent Developments and Future Outlook
    • 9.2.3. Cambrex
      • 9.2.3.1. Company Overview
      • 9.2.3.2. Service Portfolio
      • 9.2.3.3. Recent Developments and Future Outlook
    • 9.2.4. Catalent
      • 9.2.4.1. Company Overview
      • 9.2.4.2. Financial Information
      • 9.2.4.3. Service Portfolio
      • 9.2.4.4. Recent Developments and Future Outlook
    • 9.2.5. DPT Laboratories
      • 9.2.5.1. Company Overview
      • 9.2.5.2. Service Portfolio
      • 9.2.5.3. Recent Developments and Future Outlook
  • 9.3. Pharmaceutical CMOs based in Europe
    • 9.3.1. Aenova
      • 9.3.1.1. Company Overview
      • 9.3.1.2. Financial Information
      • 9.3.1.3. Service Portfolio
      • 9.3.1.4. Recent Developments and Future Outlook
    • 9.3.2. Almac
      • 9.3.2.1. Company Overview
      • 9.3.2.2. Financial Information
      • 9.3.2.3. Service Portfolio
      • 9.3.2.4. Recent Developments and Future Outlook
    • 9.3.3. CordenPharma
      • 9.3.3.1. Company Overview
      • 9.3.3.2. Service Portfolio
      • 9.3.3.3. Recent Developments and Future Outlook
    • 9.3.4. Fresenius Kabi
      • 9.3.4.1. Company Overview
      • 9.3.4.2. Financial Information
      • 9.3.4.3. Service Portfolio
      • 9.3.4.4. Recent Developments and Future Outlook
    • 9.3.5. Glatt
      • 9.3.5.1. Company Overview
      • 9.3.5.2. Service Portfolio
      • 9.3.5.3. Recent Developments and Future Outlook
    • 9.3.6. Hovione
      • 9.3.6.1. Company Overview
      • 9.3.6.2. Service Portfolio
      • 9.3.6.3. Recent Developments and Future Outlook
    • 9.3.7. Recipharm
      • 9.3.7.1. Company Overview
      • 9.3.7.2. Financial Information
      • 9.3.7.3. Service Portfolio
      • 9.3.7.4. Recent Developments and Future Outlook
    • 9.3.8. Siegfried
      • 9.3.8.1. Company Overview
      • 9.3.8.2. Financial Information
      • 9.3.8.3. Service Portfolio
      • 9.3.8.4. Recent Developments and Future Outlook
  • 9.4. Pharmaceutical CMOs based in Asia-Pacific and Rest of the World
    • 9.4.1. CMIC Group
      • 9.4.1.1. Company Overview
      • 9.4.1.2. Financial Information
      • 9.4.1.3. Service Portfolio
      • 9.4.4.4. Recent Developments and Future Outlook
    • 9.4.2. Nectar Lifesciences
      • 9.4.2.1. Company Overview
      • 9.4.2.2. Financial Information
      • 9.4.2.3. Service Portfolio
      • 9.4.2.4. Recent Developments and Future Outlook
    • 9.4.3. Syngene
      • 9.4.3.1. Company Overview
      • 9.4.3.2. Financial Information
      • 9.4.3.3. Service Portfolio
      • 9.4.3.4. Recent Developments and Future Outlook
    • 9.4.4. WuXi AppTec
      • 9.4.4.1. Company Overview
      • 9.4.4.2. Financial Information
      • 9.4.4.3. Service Portfolio
      • 9.4.4.4. Recent Developments and Future Outlook

10. SHORT PROFILES

  • 10.1. Chapter Overview
  • 10.2. Players based in North America
    • 10.2.1. Albemarle
    • 10.2.2. Baxter
    • 10.2.3. Patheon
    • 10.2.4. West Pharmaceutical Services
  • 10.3. Players based in Europe
    • 10.3.1. Eurofins Scientific
    • 10.3.2. Evonik
    • 10.3.3. Fareva
    • 10.3.4. GlaxoSmithKline
    • 10.3.5. Lonza
  • 10.4. Players based in Asia-Pacific and Rest of the World
    • 10.4.1. Alkem Laboratories
    • 10.4.2. Aspen Pharmacare
    • 10.4.3. MSN Laboratories
    • 10.4.4. Teva Pharmaceuticals
    • 10.4.5. UBE Corporation

11. MAKE VERSUS BUY DECISION FRAMEWORK

  • 11.1. Chapter Overview
  • 11.2. Assumptions and Key Parameters
  • 11.3. Pharmaceutical Contract Manufacturers: Make versus Buy Decision Making
    • 11.3.1. Scenario 1
    • 11.3.2. Scenario 2
    • 11.3.3. Scenario 3
    • 11.3.4. Scenario 4
  • 11.4. Concluding Remarks

12. MERGERS AND ACQUISITIONS

  • 12.1. Chapter Overview
  • 12.2. Merger and Acquisition Models
  • 12.3. Pharmaceutical Contract Manufacturing: Mergers and Acquisitions
    • 12.3.1. Analysis by Year of Agreement
    • 12.3.2. Analysis by Type of Agreement
    • 12.3.3. Analysis by Type of Acquisition
    • 12.3.4. Analysis by Focus Area
    • 12.3.5. Analysis by Type of Business Segment
    • 12.3.6. Analysis by Type of Service Offered
    • 12.3.7. Analysis by Scale of Operation
    • 12.3.8. Analysis by Geography
    • 12.3.9. Analysis by Location of Manufacturing Facility
    • 12.3.10. Analysis by Key Value Drivers
    • 12.3.11. Analysis by Year of Acquisition and Key Value Drivers
    • 12.3.12. Most Active Acquirers: Analysis by Number of Acquisitions
  • 12.4. Key Acquisitions: Analysis by Deal Multiples

13. RECENT EXPANSIONS

  • 13.1. Chapter Overview
  • 13.2. Type of Expansions
  • 13.3. Pharmaceutical CMOs: Recent Expansions
    • 13.3.1. Analysis by Year of Expansion
    • 13.3.2. Analysis by Type of Expansion
    • 13.3.3. Analysis by Purpose of Expansion
    • 13.3.4. Analysis by Year and Purpose of Expansion
    • 13.3.5. Analysis by Type of Business Segment
    • 13.3.6. Analysis by Type of API Manufactured
    • 13.3.7. Analysis by Type of Service Offered
    • 13.3.8. Analysis by Scale of Operation
    • 13.3.9. Analysis by Capital Invested
    • 13.3.10. Analysis by Location of Headquarters
    • 13.3.11. Analysis by Location of Manufacturing Facility
    • 13.3.12. Most Active Players: Analysis by Number of Recent Expansions

14. CAPACITY ANALYSIS

  • 14.1. Chapter Overview
  • 14.2. Key Assumptions and Methodology
  • 14.3. Pharmaceutical Contract Manufacturing: Global Production Capacity
    • 14.3.1. Analysis by Company Size
    • 14.3.2. Analysis by Scale of Operation
    • 14.3.3. Analysis by Location of Headquarters
    • 14.3.4. Analysis by Location of Manufacturing Facilities
      • 14.3.4.1. Pharmaceutical Contract Manufacturing Capacity in North America
      • 14.3.4.2. Pharmaceutical Contract Manufacturing Capacity in Europe
      • 14.3.4.3. Pharmaceutical Contract Manufacturing Capacity in Asia-Pacific
  • 14.4. Concluding Remarks

15. DEMAND ANALYSIS

  • 15.1. Chapter Overview
  • 15.2. Key Assumptions and Methodology
    • 15.2.1. Overall Annual Demand for Small Molecule APIs, 2024-2035
    • 15.2.2. Annual Commercial Demand for Small Molecule APIs: Distribution by Geography, 2024 and 2035
      • 15.2.2.1. Annual Commercial Demand for Small Molecule APIs in North America, 2024-2035
      • 15.2.2.2. Annual Commercial Demand for Small Molecule APIs in Europe, 2024-2035
      • 15.2.2.3. Annual Commercial Demand for Small Molecule APIs in Asia-Pacific, 2024-2035
      • 15.2.2.4. Annual Commercial Demand for Small Molecule APIs in Rest of the World, 2024-2035
    • 15.2.3. Annual Clinical Demand for Small Molecule APIs: Distribution by Trial Phase, 2024 and 2035
      • 15.2.3.1. Annual Clinical Demand for Small Molecule APIs in Phase I Trials, 2024-2035
      • 15.2.3.2. Annual Clinical Demand for Small Molecule APIs in Phase II Trials, 2024-2035
      • 15.2.3.3. Annual Clinical Demand for Small Molecule APIs in Phase III Trials, 2024-2035
  • 15.3. Annual Demand vs Capacity

16. MARKET IMPACT ANALYSIS: DRIVERS, RESTRAINTS, OPPORTUNITIES AND CHALLENGES

  • 16.1. Chapter Overview
  • 16.2. Market Drivers
  • 16.3. Market Restraints
  • 16.4. Market Opportunities
  • 16.5. Market Challenges
  • 16.6. Conclusion

17. GLOBAL PHARMACEUTICAL CONTRACT MANUFACTURING MARKET

  • 17.1. Chapter Overview
  • 17.2. Assumptions and Methodology
  • 17.3. Global Pharmaceutical Contract Manufacturing Market, Historical Trends (2017-2023) and Forecasted Estimates (2024-2035)
    • 17.3.1. Scenario Analysis
      • 17.3.1.1. Conservative Scenario
      • 17.3.1.2. Optimistic Scenario
  • 17.4. Key Market Segments

18. PHARMACEUTICAL CONTRACT MANUFACTURING MARKET, BY TYPE OF PRODUCT MANUFACTURED

  • 18.1. Chapter Overview
  • 18.2. Key Assumptions and Methodology
  • 18.3. Pharmaceutical Contract Manufacturing Market: Distribution by Type of Product Manufactured, 2024 and 2035
    • 18.3.1. Pharmaceutical Contract Manufacturing Market for API and Intermediates: Historical Trends (2017-2023) and Forecasted Estimates (2024-2035)
    • 18.3.2. Pharmaceutical Contract Manufacturing Market for FDF: Historical Trends (2017-2023) and Forecasted Estimates (2024-2035)
  • 18.4. Data Triangulation and Validation

19. PHARMACEUTICAL API CONTRACT MANUFACTURING MARKET, BY TYPE OF API

  • 19.1. Chapter Overview
  • 19.2. Key Assumptions and Methodology
  • 19.3. Pharmaceutical API Contract Manufacturing Market: Distribution by Type of API, 2024 and 2035
    • 19.3.1. Pharmaceutical API Contract Manufacturing Market for Generic API: Historical Trends (2017-2023) and Forecasted Estimates (2024-2035)
    • 19.3.2. Pharmaceutical API Contract Manufacturing Market for Originator API: Historical Trends (2017-2023) and Forecasted Estimates (2024-2035)
  • 19.4. Data Triangulation and Validation

20. PHARMACEUTICAL API CONTRACT MANUFACTURING MARKET, BY API POTENCY

  • 20.1. Chapter Overview
  • 20.2. Key Assumptions and Methodology
  • 20.3. Pharmaceutical API Contract Manufacturing Market: Distribution by API Potency, 2024 and 2035
    • 20.3.1. Pharmaceutical API Contract Manufacturing Market for Low Potent API: Historical Trends (2017-2023) and Forecasted Estimates (2024-2035)
    • 20.3.2. Pharmaceutical API Contract Manufacturing Market for High Potent API: Historical Trends (2017-2023) and Forecasted Estimates (2024-2035)
  • 20.4. Data Triangulation and Validation

21. PHARMACEUTICAL FDF CONTRACT MANUFACTURING MARKET, BY TYPE OF FDF

  • 21.1. Chapter Overview
  • 21.2. Key Assumptions and Methodology
  • 21.3. Pharmaceutical FDF Contract Manufacturing Market: Distribution by Type of FDF, 2024 and 2035
    • 21.3.1. Pharmaceutical FDF Contract Manufacturing Market for Generic FDF: Historical Trends (2017-2023) and Forecasted Estimates (2024-2035)
    • 21.3.2. Pharmaceutical FDF Contract Manufacturing Market for Originator FDF: Historical Trends (2017-2023) and Forecasted Estimates (2024-2035)
  • 21.4. Data Triangulation and Validation

22. PHARMACEUTICAL FDF CONTRACT MANUFACTURING MARKET, BY DOSAGE FORM

  • 22.1. Chapter Overview
  • 22.2. Key Assumptions and Methodology
  • 22.3. Pharmaceutical FDF Contract Manufacturing Market: Distribution by Dosage Form, 2024 and 2035
    • 22.3.1. Pharmaceutical FDF Contract Manufacturing Market for Oral Solids: Historical Trends (2017-2023) and Forecasted Estimates (2024-2035)
    • 22.3.2. Pharmaceutical FDF Contract Manufacturing Market for Liquids: Historical Trends (2017-2023) and Forecasted Estimates (2024-2035)
    • 22.3.3. Pharmaceutical FDF Contract Manufacturing Market for Emulsions: Historical Trends (2017-2023) and Forecasted Estimates (2024-2035)
    • 22.3.4. Pharmaceutical FDF Contract Manufacturing Market for Other Dosage Forms: Historical Trends (2017-2023) and Forecasted Estimates (2024-2035)
  • 22.4. Data Triangulation and Validation

23. PHARMACEUTICAL CONTRACT MANUFACTURING MARKET, BY TYPE OF PACKAGING OFFERED

  • 23.1. Chapter Overview
  • 23.2. Key Assumptions and Methodology
  • 23.3. Pharmaceutical Contract Manufacturing Market: Distribution by Type of Packaging Offered, 2024 and 2035
    • 23.3.1. Pharmaceutical Contract Manufacturing Market for Bottles: Historical Trends (2017-2023) and Forecasted Estimates (2024-2035)
    • 23.3.2. Pharmaceutical Contract Manufacturing Market for Blisters: Historical Trends (2017-2023) and Forecasted Estimates (2024-2035)
    • 23.3.3. Pharmaceutical Contract Manufacturing Market for Parenteral: Historical Trends (2017-2023) and Forecasted Estimates (2024-2035)
    • 23.3.4. Pharmaceutical Contract Manufacturing Market for Others: Historical Trends (2017-2023) and Forecasted Estimates (2024-2035)
  • 23.4. Data Triangulation and Validation

24. PHARMACEUTICAL CONTRACT MANUFACTURING MARKET, BY END-USERS

  • 24.1. Chapter Overview
  • 24.2. Key Assumptions and Methodology
  • 24.3. Pharmaceutical Contract Manufacturing Market: Distribution by End-users, 2024 and 2035
    • 24.3.1. Pharmaceutical Contract Manufacturing Market for Small Companies: Historical Trends (2017-2023) and Forecasted Estimates (2024-2035)
    • 24.3.2. Pharmaceutical Contract Manufacturing Market for Mid-sized Companies: Historical Trends (2017-2023) and Forecasted Estimates (2024-2035)
    • 24.3.3. Pharmaceutical Contract Manufacturing Market for Large and Very Large Companies: Historical Trends (2017-2023) and Forecasted Estimates (2024-2035)
  • 24.4. Data Triangulation and Validation

25. PHARMACEUTICAL CONTRACT MANUFACTURING MARKET, BY SCALE OF OPERATION

  • 25.1. Chapter Overview
  • 25.2. Key Assumptions and Methodology
  • 25.3. Pharmaceutical Contract Manufacturing Market: Distribution by Scale of Operation, 2024 and 2035
    • 25.3.1. Pharmaceutical Contract Manufacturing Market for Clinical: Historical Trends (2017-2023) and Forecasted Estimates (2024-2035)
    • 25.3.2. Pharmaceutical Contract Manufacturing Market for Commercial: Historical Trends (2017-2023) and Forecasted Estimates (2024-2035)
  • 25.4. Data Triangulation and Validation

26. PHARMACEUTICAL CONTRACT MANUFACTURING MARKET, BY KEY GEOGRAPHICAL REGIONS

  • 26.1. Chapter Overview
  • 26.2. Key Assumptions and Methodology
  • 26.3. Pharmaceutical Contract Manufacturing Market: Distribution by Key Geographical Regions, 2024 and 2035
    • 26.3.1. Pharmaceutical Contract Manufacturing Market in North America: Historical Trends (2017-2023) and Forecasted Estimates (2024-2035)
    • 26.3.2. Pharmaceutical Contract Manufacturing Market in Europe: Historical Trends (2017-2023) and Forecasted Estimates (2024-2035)
    • 26.3.3. Pharmaceutical Contract Manufacturing Market in Asia-Pacific: Historical Trends (2017-2023) and Forecasted Estimates (2024-2035)
    • 26.3.4. Pharmaceutical Contract Manufacturing Market in Latin America: Historical Trends (2017-2023) and Forecasted Estimates (2024-2035)
    • 26.3.5. Pharmaceutical Contract Manufacturing Market in Middle East and North Africa: Historical Trends (2017-2023) and Forecasted Estimates (2024-2035)
  • 26.4. Data Triangulation and Validation

27. PHARMACEUTICAL CONTRACT MANUFACTURING MARKET, BY LEADING PLAYERS

  • 27.1. Chapter Overview
  • 27.2. Key Assumptions and Methodology
  • 27.3. Pharmaceutical Contract Manufacturing Market, by Leading Players
  • 27.4. Data Triangulation and Validation

28. CASE STUDY: COMPARISON OF SMALL AND LARGE MOLECULES DRUGS / THERAPIES

  • 28.1. Chapter Overview
  • 28.2. Small Molecule and Large Molecule Drugs / Therapies
    • 28.2.1. Comparison of General Characteristics
    • 28.2.2. Comparison of Key Specifications
    • 28.2.3. Comparison of Manufacturing Processes
    • 28.2.4. Comparison of Key Manufacturing-related Challenges

29. CONCLUDING REMARKS

30. EXECUTIVE INSIGHTS

  • 30.1. Chapter Overview
  • 30.2. Ajinomoto Althea
    • 30.2.1. Company Snapshot
    • 30.2.2. Interview Transcript: Scott Goldstein, Former Director of Business Development
  • 30.3. Bachem
    • 30.3.1. Company Snapshot
    • 30.3.2. Interview Transcript: Thomas Fruh, Former Chief Executive Officer
  • 30.4. CiVentiChem
    • 30.4.1. Company Snapshot
    • 30.4.2. Interview Transcript: Bhaskar VenePalli, President and Chief Executive Officer
  • 30.5. CordenPharma
    • 30.5.1. Company Snapshot
    • 30.5.2. Interview Transcript: Roberto Margartia, Digitalization and Artificial Intelligence Manager
  • 30.6. Helsinn Group
    • 30.6.1. Company Snapshot
    • 30.6.2. Interview Transcript: Allison Vavala, Former Director, Commercial Development
  • 30.7. Novasep
    • 30.7.1. Company Snapshot
    • 30.7.2. Interview Transcript: Kevin Daley, Former Director, Pharmaceuticals Marketing
  • 30.8. Sovereign Pharma
    • 30.8.1. Company Snapshot
    • 30.8.2. Interview Transcript: Piyush Desai, Director, Operations
  • 30.9. Wavelength Pharmaceuticals
    • 30.9.1. Company Snapshot
    • 30.9.2. Interview Transcript: Ilan Avni, Former Vice President Business Development, Marketing, and IP

31. APPENDIX I: TABULATED DATA

32. APPENDIX II: LIST OF COMPANIES AND ORGANIZATIONS