
|
市場調査レポート
商品コード
1869576
マイクロバイオーム製造市場:2035年までの業界動向と世界の予測 - 製造される製品タイプ別、製剤別、使用される一次包装タイプ別、事業規模別、企業規模別、主要地域別Microbiome Manufacturing Market: Industry Trends and Global Forecasts, Till 2035 - Distribution by Product Manufactured, Formulation, Primary Packaging Used, Scale of Operation, Company Size, Key Geographical Regions and Leading Developers |
||||||
カスタマイズ可能
|
|||||||
| マイクロバイオーム製造市場:2035年までの業界動向と世界の予測 - 製造される製品タイプ別、製剤別、使用される一次包装タイプ別、事業規模別、企業規模別、主要地域別 |
|
出版日: 2025年11月16日
発行: Roots Analysis
ページ情報: 英文 397 Pages
納期: 即日から翌営業日
|

概要
マイクロバイオーム製造市場:概要
Roots Analysisの調査によると、世界のマイクロバイオーム製造の市場規模は、現在の4,060万米ドルから2035年までに1億8,670万米ドルへ成長し、予測期間(2035年まで)におけるCAGRは14.9%と推定されています。
市場規模および機会分析は、以下のパラメータに基づいて分類されています。
製造される製品タイプ
- API
- FDF
製剤タイプ
- 固形
- 液体
- その他
使用される一次包装タイプ
- ブリスター包装
- ガラス/プラスチック製ボトル
- 袋/ サシェ
- バイアル
事業規模
- 臨床
- 商業
企業規模
- 小規模
- 中規模
- 大企業および超大企業
主要地域
- 北米
- 欧州
- アジア太平洋
- その他の地域
マイクロバイオーム製造市場:成長と動向
人体には、有益な種と有害な種の両方を包含する多くの微生物群集が存在し、これらは総称して「微生物叢(マイクロバイオータ)」と呼ばれます。同様に、宿主システム内に生息する共生微生物、共生微生物、病原性微生物の生態系は「マイクロバイオーム」と呼ばれます。微生物叢が疾患の発症や病態形成に及ぼす影響を考慮すると、マイクロバイオームを標的とした治療法の概念は、医学研究コミュニティの注目を集めつつあります。
マイクロバイオームに基づく治療法は、肥満、糖尿病、免疫系障害、消化器系または胃腸障害など、様々な疾患に対して効果的かつ代替的な治療選択肢を提供します。マイクロバイオームを基盤とする生体治療製品(LBPs)とは、細菌や酵母などの生きた微生物を含む製剤であり、腸内マイクロバイオームを回復・調節・強化することで疾患の治療や予防を目的としています。特筆すべきは、現在165件以上の臨床試験が世界各地で進行中であり、多様なマイクロバイオーム治療製品の探索が行われている点です。この動向は、利害関係者がこの分野で大規模な開発努力を推進していることを示しています。
しかしながら、マイクロバイオームベースの治療薬の製造には、開発期間の長期化、厳格な温度管理要件、多様な好気性/嫌気性菌株(微生物の種類による)の複雑なエンジニアリング、最終製品の品質特性に関する不均一性など、いくつかの複雑な課題が伴います。製造能力の不足も、腸内マイクロバイオーム菌株を開発する企業にとって懸念事項です。過去数年間、一部の企業は自社製造能力を確立することでこの課題を回避してきました。とはいえ、新たな自社製造施設の設立に投資する前に、概念実証データを求める企業も依然として存在します。こうした企業は現在、生きたマイクロバイオーム療法の製造をCMO(受託製造業者)に委託しています。これにより、この分野で様々な能力を持つ少数の受託製造業者に大きな機会が生まれています。マイクロバイオームベース製品の製造最適化に向けた取り組みが継続する中、CMO市場は今後10年間で着実な成長が見込まれています。
マイクロバイオーム製造市場:主要な知見
当レポートは、マイクロバイオーム製造市場の現状を詳細に分析し、業界内の潜在的な成長機会を特定しています。主な調査結果は以下の通りです。
- 現在の市場情勢では、20社以上の確立された企業と新規参入企業が、契約ベースで生体治療薬製品の生産に携わっています。
- 利害関係者は、様々な規模の事業にわたる幅広いサービスを提供していると主張しています。完成医薬品のうち、比較的大きな割合が固形および液体の形態で製造されています。
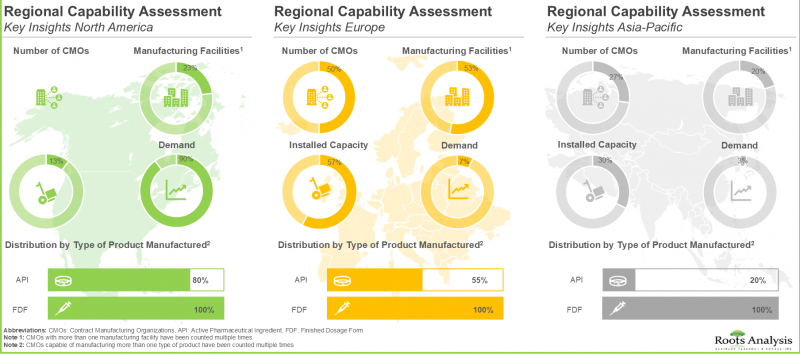
- 米国に自社製造施設を有する企業の大半(50%)は中規模企業であり、主に前臨床/臨床規模の生産能力を有しています。
- 過去10年間で、より多くの企業が欧州に製造施設を設立する動向が見られ、マイクロバイオーム製造市場では変化が観察されています。
- 競争優位性を獲得するため、業界の利害関係者は既存の能力を積極的に強化し、マイクロバイオームに特化したサービスポートフォリオの拡充に取り組んでいます。
- 需要の増加に対応するため、多くの受託製造企業は、相互に有益なパートナーシップの締結や生産能力の拡大といった戦略的取り組みを進めています。
- 現在、各地域で165件以上の臨床試験(登録患者数約22,000名)が進行中であり、マイクロバイオームベースの治療薬を調査しています。
- マイクロバイオーム受託製造メーカーは、今後もマイクロバイオーム治療薬の開発に携わる企業と戦略的提携を結び、その製品の受託製造を継続すると予想されます。
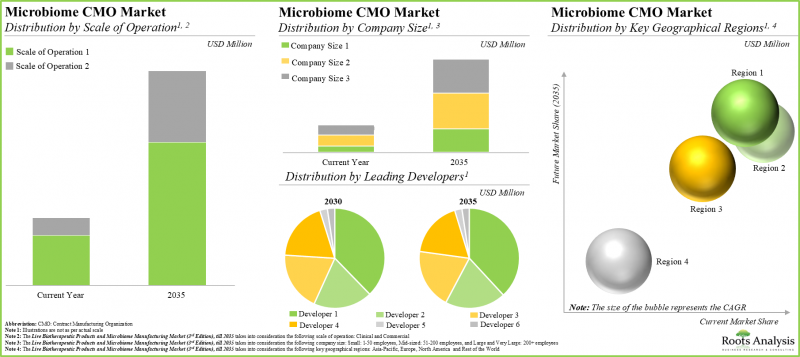
- 世界の受託製造設備容量は様々な地域に分散していますが、興味深いことに、総容量の約43%が小規模事業者が所有する施設に設置されています。
- 急速に拡大するパイプラインと効果的な治療介入への需要の高まりを踏まえ、マイクロバイオーム開発企業は最終製品の高品質を確保するため、受託製造業者の専門知識を活用することを好んでいます。
- より多くの開発者が自社医薬品製造業務の様々な側面を外部委託するにつれ、今後10年間でマイクロバイオーム受託製造市場は年率14.9%以上で成長すると予測されます。
マイクロバイオーム製造市場:主要セグメント
現在、APIがマイクロバイオーム製造市場で最大のシェアを占めています
製造される製品タイプ別では、市場はAPI(原薬)とFDF(完成医薬品)に区分されます。現時点では、APIセグメントがマイクロバイオーム製造市場の最大シェアを占めています。この動向は近い将来に変化する可能性は低いと考えられます。
製剤タイプ別では、市場は固形製剤、液剤、その他製剤に区分されます。現在、液剤がマイクロバイオーム製造市場で最大のシェアを占めています。この動向は今後数年間も継続する見込みです。
一次包装タイプ別では、市場はブリスターパック、ガラス/プラスチックボトル、サシェ/パウチ、バイアルに分類されます。特筆すべきは、現在サシェ/パウチがマイクロバイオーム製造市場でより大きなシェアを占めている点です。この動向は今後10年間も変わらない見込みです。
操業規模別では、市場は臨床規模と商業規模に区分されます。商業規模製造が市場全体の主要な牽引役となる一方、臨床規模におけるマイクロバイオーム製造市場は比較的高いCAGRで成長する可能性が高い点に注目すべきです。
企業規模別では、市場は小規模企業、中規模企業、大規模・超大規模企業に区分されます。現時点では、小規模企業がマイクロバイオーム製造市場で最大の収益を生み出しています。この傾向は近い将来に変化する可能性は低いと考えられます。
主要地域別では、市場は北米、欧州、アジア太平洋、世界のその他の地域に区分されます。現在のマイクロバイオーム製造市場の大部分は欧州が占めています。特筆すべきは、今後数年間で世界のその他の地域の市場がより高いCAGRで成長すると予想されている点です。
マイクロバイオーム製造市場の代表的な企業
- Biose
- BJP Laboratories
- Capsugel
- Chr. Hansen
- Infant Bacterial Therapeutics
- Inpac Probiotics
- MaaT Pharma
- Microbiomik Healthcare
- NIZO
- OxThera
- Rebiotix
- Seres Therapeutics
- WACKER
- Winclove
目次
第1章 序文
第1章 生体バイオ医薬品およびマイクロバイオーム製造市場概要
第2章 調査手法
第3章 経済的およびその他のプロジェクト特有の考慮事項
第4章 エグゼクティブサマリー
第5章 イントロダクション
- 章の概要
- ヒト微生物叢とマイクロバイオームの概念
- 腸内フローラの概要
- ヒトマイクロバイオームプロジェクト(HMP)
- マイクロバイオーム療法の概要
- マイクロバイオームベースの製品製造
- 適切なCMOパートナーを選択する際に考慮すべき重要な点
第6章 市場情勢
- 章の概要
- 生体バイオ医薬品およびマイクロバイオームの受託製造業者:市場情勢
- 生体バイオ医薬品およびマイクロバイオームの自社製造業者:市場情勢
第7章 地域能力分析
第8章 企業競争力分析
第9章 企業プロファイル
- 章の概要
- 北米の生体バイオ医薬品およびマイクロバイオームの受託製造業者
- Capsugel
- その他の企業
- Arranta Bio
- FUJIFILM Diosynth Biotechnologies
- List Biological Laboratories
- ProbioFerm
- 欧州の生体バイオ医薬品およびマイクロバイオームの受託製造業者
- Biose Industrie
- Cerbios-Pharma
- Chr. Hansen
- Inpac Probiotics
- NIZO
- WACKER
- Winclove Probiotics
- その他の企業
- BacThera
- Evologic Technologies
- Probiotical
- QUAY Pharma
- アジア太平洋の生体バイオ医薬品およびマイクロバイオームの受託製造業者
- BJP Laboratories
- その他の企業
- Aumgene Biosciences
- AcuraBio
- Meteoric Biopharmaceuticals
- Probiotics Australia
- Unique Biotech
第10章 パートナー候補の分析
第11章 大手製薬会社の取り組み
第12章 最近の動向と取り組み
第13章 臨床試験分析
第14章 容量分析
第15章 需要分析
第16章 製造か購入かの意思意思決定の枠組み
第17章 ケーススタディ:生バイオ医薬品とマイクロバイオーム受託調査機関(CRO)および栄養補助食品メーカー
第18章 市場影響分析:促進要因、抑制要因、機会、課題
- 章の概要
- 市場の促進要因
- 市場の抑制要因
- 市場の機会
- 市場の課題
- 結論

