|
|
市場調査レポート
商品コード
1766373
可変形状ミラーの世界市場:市場シェアとランキング、全体売上と需要予測(2025年~2031年)Deformable Mirror- Global Market Share and Ranking, Overall Sales and Demand Forecast 2025-2031 |
||||||

|
|||||||
カスタマイズ可能
適宜更新あり
|
|||||||


| 可変形状ミラーの世界市場:市場シェアとランキング、全体売上と需要予測(2025年~2031年) |
|
出版日: 2025年07月10日
発行: QYResearch
ページ情報: 英文 144 Pages
納期: 2~3営業日
|

全表示
- 概要
- 図表
- 目次
世界の可変形状ミラーの市場規模は、2024年に1億1,131万米ドルとなりました。
同市場は、2025年から2031年の予測期間に10.55%のCAGRで拡大し、2031年までに2億3,152万米ドルに達すると予測されています。
北米の可変形状ミラーの市場規模は、2024年に4,165万米ドルとなりました。同市場は、2025年から2031年の予測期間中に10.68%のCAGRで拡大し、2031年までに8,855万米ドルに達すると予測されています。
アジア太平洋の可変形状ミラーの市場規模は、2024年に3,588万米ドルとなりました。同市場は、2025年から2031年の予測期間中に11.52%のCAGRで拡大し、2031年までに7,831万米ドルに達すると予測されています。
欧州の可変形状ミラーの市場規模は、2024年に2,897万米ドルとなりました。同市場は、2025年から2031年の予測期間中に9.45%のCAGRで拡大し、2031年までに5,603万米ドルに達すると予測されています。
可変形状ミラーの世界の主要企業は、Boston Micromachines、Thorlabs、Bertin Alpao、Flexible Optical、Imagine Optic、Dynamic Opticsなどです。2024年には、世界の大手5社が売上高で約65.70%のシェアを占めています。
当レポートは、世界の可変形状ミラー市場を包括的に紹介することを目的としており、可変形状ミラーの地域別・国別、タイプ別、用途別の分析とともに、総販売量、販売収益、価格、主要企業の市場シェア、ランキングに焦点を当てています。
可変形状ミラーの市場規模・推計・予測は、2024年を基準年として、2020年から2031年までの履歴データと予測データを売上数量(台)と売上収益(100万米ドル)で提供しています。定量的および定性的な分析により、読者がビジネス/成長戦略を策定し、市場競争状況を評価し、現在の市場における自社のポジションを分析し、可変形状ミラーに関する情報に基づいたビジネス上の意思決定を行うのに役立ちます。
目次
第1章 市場概要
- 可変形状ミラー製品イントロダクション
- 世界の可変形状ミラー市場規模予測
- 可変形状ミラー市場動向と促進要因
- 前提と制限
- 調査目的
- 対象年
第2章 企業による競合分析
第3章 タイプ別セグメンテーション
- タイプ別イントロダクション
- 常用面ミラー
- セグメントミラー
- その他
- 世界の可変形状ミラーの販売額、タイプ別
- 世界の可変形状ミラーの販売量、タイプ別
- 世界の可変形状ミラーの平均価格、タイプ別(2020年~2031年)
第4章 用途別セグメンテーション
- 用途別イントロダクション
- 天文学
- 顕微鏡検査
- レーザー応用
- 網膜画像
- その他
- 世界の可変形状ミラーの販売額、用途別
- 世界の可変形状ミラーの販売量、用途別
- 世界の可変形状ミラーの平均価格、用途別(2020年~2031年)
第5章 地域別セグメンテーション
- 世界の可変形状ミラーの販売額、地域別
- 世界の可変形状ミラーの販売量、地域別
- 世界の可変形状ミラーの平均価格、地域別(2020年~2031年)
- 北米
- 欧州
- アジア太平洋
- 南米
- 中東・アフリカ
第6章 主要国/地域別セグメンテーション
- 主要国/地域別可変形状ミラーの販売額成長動向、2020年対2024年対2031年
- 主要国/地域別可変形状ミラーの販売額と販売数量
- 米国
- 欧州
- 中国
- 日本
- 韓国
- 東南アジア
- インド
第7章 企業プロファイル
- Boston Micromachines
- Thorlabs
- Bertin Alpao
- Flexible Optical
- Imagine Optic
- Dynamic Optics
- ISP System
- AKA Optics
第8章 産業チェーン分析
第9章 調査結果と結論
第10章 付録
List of Tables
- Table 1. Deformable Mirror Market Trends
- Table 2. Deformable Mirror Market Drivers & Opportunity
- Table 3. Deformable Mirror Market Challenges
- Table 4. Deformable Mirror Market Restraints
- Table 5. Global Deformable Mirror Revenue by Company (2020-2025) & (US$ Million)
- Table 6. Global Deformable Mirror Revenue Market Share by Company (2020-2025)
- Table 7. Global Deformable Mirror Sales Volume by Company (2020-2025) & (Units)
- Table 8. Global Deformable Mirror Sales Volume Market Share by Company (2020-2025)
- Table 9. Global Market Deformable Mirror Price by Company (2020-2025) & (US$/Unit)
- Table 10. Key Manufacturers Deformable Mirror Manufacturing Base and Headquarters
- Table 11. Key Manufacturers Deformable Mirror Product Type
- Table 12. Global Deformable Mirror Manufacturers Market Concentration Ratio (CR5)
- Table 13. Global Top Manufacturers Market Share by Company Type (Tier 1, Tier 2, and Tier 3) & (based on the Revenue in Deformable Mirror as of 2024)
- Table 14. Mergers & Acquisitions, Expansion Plans
- Table 15. Global Deformable Mirror Sales Value by Type: 2020 VS 2024 VS 2031 (US$ Million)
- Table 16. Global Deformable Mirror Sales Value by Type (2020-2025) & (US$ Million)
- Table 17. Global Deformable Mirror Sales Value by Type (2026-2031) & (US$ Million)
- Table 18. Global Deformable Mirror Sales Market Share in Value by Type (2020-2025)
- Table 19. Global Deformable Mirror Sales Market Share in Value by Type (2026-2031)
- Table 20. Global Deformable Mirror Sales Volume by Type: 2020 VS 2024 VS 2031 (Units)
- Table 21. Global Deformable Mirror Sales Volume by Type (2020-2025) & (Units)
- Table 22. Global Deformable Mirror Sales Volume by Type (2026-2031) & (Units)
- Table 23. Global Deformable Mirror Sales Volume Market Share by Type (2020-2025)
- Table 24. Global Deformable Mirror Sales Volume Market Share by Type (2026-2031)
- Table 25. Global Deformable Mirror Price by Type (2020-2025) & (US$/Unit)
- Table 26. Global Deformable Mirror Price by Type (2026-2031) & (US$/Unit)
- Table 27. Global Deformable Mirror Sales Value by Application: 2020 VS 2024 VS 2031 (US$ Million)
- Table 28. Global Deformable Mirror Sales Value by Application (2020-2025) & (US$ Million)
- Table 29. Global Deformable Mirror Sales Value by Application (2026-2031) & (US$ Million)
- Table 30. Global Deformable Mirror Sales Market Share in Value by Application (2020-2025)
- Table 31. Global Deformable Mirror Sales Market Share in Value by Application (2026-2031)
- Table 32. Global Deformable Mirror Sales Volume by Application: 2020 VS 2024 VS 2031 (Units)
- Table 33. Global Deformable Mirror Sales Volume by Application (2020-2025) & (Units)
- Table 34. Global Deformable Mirror Sales Volume by Application (2026-2031) & (Units)
- Table 35. Global Deformable Mirror Sales Volume Market Share by Application (2020-2025)
- Table 36. Global Deformable Mirror Sales Volume Market Share by Application (2026-2031)
- Table 37. Global Deformable Mirror Price by Application (2020-2025) & (US$/Unit)
- Table 38. Global Deformable Mirror Price by Application (2026-2031) & (US$/Unit)
- Table 39. Global Deformable Mirror Sales Value by Region, (2020 VS 2024 VS 2031) & (US$ Million)
- Table 40. Global Deformable Mirror Sales Value by Region (2020-2025) & (US$ Million)
- Table 41. Global Deformable Mirror Sales Value by Region (2026-2031) & (US$ Million)
- Table 42. Global Deformable Mirror Sales Value by Region (2020-2025) & (%)
- Table 43. Global Deformable Mirror Sales Value by Region (2026-2031) & (%)
- Table 44. Global Deformable Mirror Sales Volume by Region (Units): 2020 VS 2024 VS 2031
- Table 45. Global Deformable Mirror Sales Volume by Region (2020-2025) & (Units)
- Table 46. Global Deformable Mirror Sales Volume by Region (2026-2031) & (Units)
- Table 47. Global Deformable Mirror Sales Volume by Region (2020-2025) & (%)
- Table 48. Global Deformable Mirror Sales Volume by Region (2026-2031) & (%)
- Table 49. Global Deformable Mirror Average Price by Region (2020-2025) & (US$/Unit)
- Table 50. Global Deformable Mirror Average Price by Region (2026-2031) & (US$/Unit)
- Table 51. Key Countries/Regions Deformable Mirror Sales Value Growth Trends, (US$ Million): 2020 VS 2024 VS 2031
- Table 52. Key Countries/Regions Deformable Mirror Sales Value, (2020-2025) & (US$ Million)
- Table 53. Key Countries/Regions Deformable Mirror Sales Value, (2026-2031) & (US$ Million)
- Table 54. Key Countries/Regions Deformable Mirror Sales Volume, (2020-2025) & (Units)
- Table 55. Key Countries/Regions Deformable Mirror Sales Volume, (2026-2031) & (Units)
- Table 56. Boston Micromachines Company Information
- Table 57. Boston Micromachines Introduction and Business Overview
- Table 58. Boston Micromachines Deformable Mirror Sales (Units), Revenue (US$ Million), Price (US$/Unit) and Gross Margin (2020-2025)
- Table 59. Boston Micromachines Deformable Mirror Product Offerings
- Table 60. Thorlabs Company Information
- Table 61. Thorlabs Introduction and Business Overview
- Table 62. Thorlabs Deformable Mirror Sales (Units), Revenue (US$ Million), Price (US$/Unit) and Gross Margin (2020-2025)
- Table 63. Thorlabs Deformable Mirror Product Offerings
- Table 64. Bertin Alpao Company Information
- Table 65. Bertin Alpao Introduction and Business Overview
- Table 66. Bertin Alpao Deformable Mirror Sales (Units), Revenue (US$ Million), Price (US$/Unit) and Gross Margin (2020-2025)
- Table 67. Bertin Alpao Deformable Mirror Product Offerings
- Table 68. Flexible Optical Company Information
- Table 69. Flexible Optical Introduction and Business Overview
- Table 70. Flexible Optical Deformable Mirror Sales (Units), Revenue (US$ Million), Price (US$/Unit) and Gross Margin (2020-2025)
- Table 71. Flexible Optical Deformable Mirror Product Offerings
- Table 72. Imagine Optic Company Information
- Table 73. Imagine Optic Introduction and Business Overview
- Table 74. Imagine Optic Deformable Mirror Sales (Units), Revenue (US$ Million), Price (US$/Unit) and Gross Margin (2020-2025)
- Table 75. Imagine Optic Deformable Mirror Product Offerings
- Table 76. Dynamic Optics Company Information
- Table 77. Dynamic Optics Introduction and Business Overview
- Table 78. Dynamic Optics Deformable Mirror Sales (Units), Revenue (US$ Million), Price (US$/Unit) and Gross Margin (2020-2025)
- Table 79. Dynamic Optics Deformable Mirror Product Offerings
- Table 80. ISP System Company Information
- Table 81. ISP System Introduction and Business Overview
- Table 82. ISP System Deformable Mirror Sales (Units), Revenue (US$ Million), Price (US$/Unit) and Gross Margin (2020-2025)
- Table 83. ISP System Deformable Mirror Product Offerings
- Table 84. AKA Optics Company Information
- Table 85. AKA Optics Introduction and Business Overview
- Table 86. AKA Optics Deformable Mirror Sales (Units), Revenue (US$ Million), Price (US$/Unit) and Gross Margin (2020-2025)
- Table 87. AKA Optics Deformable Mirror Product Offerings
- Table 88. Key Raw Materials Lists
- Table 89. Raw Materials Key Suppliers Lists
- Table 90. Deformable Mirror Downstream Customers
- Table 91. Deformable Mirror Distributors List
- Table 92. Research Programs/Design for This Report
- Table 93. Key Data Information from Secondary Sources
- Table 94. Key Data Information from Primary Sources
List of Figures
- Figure 1. Deformable Mirror Product Picture
- Figure 2. Global Deformable Mirror Sales Value, 2020 VS 2024 VS 2031 (US$ Million)
- Figure 3. Global Deformable Mirror Sales Value (2020-2031) & (US$ Million)
- Figure 4. Global Deformable Mirror Sales Volume (2020-2031) & (Units)
- Figure 5. Global Deformable Mirror Sales Price (2020-2031) & (US$/Unit)
- Figure 6. Deformable Mirror Report Years Considered
- Figure 7. Global Deformable Mirror Players Revenue Ranking (2024) & (US$ Million)
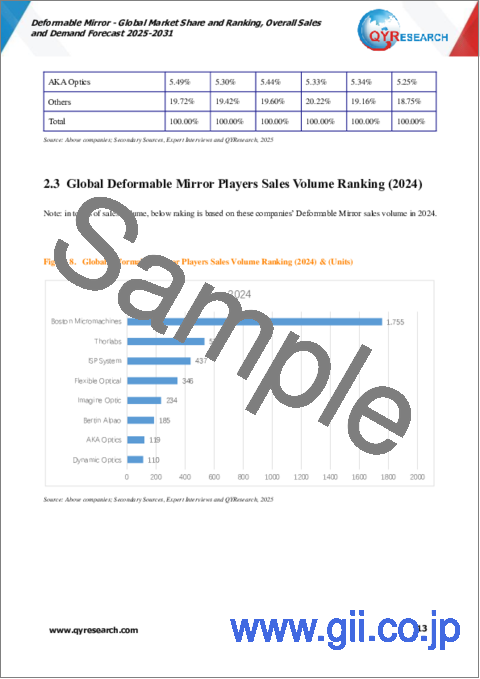
- Figure 8. Global Deformable Mirror Players Sales Volume Ranking (2024) & (Units)
- Figure 9. The 3 and 5 Largest Manufacturers in the World: Market Share by Deformable Mirror Revenue in 2024
- Figure 10. Deformable Mirror Market Share by Company Type (Tier 1, Tier 2, and Tier 3) in 2024
- Figure 11. Continuous Surface Mirrors Picture
- Figure 12. Segmented Mirrors Picture
- Figure 13. Global Deformable Mirror Sales Value by Type (2020 VS 2024 VS 2031) & (US$ Million)
- Figure 14. Global Deformable Mirror Sales Value Market Share by Type, 2024 & 2031
- Figure 15. Global Deformable Mirror Sales Volume by Type (2020 VS 2024 VS 2031) & (Units)
- Figure 16. Global Deformable Mirror Sales Volume Market Share by Type, 2024 & 2031
- Figure 17. Product Picture of Astronomy
- Figure 18. Product Picture of Microscopy
- Figure 19. Product Picture of Laser Application
- Figure 20. Product Picture of Retinal Imaging
- Figure 21. Global Deformable Mirror Sales Value by Application (2020 VS 2024 VS 2031) & (US$ Million)
- Figure 22. Global Deformable Mirror Sales Value Market Share by Application, 2024 & 2031
- Figure 23. Global Deformable Mirror Sales Volume by Application (2020 VS 2024 VS 2031) & (Units)
- Figure 24. Global Deformable Mirror Sales Volume Market Share by Application, 2024 & 2031
- Figure 25. North America Deformable Mirror Sales Value (2020-2031) & (US$ Million)
- Figure 26. North America Deformable Mirror Sales Value by Country (%), 2024 VS 2031
- Figure 27. Europe Deformable Mirror Sales Value, (2020-2031) & (US$ Million)
- Figure 28. Europe Deformable Mirror Sales Value by Country (%), 2024 VS 2031
- Figure 29. Asia Pacific Deformable Mirror Sales Value, (2020-2031) & (US$ Million)
- Figure 30. Asia Pacific Deformable Mirror Sales Value by Region (%), 2024 VS 2031
- Figure 31. South America Deformable Mirror Sales Value, (2020-2031) & (US$ Million)
- Figure 32. South America Deformable Mirror Sales Value by Country (%), 2024 VS 2031
- Figure 33. Middle East & Africa Deformable Mirror Sales Value, (2020-2031) & (US$ Million)
- Figure 34. Middle East & Africa Deformable Mirror Sales Value by Country (%), 2024 VS 2031
- Figure 35. United States Deformable Mirror Sales Value, (2020-2031) & (US$ Million)
- Figure 36. United States Deformable Mirror Sales Value by Type (%), 2024 VS 2031
- Figure 37. United States Deformable Mirror Sales Value by Application (%), 2024 VS 2031
- Figure 38. Europe Deformable Mirror Sales Value, (2020-2031) & (US$ Million)
- Figure 39. Europe Deformable Mirror Sales Value by Type (%), 2024 VS 2031
- Figure 40. Europe Deformable Mirror Sales Value by Application (%), 2024 VS 2031
- Figure 41. China Deformable Mirror Sales Value, (2020-2031) & (US$ Million)
- Figure 42. China Deformable Mirror Sales Value by Type (%), 2024 VS 2031
- Figure 43. China Deformable Mirror Sales Value by Application (%), 2024 VS 2031
- Figure 44. Japan Deformable Mirror Sales Value, (2020-2031) & (US$ Million)
- Figure 45. Japan Deformable Mirror Sales Value by Type (%), 2024 VS 2031
- Figure 46. Japan Deformable Mirror Sales Value by Application (%), 2024 VS 2031
- Figure 47. South Korea Deformable Mirror Sales Value, (2020-2031) & (US$ Million)
- Figure 48. South Korea Deformable Mirror Sales Value by Type (%), 2024 VS 2031
- Figure 49. South Korea Deformable Mirror Sales Value by Application (%), 2024 VS 2031
- Figure 50. Southeast Asia Deformable Mirror Sales Value, (2020-2031) & (US$ Million)
- Figure 51. Southeast Asia Deformable Mirror Sales Value by Type (%), 2024 VS 2031
- Figure 52. Southeast Asia Deformable Mirror Sales Value by Application (%), 2024 VS 2031
- Figure 53. India Deformable Mirror Sales Value, (2020-2031) & (US$ Million)
- Figure 54. India Deformable Mirror Sales Value by Type (%), 2024 VS 2031
- Figure 55. India Deformable Mirror Sales Value by Application (%), 2024 VS 2031
- Figure 56. Deformable Mirror Industrial Chain
- Figure 57. Deformable Mirror Manufacturing Cost Structure in 2024
- Figure 58. Micromachining Processes for The Fabrication of A Deformable Mirror
- Figure 59. Channels of Distribution (Direct Vs Distribution)
- Figure 60. Bottom-up and Top-down Approaches for This Report
- Figure 61. Data Triangulation
- Figure 62. Key Executives Interviewed
The global market for Deformable Mirror was worth US$ 111.31 million in 2024 and is forecast to a readjusted size of US$ 231.52 million by 2031 with a CAGR of 10.55% during the forecast period 2025-2031.
North American market for Deformable Mirror was valued at $ 41.65 million in 2024 and will reach $ 88.55 million by 2031, at a CAGR of 10.68% during the forecast period of 2025 through 2031.
Asia-Pacific market for Deformable Mirror was valued at $ 35.88 million in 2024 and will reach $ 78.31 million by 2031, at a CAGR of 11.52% during the forecast period of 2025 through 2031.
Europe market for Deformable Mirror was valued at $ 28.97 million in 2024 and will reach $ 56.03 million by 2031, at a CAGR of 9.45% during the forecast period of 2025 through 2031.
The global key companies of Deformable Mirror include Boston Micromachines, Thorlabs, Bertin Alpao, Flexible Optical, Imagine Optic, Dynamic Optics, etc. In 2024, the global five largest players hold a share approximately 65.70% in terms of revenue.
This report aims to provide a comprehensive presentation of the global market for Deformable Mirror, focusing on the total sales volume, sales revenue, price, key companies market share and ranking, together with an analysis of Deformable Mirror by region & country, by Type, and by Application.
The Deformable Mirror market size, estimations, and forecasts are provided in terms of sales volume (Units) and sales revenue ($ millions), considering 2024 as the base year, with history and forecast data for the period from 2020 to 2031. With both quantitative and qualitative analysis, to help readers develop business/growth strategies, assess the market competitive situation, analyze their position in the current marketplace, and make informed business decisions regarding Deformable Mirror.
Market Segmentation
By Company
- Boston Micromachines
- Thorlabs
- Bertin Alpao
- Flexible Optical
- Imagine Optic
- Dynamic Optics
- ISP System
- AKA Optics
Segment by Type
- Continuous Surface Mirrors
- Segmented Mirrors
- Others
Segment by Application
- Astronomy
- Microscopy
- Laser Application
- Retinal Imaging
- Others
By Region
- North America
- United States
- Canada
- Asia-Pacific
- China
- Japan
- South Korea
- Southeast Asia
- India
- Rest of Asia-Pacific
- Europe
- Germany
- France
- U.K.
- Italy
- Rest of Europe
- Latin America
- Mexico
- Argentina
- Brazil
- Rest of Latin America
- Middle East & Africa
- Middle East
- Africa
Chapter Outline
Chapter 1: Introduces the report scope of the report, global total market size (value, volume and price). This chapter also provides the market dynamics, latest developments of the market, the driving factors and restrictive factors of the market, the challenges and risks faced by manufacturers in the industry, and the analysis of relevant policies in the industry.
Chapter 2: Detailed analysis of Deformable Mirror manufacturers competitive landscape, price, sales and revenue market share, latest development plan, merger, and acquisition information, etc.
Chapter 3: Provides the analysis of various market segments by Type, covering the market size and development potential of each market segment, to help readers find the blue ocean market in different market segments.
Chapter 4: Provides the analysis of various market segments by Application, covering the market size and development potential of each market segment, to help readers find the blue ocean market in different downstream markets.
Chapter 5: Sales, revenue of Deformable Mirror in regional level. It provides a quantitative analysis of the market size and development potential of each region and introduces the market development, future development prospects, market space, and market size of each country in the world.
Chapter 6: Sales, revenue of Deformable Mirror in country level. It provides sigmate data by Type, and by Application for each country/region.
Chapter 7: Provides profiles of key players, introducing the basic situation of the main companies in the market in detail, including product sales, revenue, price, gross margin, product introduction, recent development, etc.
Chapter 8: Analysis of industrial chain, including the upstream and downstream of the industry.
Chapter 9: Conclusion.
Table of Contents
1 Market Overview
- 1.1 Deformable Mirror Product Introduction
- 1.2 Global Deformable Mirror Market Size Forecast
- 1.2.1 Global Deformable Mirror Sales Value (2020-2031)
- 1.2.2 Global Deformable Mirror Sales Volume (2020-2031)
- 1.2.3 Global Deformable Mirror Sales Price (2020-2031)
- 1.3 Deformable Mirror Market Trends & Drivers
- 1.3.1 Deformable Mirror Industry Trends
- 1.3.2 Deformable Mirror Market Drivers & Opportunity
- 1.3.3 Deformable Mirror Market Challenges
- 1.3.4 Deformable Mirror Market Restraints
- 1.4 Assumptions and Limitations
- 1.5 Study Objectives
- 1.6 Years Considered
2 Competitive Analysis by Company
- 2.1 Global Deformable Mirror Players Revenue Ranking (2024)
- 2.2 Global Deformable Mirror Revenue by Company (2020-2025)
- 2.3 Global Deformable Mirror Players Sales Volume Ranking (2024)
- 2.4 Global Deformable Mirror Sales Volume by Company Players (2020-2025)
- 2.5 Global Deformable Mirror Average Price by Company (2020-2025)
- 2.6 Key Manufacturers Deformable Mirror Manufacturing Base and Headquarters
- 2.7 Key Manufacturers Deformable Mirror Product Offered
- 2.8 Deformable Mirror Market Competitive Analysis
- 2.8.1 Deformable Mirror Market Concentration Rate (2020-2025)
- 2.8.2 Global 3 and 5 Largest Manufacturers by Deformable Mirror Revenue in 2024
- 2.8.3 Global Top Manufacturers by Company Type (Tier 1, Tier 2, and Tier 3) & (based on the Revenue in Deformable Mirror as of 2024)
- 2.9 Mergers & Acquisitions, Expansion
3 Segmentation by Type
- 3.1 Introduction by Type
- 3.1.1 Continuous Surface Mirrors
- 3.1.2 Segmented Mirrors
- 3.1.3 Others
- 3.2 Global Deformable Mirror Sales Value by Type
- 3.2.1 Global Deformable Mirror Sales Value by Type (2020 VS 2024 VS 2031)
- 3.2.2 Global Deformable Mirror Sales Value, by Type (2020-2031)
- 3.2.3 Global Deformable Mirror Sales Value, by Type (%) (2020-2031)
- 3.3 Global Deformable Mirror Sales Volume by Type
- 3.3.1 Global Deformable Mirror Sales Volume by Type (2020 VS 2024 VS 2031)
- 3.3.2 Global Deformable Mirror Sales Volume, by Type (2020-2031)
- 3.3.3 Global Deformable Mirror Sales Volume, by Type (%) (2020-2031)
- 3.4 Global Deformable Mirror Average Price by Type (2020-2031)
4 Segmentation by Application
- 4.1 Introduction by Application
- 4.1.1 Astronomy
- 4.1.2 Microscopy
- 4.1.3 Laser Application
- 4.1.4 Retinal Imaging
- 4.1.5 Others
- 4.2 Global Deformable Mirror Sales Value by Application
- 4.2.1 Global Deformable Mirror Sales Value by Application (2020 VS 2024 VS 2031)
- 4.2.2 Global Deformable Mirror Sales Value, by Application (2020-2031)
- 4.2.3 Global Deformable Mirror Sales Value, by Application (%) (2020-2031)
- 4.3 Global Deformable Mirror Sales Volume by Application
- 4.3.1 Global Deformable Mirror Sales Volume by Application (2020 VS 2024 VS 2031)
- 4.3.2 Global Deformable Mirror Sales Volume, by Application (2020-2031)
- 4.3.3 Global Deformable Mirror Sales Volume, by Application (%) (2020-2031)
- 4.4 Global Deformable Mirror Average Price by Application (2020-2031)
5 Segmentation by Region
- 5.1 Global Deformable Mirror Sales Value by Region
- 5.1.1 Global Deformable Mirror Sales Value by Region: 2020 VS 2024 VS 2031
- 5.1.2 Global Deformable Mirror Sales Value by Region (2020-2025)
- 5.1.3 Global Deformable Mirror Sales Value by Region (2026-2031)
- 5.1.4 Global Deformable Mirror Sales Value by Region (%), (2020-2031)
- 5.2 Global Deformable Mirror Sales Volume by Region
- 5.2.1 Global Deformable Mirror Sales Volume by Region: 2020 VS 2024 VS 2031
- 5.2.2 Global Deformable Mirror Sales Volume by Region (2020-2025)
- 5.2.3 Global Deformable Mirror Sales Volume by Region (2026-2031)
- 5.2.4 Global Deformable Mirror Sales Volume by Region (%), (2020-2031)
- 5.3 Global Deformable Mirror Average Price by Region (2020-2031)
- 5.4 North America
- 5.4.1 North America Deformable Mirror Sales Value, 2020-2031
- 5.4.2 North America Deformable Mirror Sales Value by Country (%), 2024 VS 2031
- 5.5 Europe
- 5.5.1 Europe Deformable Mirror Sales Value, 2020-2031
- 5.5.2 Europe Deformable Mirror Sales Value by Country (%), 2024 VS 2031
- 5.6 Asia Pacific
- 5.6.1 Asia Pacific Deformable Mirror Sales Value, 2020-2031
- 5.6.2 Asia Pacific Deformable Mirror Sales Value by Region (%), 2024 VS 2031
- 5.7 South America
- 5.7.1 South America Deformable Mirror Sales Value, 2020-2031
- 5.7.2 South America Deformable Mirror Sales Value by Country (%), 2024 VS 2031
- 5.8 Middle East & Africa
- 5.8.1 Middle East & Africa Deformable Mirror Sales Value, 2020-2031
- 5.8.2 Middle East & Africa Deformable Mirror Sales Value by Country (%), 2024 VS 2031
6 Segmentation by Key Countries/Regions
- 6.1 Key Countries/Regions Deformable Mirror Sales Value Growth Trends, 2020 VS 2024 VS 2031
- 6.2 Key Countries/Regions Deformable Mirror Sales Value and Sales Volume
- 6.2.1 Key Countries/Regions Deformable Mirror Sales Value, 2020-2031
- 6.2.2 Key Countries/Regions Deformable Mirror Sales Volume, 2020-2031
- 6.3 United States
- 6.3.1 United States Deformable Mirror Sales Value, 2020-2031
- 6.3.2 United States Deformable Mirror Sales Value by Type (%), 2024 VS 2031
- 6.3.3 United States Deformable Mirror Sales Value by Application, 2024 VS 2031
- 6.4 Europe
- 6.4.1 Europe Deformable Mirror Sales Value, 2020-2031
- 6.4.2 Europe Deformable Mirror Sales Value by Type (%), 2024 VS 2031
- 6.4.3 Europe Deformable Mirror Sales Value by Application, 2024 VS 2031
- 6.5 China
- 6.5.1 China Deformable Mirror Sales Value, 2020-2031
- 6.5.2 China Deformable Mirror Sales Value by Type (%), 2024 VS 2031
- 6.5.3 China Deformable Mirror Sales Value by Application, 2024 VS 2031
- 6.6 Japan
- 6.6.1 Japan Deformable Mirror Sales Value, 2020-2031
- 6.6.2 Japan Deformable Mirror Sales Value by Type (%), 2024 VS 2031
- 6.6.3 Japan Deformable Mirror Sales Value by Application, 2024 VS 2031
- 6.7 South Korea
- 6.7.1 South Korea Deformable Mirror Sales Value, 2020-2031
- 6.7.2 South Korea Deformable Mirror Sales Value by Type (%), 2024 VS 2031
- 6.7.3 South Korea Deformable Mirror Sales Value by Application, 2024 VS 2031
- 6.8 Southeast Asia
- 6.8.1 Southeast Asia Deformable Mirror Sales Value, 2020-2031
- 6.8.2 Southeast Asia Deformable Mirror Sales Value by Type (%), 2024 VS 2031
- 6.8.3 Southeast Asia Deformable Mirror Sales Value by Application, 2024 VS 2031
- 6.9 India
- 6.9.1 India Deformable Mirror Sales Value, 2020-2031
- 6.9.2 India Deformable Mirror Sales Value by Type (%), 2024 VS 2031
- 6.9.3 India Deformable Mirror Sales Value by Application, 2024 VS 2031
7 Company Profiles
- 7.1 Boston Micromachines
- 7.1.1 Boston Micromachines Company Information
- 7.1.2 Boston Micromachines Introduction and Business Overview
- 7.1.3 Boston Micromachines Deformable Mirror Sales, Revenue, Price and Gross Margin (2020-2025)
- 7.1.4 Boston Micromachines Deformable Mirror Product Offerings
- 7.2 Thorlabs
- 7.2.1 Thorlabs Company Information
- 7.2.2 Thorlabs Introduction and Business Overview
- 7.2.3 Thorlabs Deformable Mirror Sales, Revenue, Price and Gross Margin (2020-2025)
- 7.2.4 Thorlabs Deformable Mirror Product Offerings
- 7.3 Bertin Alpao
- 7.3.1 Bertin Alpao Company Information
- 7.3.2 Bertin Alpao Introduction and Business Overview
- 7.3.3 Bertin Alpao Deformable Mirror Sales, Revenue, Price and Gross Margin (2020-2025)
- 7.3.4 Bertin Alpao Deformable Mirror Product Offerings
- 7.4 Flexible Optical
- 7.4.1 Flexible Optical Company Information
- 7.4.2 Flexible Optical Introduction and Business Overview
- 7.4.3 Flexible Optical Deformable Mirror Sales, Revenue, Price and Gross Margin (2020-2025)
- 7.4.4 Flexible Optical Deformable Mirror Product Offerings
- 7.5 Imagine Optic
- 7.5.1 Imagine Optic Company Information
- 7.5.2 Imagine Optic Introduction and Business Overview
- 7.5.3 Imagine Optic Deformable Mirror Sales, Revenue, Price and Gross Margin (2020-2025)
- 7.5.4 Imagine Optic Deformable Mirror Product Offerings
- 7.6 Dynamic Optics
- 7.6.1 Dynamic Optics Company Information
- 7.6.2 Dynamic Optics Introduction and Business Overview
- 7.6.3 Dynamic Optics Deformable Mirror Sales, Revenue, Price and Gross Margin (2020-2025)
- 7.6.4 Dynamic Optics Deformable Mirror Product Offerings
- 7.7 ISP System
- 7.7.1 ISP System Company Information
- 7.7.2 ISP System Introduction and Business Overview
- 7.7.3 ISP System Deformable Mirror Sales, Revenue, Price and Gross Margin (2020-2025)
- 7.7.4 ISP System Deformable Mirror Product Offerings
- 7.8 AKA Optics
- 7.8.1 AKA Optics Company Information
- 7.8.2 AKA Optics Introduction and Business Overview
- 7.8.3 AKA Optics Deformable Mirror Sales, Revenue, Price and Gross Margin (2020-2025)
- 7.8.4 AKA Optics Deformable Mirror Product Offerings
8 Industry Chain Analysis
- 8.1 Deformable Mirror Industrial Chain
- 8.2 Deformable Mirror Upstream Analysis
- 8.2.1 Key Raw Materials
- 8.2.2 Raw Materials Key Suppliers
- 8.2.3 Manufacturing Cost Structure
- 8.3 Midstream Analysis
- 8.4 Deformable Mirror Production Mode & Process
- 8.5 Downstream Analysis (Customers Analysis)
- 8.6 Sales Model and Sales Channels
- 8.6.1 Deformable Mirror Sales Model
- 8.6.2 Deformable Mirror Distributors
9 Research Findings and Conclusion
10 Appendix
- 10.1 Research Methodology
- 10.1.1 Methodology/Research Approach
- 10.1.2 Data Source
- 10.2 Author Details
- 10.3 Disclaimer 127

