|
|
市場調査レポート
商品コード
1784607
データセンター向けプラガブルオプティクスのアジア太平洋地域市場、2021年~2031年:コンポーネント別、データレート別Asia Pacific Pluggable Optics for Data Center Market Report 2021-2031 by Scope, Segmentation, Dynamics, and Competitive Analysis |
||||||
|
|||||||
|
|||||||

| データセンター向けプラガブルオプティクスのアジア太平洋地域市場、2021年~2031年:コンポーネント別、データレート別 |
|
出版日: 2025年07月10日
発行: The Insight Partners
ページ情報: 英文 163 Pages
納期: 即納可能
|

全表示
- 概要
- 図表
- 目次
アジア太平洋地域のデータセンター向けプラガブルオプティクス市場規模は、2023年の17億2,818万米ドルから2031年には43億5,144万米ドルに達し、2023~2031年にCAGRで12.2%の成長が予測されています。
エグゼクティブサマリーとアジア太平洋地域のデータセンター向けプラガブルオプティクス市場分析
アジア太平洋地域のデータセンター向けプラガブルオプティクス市場は、中国、インド、日本、オーストラリア、韓国、その他アジア太平洋地域に区分されます。この地域は、デジタル化、データセンタ開発、光ネットワーク近代化の急増により、プラガブルオプティクスの需要増となり、CAGRは大きく成長すると予測されています。ノキア(Nokia Corporation)が2023年11月に発表したデータによると、この地域のデータセンター事業者は、規模、敏捷性、可用性を高めるために国内光ネットワークの近代化に注力しています。このため、データセンターでは、パフォーマンスを最適化して異なるデータレートや波長を調整するプラガブルオプティクスの採用が増加しています。CBRE South Asia Pvt.Ltdのレポート「アジア太平洋データセンター動向Q1 2024」によると、インドはアジア太平洋地域(中国を除く)で約950メガワットのデータセンター容量を有し、オーストラリア、香港特別行政区、日本、シンガポール、韓国などの主要国を抜いてAPAC主要国のトップに立っています。インドは2024年から2026年にかけて、データセンター容量を約850MWまで拡大する計画です。さらに、同地域のデータセンター分野では、グローバル事業者、プライベートエクイティファンド、不動産開発業者から多額の投資が行われ、アジア太平洋地域の急速なデジタル変換と高速伝送を支えています。
アジア太平洋地域のデータセンター向けプラガブルオプティクス市場セグメンテーション分析:
アジア太平洋地域のデータセンター向けプラガブルオプティクス市場分析に貢献した主要セグメントは、コンポーネントとデータレート。
コンポーネントに基づいて、アジア太平洋地域のデータセンター向けプラガブルオプティクス市場はスイッチ、ルーター、サーバーにセグメント化されます。スイッチは、2023年に市場で最大シェアを占めます。
データレート別に見ると、アジア太平洋地域のデータセンター向けプラガブルオプティクス市場は、100~400GB/S、400~800GB/S、800GB/S以上に区分されます。2023年には400~800GB/Sセグメントが最大シェア。
アジア太平洋地域のデータセンター向けプラガブルオプティクス市場展望
ハイパフォーマンスコンピューティング(HPC)、またはスーパーコンピューティングは、従来のコンピュータやサーバーよりも大幅に高い馬力を生み出す方法で計算能力を組み合わせる実践です。IBMによると、最速のコモディティデスクトップ、ラップトップ、サーバーシステムよりも100万倍以上高速だといいます。HPCとは、複数のコンピューターとストレージデバイスを使い、大量のデータを極めて高速に処理する手法です。今日のビジネスシーンでは、短時間で大量の計算を行い、より高速なオペレーションを行うことが求められています。多くのHPCデータセンターは、多くの計算能力を必要とする大手民間企業や公開会社と連携しています。HPCのパワーは、従来のコンピューティングシステムでは解決できなかったような問題を、企業が解決するのに役立ちます。
HPCは、多くのストレージ、コンピューティング、ネットワーキングシステムを相互接続することで、費用対効果が高く、持続可能でスケーラブルな光ネットワーキングソリューションの必要性を生み出します。このことが、HPCデータセンター向けの広帯域プラガブルトランシーバの必要性を高めています。この地域のさまざまな企業が、HPCワークロードを処理するためにデータセンタの立ち上げや施設の拡張に注力しています。
アジア太平洋地域のデータセンター向けプラガブルオプティクス市場国別インサイト
国別に見ると、アジア太平洋地域のデータセンター向けプラガブルオプティクス市場は、中国、日本、インド、韓国、オーストラリア、その他アジア太平洋地域で構成されます。2023年は中国が最大シェア。
データセンタにおけるコスト効率、スケーラビリティ、柔軟性、ネットワーク最適化、相互運用性、容易な導入、メンテナンスの簡素化、ネットワーク可用性の強化など、プラガブルオプティクスの利点に関連する認識作りのための組織的イニシアチブとサポートの増加が、中国のデータセンター向けプラガブルオプティクス市場成長に寄与しています。例えば、2024年3月、Eoptolink Technology Inc.は、OFC 2024に参加して業界初のレーン当たり200G LPO 800G光トランシーバのデモンストレーションを行いました。このデモンストレーションは、データセンターに200G/レーンLPO 800G光トランシーバーが提供する利点に関する認知度向上を支援するものです。さらに、1レーン当たり200G LPO 800G光トランシーバは、AIやMLクラスタなどのハイパフォーマンスコンピューティングアプリケーションに非常に適しています。これにより、先端技術の導入に注力している企業での採用が増えます。
アジア太平洋地域のデータセンター向けプラガブルオプティクス市場の企業プロファイル
データセンター向けプラガブルオプティクス市場で事業展開している主要企業には、Coherent Corp、Nokia Corp、Cisco Systems i、Infinera Corp、Telefonaktiebolaget LM Ericsson、Ciena Corp、Intel Corp、Lumentum Holdings Inc、Juniper Networks Inc、Marvell Technology Inc、Yangtze Optical Fibre and Cable Joint Stock Ltd、Broadcom Incなどがあります。これらの企業は、消費者に革新的な製品を提供し、市場シェアを拡大するために、事業拡大、製品革新、M&Aなど様々な戦略を採用しています。
目次
第1章 イントロダクション
第2章 エグゼクティブサマリー
- 主要洞察
- 市場の魅力
第3章 調査手法
- 2次調査
- 1次調査
- 仮説の策定
- マクロ経済要因分析
- ファンデーション数値の開発
- データの三角測量
- 国レベルのデータ
第4章 アジア太平洋地域のデータセンター向けプラガブルオプティクス市場情勢
- エコシステム分析
- バリューチェーンのベンダー一覧
第5章 アジア太平洋地域のデータセンター向けプラガブルオプティクス市場:主要市場力学
- 市場促進要因
- 各メーカーの製品開発への注力
- 高性能コンピューティングへのニーズの高まり
- 市場抑制要因
- ネットワークの複雑化
- 市場機会
- 高性能AIインフラにおけるプラガブルオプティクスの需要
- エネルギー効率に対する需要
- 動向
- リニアプラガブルオプティクス
- 促進要因と抑制要因の影響
第6章 データセンター向けプラガブルオプティクス市場:アジア太平洋地域分析
- アジア太平洋地域のデータセンター向けプラガブルオプティクス市場収益、2021-2031年
- アジア太平洋地域のデータセンター向けプラガブルオプティクス市場予測分析
第7章 アジア太平洋地域のデータセンター向けプラガブルオプティクス市場分析:コンポーネント別
- スイッチ
- ルーター
- サーバー
第8章 アジア太平洋地域のデータセンター向けプラガブルオプティクス市場分析:データレート別
- 100~400GB/S
- 400~800GB/S
- 800GB/S以上
第9章 アジア太平洋地域のデータセンター向けプラガブルオプティクス市場:国別分析
- アジア太平洋地域
- 中国
- 日本
- インド
- 韓国
- オーストラリア
- その他のアジア太平洋地域
第10章 競合情勢
- ヒートマップ分析
- 企業のポジショニング分析
第11章 業界情勢
- 市場への取り組み
- 製品開発
- 合併と買収
第12章 企業プロファイル
- Coherent Corp
- Nokia Corp
- Cisco Systems Inc
- Infinera Corp
- Telefonaktiebolaget LM Ericsson
- Ciena Corp
- Intel Corp
- Lumentum Holdings Inc
- Juniper Networks Inc
- Marvell Technology Inc
- Yangtze Optical Fibre and Cable Joint Stock Ltd
- Broadcom Inc
第13章 付録
List Of Tables
- Table 1. Asia Pacific Pluggable Optics for Data Center Market Segmentation
- Table 2. List of Vendors
- Table 3. Asia Pacific Pluggable Optics for Data Center Market - Revenue and Forecast, 2021-2031 (US$ Million)
- Table 4. Asia Pacific Pluggable Optics for Data Center Market - Revenue and Forecast, 2021-2031 (US$ Million) - by Component
- Table 5. Asia Pacific Pluggable Optics for Data Center Market - Revenue and Forecast, 2021-2031 (US$ Million) - by Data Rate
- Table 6. Asia Pacific Pluggable Optics for Data Center Market - Revenue and Forecast, 2021-2031 (US$ Million) - by Country
- Table 7. China: Asia Pacific Pluggable Optics for Data Center Market - Revenue and Forecast, 2021 - 2031 (US$ Million) - by Component
- Table 8. China: Asia Pacific Pluggable Optics for Data Center Market - Revenue and Forecast, 2021 - 2031 (US$ Million) - by Data Rate
- Table 9. Japan: Asia Pacific Pluggable Optics for Data Center Market - Revenue and Forecast, 2021 - 2031 (US$ Million) - by Component
- Table 10. Japan: Asia Pacific Pluggable Optics for Data Center Market - Revenue and Forecast, 2021 - 2031 (US$ Million) - by Data Rate
- Table 11. India: Asia Pacific Pluggable Optics for Data Center Market - Revenue and Forecast, 2021 - 2031 (US$ Million) - by Component
- Table 12. India: Asia Pacific Pluggable Optics for Data Center Market - Revenue and Forecast, 2021 - 2031 (US$ Million) - by Data Rate
- Table 13. South Korea: Asia Pacific Pluggable Optics for Data Center Market - Revenue and Forecast, 2021 - 2031 (US$ Million) - by Component
- Table 14. South Korea: Asia Pacific Pluggable Optics for Data Center Market - Revenue and Forecast, 2021 - 2031 (US$ Million) - by Data Rate
- Table 15. Australia: Asia Pacific Pluggable Optics for Data Center Market - Revenue and Forecast, 2021 - 2031 (US$ Million) - by Component
- Table 16. Australia: Asia Pacific Pluggable Optics for Data Center Market - Revenue and Forecast, 2021 - 2031 (US$ Million) - by Data Rate
- Table 17. Rest of APAC: Asia Pacific Pluggable Optics for Data Center Market - Revenue and Forecast, 2021 - 2031 (US$ Million) - by Component
- Table 18. Rest of APAC: Asia Pacific Pluggable Optics for Data Center Market - Revenue and Forecast, 2021 - 2031 (US$ Million) - by Data Rate
- Table 19. List of Abbreviation
List Of Figures
- Figure 1. Asia Pacific Pluggable Optics for Data Center Market Segmentation - Country
- Figure 2. Asia Pacific Pluggable Optics for Data Center Market - Key Market Dynamics
- Figure 3. Impact Analysis of Drivers and Restraints
- Figure 4. Asia Pacific Pluggable Optics for Data Center Market Revenue (US$ Million), 2021-2031
- Figure 5. Asia Pacific Pluggable Optics for Data Center Market Share (%) - by Component (2023 and 2031)
- Figure 6. Switches: Asia Pacific Pluggable Optics for Data Center Market - Revenue and Forecast, 2021-2031 (US$ Million)
- Figure 7. Routers: Asia Pacific Pluggable Optics for Data Center Market - Revenue and Forecast, 2021-2031 (US$ Million)
- Figure 8. Servers: Asia Pacific Pluggable Optics for Data Center Market - Revenue and Forecast, 2021-2031 (US$ Million)
- Figure 9. Asia Pacific Pluggable Optics for Data Center Market Share (%) - by Data Rate (2023 and 2031)
- Figure 10.-400GB/S: Asia Pacific Pluggable Optics for Data Center Market - Revenue and Forecast, 2021-2031 (US$ Million)
- Figure 11.-800GB/S: Asia Pacific Pluggable Optics for Data Center Market - Revenue and Forecast, 2021-2031 (US$ Million)
- Figure 12.GB/S and Above: Asia Pacific Pluggable Optics for Data Center Market - Revenue and Forecast, 2021-2031 (US$ Million)
- Figure 13. Asia Pacific Pluggable Optics for Data Center Market Breakdown, by Key Countries, 2023 and 2031 (%)
- Figure 14. China: Asia Pacific Pluggable Optics for Data Center Market - Revenue and Forecast, 2021- 2031 (US$ Million)
- Figure 15. Japan: Asia Pacific Pluggable Optics for Data Center Market - Revenue and Forecast, 2021- 2031 (US$ Million)
- Figure 16. India: Asia Pacific Pluggable Optics for Data Center Market - Revenue and Forecast, 2021- 2031 (US$ Million)
- Figure 17. South Korea: Asia Pacific Pluggable Optics for Data Center Market - Revenue and Forecast, 2021- 2031 (US$ Million)
- Figure 18. Australia: Asia Pacific Pluggable Optics for Data Center Market - Revenue and Forecast, 2021- 2031 (US$ Million)
- Figure 19. Rest of APAC: Asia Pacific Pluggable Optics for Data Center Market - Revenue and Forecast, 2021- 2031 (US$ Million)
- Figure 20. Company Heat Map Analysis
- Figure 21. Company Positioning and Concentration
The Asia Pacific pluggable optics for data center market size is expected to reach US$ 4,351.44 million by 2031 from US$ 1,728.18 million in 2023. The market is estimated to record a CAGR of 12.2% from 2023 to 2031.
Executive Summary and Asia Pacific Pluggable Optics for Data Center Market Analysis:
The Asia Pacific pluggable optics for data center market is segmented into China, India, Japan, Australia, South Korea, and the Rest of Asia Pacific. The region is projected to grow at a significant CAGR, due to an upsurge in digitalization, development of data centers, and modernization of optical networks, resulting in a rise in the demand for pluggable optics. The Asia Pacific data center market has 801 data centers operated by 192 providers. The largest data center in the region is Goodman: Tsuen Wan West Campus with 225 megawatts. According to Nokia Corporation data published on November 2023, data center operators in region focus on modernizing national optical networks to increase scale, agility and availability. This increases the adoption of pluggable optics in data centers for adjusting different data rates or wavelengths by optimizing performance. According to CBRE South Asia Pvt. Ltd's report titled 'Asia Pacific Data Center Trends Q1 2024', India tops major APAC countries with the highest data center capacity of around 950MW in Asia Pacific (excluding China), overtaking major countries such as Australia, Hong Kong SAR, Japan, Singapore, and South Korea. India is planning to expand its data center capacity to around 850 MW during 2024-2026. Further, the data center sector in the region has witnessed significant investments from global operators, private equity funds, and real estate developers. This supports region in rapid digital transformation and high-speed transmission across Asia Pacific countries.
Asia Pacific Pluggable Optics for Data Center Market Segmentation Analysis:
Key segments that contributed to the derivation of the Asia Pacific pluggable optics for data center market analysis are component and data rate.
Based on component, the Asia Pacific pluggable optics for data center market is segmented into switches, routers, and servers. The switches held the largest share of the market in 2023.
By data rate, the Asia Pacific pluggable optics for data center market is segmented into 100-400GB/S, 400-800GB/S, and 800GB/S and Above. The 400-800GB/S segment held the largest share of the market in 2023.
Asia Pacific Pluggable Optics for Data Center Market Outlook
High-performance computing (HPC), or supercomputing, is a practice of combining computing power in a way that produces significantly more horsepower than traditional computers and servers. According to IBM, it is more than one million times faster than the fastest commodity desktop, laptop, or server systems. HPC is a method of processing massive amounts of data at extremely high speeds using multiple computers and storage devices. A high volume of calculations in a short amount of time is needed in today's business landscape for faster operations. Many HPC data centers are linked to large private and public companies that require a lot of computing power. The HPC power helps businesses solve problems that would otherwise be impossible to solve using traditional computing systems.
HPC is about the interconnection of many storage, computing, and networking systems, which generates the need for cost-effective, sustainable, and scalable optical networking solutions. This factor fuels the need for high-bandwidth pluggable transceivers for HPC data centers. Various companies in the region are focused on launching data centers or expanding their facilities to handle HPC workloads.
Asia Pacific Pluggable Optics for Data Center Market Country Insights
Based on country, the Asia Pacific pluggable optics for data center market comprises China, Japan, India, South Korea, Australia, and the Rest of Asia Pacific. China held the largest share in 2023.
An increase in organizational initiatives and support for creating awareness related to the benefits of pluggable optics-including cost-efficiency, scalability, flexibility, network optimization, interoperability, easy deployment, simplified maintenance, and enhanced network availability-in data centers are contributing to the pluggable optics for data center market growth in China. For instance, in March 2024, Eoptolink Technology Inc., Ltd. participated in OFC 2024 to demonstrate industry 1st 200G per lane LPO 800G optical transceivers. This demonstration supports the company in creating awareness related to the benefits provided by 200G per lane LPO 800G optical transceivers to the data center. Further, 200G per lane LPO 800G optical transceivers are highly suitable for high-performance computing applications such as AI and ML clusters. This increases adoption among businesses focusing on deploying advanced technologies.
Asia Pacific Pluggable Optics for Data Center Market Company Profiles
Some of the key players operating in the Pluggable Optics for Data Center Market include Coherent Corp, Nokia Corp, Cisco Systems I, Infinera Corp, Telefonaktiebolaget LM Ericsson, Ciena Corp, Intel Corp, Lumentum Holdings Inc, Juniper Networks Inc, Marvell Technology Inc, Yangtze Optical Fibre and Cable Joint Stock Ltd, and Broadcom Inc among others. These players are adopting various strategies such as expansion, product innovation, and mergers and acquisitions to provide innovative products to their consumers and increase their market share.
Asia Pacific Pluggable Optics for Data Center Market Research Methodology :
The following methodology has been followed for the collection and analysis of data presented in this report:
Secondary Research The research process begins with comprehensive secondary research, utilizing both internal and external sources to gather qualitative and quantitative data for each market. Commonly referenced secondary research sources include, but are not limited to:
Company websites , annual reports, financial statements, broker analyses, and investor presentations. Industry trade journals and other relevant publications. Government documents , statistical databases, and market reports. News articles , press releases, and webcasts specific to companies operating in the market. Note: All financial data included in the Company Profiles section has been standardized to USD. For companies reporting in other currencies, figures have been converted to USD using the relevant exchange rates for the corresponding year.
Primary Research The Insight Partners' conducts a significant number of primary interviews each year with industry stakeholders and experts to validate its data analysis, and gain valuable insights. These research interviews are designed to:
Validate and refine findings from secondary research. Enhance the expertise and market understanding of the analysis team. Gain insights into market size, trends, growth patterns, competitive dynamics, and future prospects. Primary research is conducted via email interactions and telephone interviews, encompassing various markets, categories, segments, and sub-segments across different regions. Participants typically include:
Industry stakeholders : Vice Presidents, business development managers, market intelligence managers, and national sales managers External experts : Valuation specialists, research analysts, and key opinion leaders with industry-specific expertise
Table Of Contents
1. Introduction
- 1.1 Report Guidance
- 1.2 Market Segmentation
2. Executive Summary
- 2.1 Key Insights
- 2.2 Market Attractiveness
3. Research Methodology
- 3.1 Secondary Research
- 3.2 Primary Research
- 3.2.1 Hypothesis formulation:
- 3.2.2 Macroeconomic factor analysis:
- 3.2.3 Developing base number:
- 3.2.4 Data Triangulation:
- 3.2.5 Country-level data:
4. Asia Pacific Pluggable Optics for Data Center Market Landscape
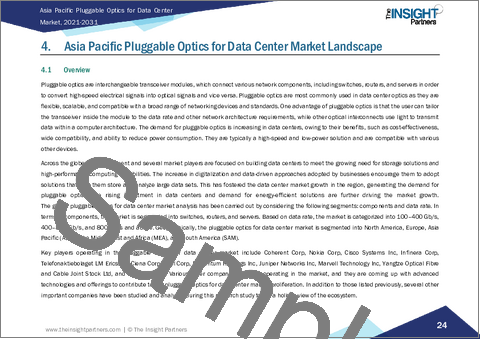
- 4.1 Overview
- 4.2 Ecosystem Analysis
- 4.3 List of Vendors in the Value Chain
5. Asia Pacific Pluggable Optics for Data Center Market - Key Market Dynamics
- 5.1 Market Drivers
- 5.1.1 Manufacturers Focus on Product Development
- 5.1.2 Rising Need for High-Performance Computing
- 5.2 Market Restraints
- 5.2.1 Rising Network Complexity
- 5.3 Market Opportunities
- 5.3.1 Demand for Pluggable Optics in High-Performance AI Infrastructure
- 5.3.2 Demand for Energy Efficiency
- 5.4 Trends
- 5.4.1 Linear Pluggable Optics
- 5.5 Impact of Drivers and Restraints:
6. Pluggable Optics for Data Center Market - Asia Pacific Analysis
- 6.1 Asia Pacific Pluggable Optics for Data Center Market Revenue (US$ Million), 2021-2031
- 6.2 Asia Pacific Pluggable Optics for Data Center Market Forecast Analysis
7. Asia Pacific Pluggable Optics for Data Center Market Analysis - by Component
- 7.1 Switches
- 7.1.1 Overview
- 7.1.2 Switches: Asia Pacific Pluggable Optics for Data Center Market - Revenue and Forecast, 2021-2031 (US$ Million)
- 7.2 Routers
- 7.2.1 Overview
- 7.2.2 Routers: Asia Pacific Pluggable Optics for Data Center Market - Revenue and Forecast, 2021-2031 (US$ Million)
- 7.3 Servers
- 7.3.1 Overview
- 7.3.2 Servers: Asia Pacific Pluggable Optics for Data Center Market - Revenue and Forecast, 2021-2031 (US$ Million)
8. Asia Pacific Pluggable Optics for Data Center Market Analysis - by Data Rate
- 8.1-400GB/S
- 8.1.1 Overview
- 8.1.2-400GB/S: Asia Pacific Pluggable Optics for Data Center Market - Revenue and Forecast, 2021-2031 (US$ Million)
- 8.2-800GB/S
- 8.2.1 Overview
- 8.2.2-800GB/S: Asia Pacific Pluggable Optics for Data Center Market - Revenue and Forecast, 2021-2031 (US$ Million)
- 8.3GB/S and Above
- 8.3.1 Overview
- 8.3.2GB/S and Above: Asia Pacific Pluggable Optics for Data Center Market - Revenue and Forecast, 2021-2031 (US$ Million)
9. Asia Pacific Pluggable Optics for Data Center Market - Country Analysis
- 9.1 Asia Pacific
- 9.1.1 Asia Pacific Pluggable Optics for Data Center Market - Revenue and Forecast Analysis - by Country
- 9.1.1.1 Asia Pacific Pluggable Optics for Data Center Market - Revenue and Forecast Analysis - by Country
- 9.1.1.2 China: Asia Pacific Pluggable Optics for Data Center Market - Revenue and Forecast, 2021-2031 (US$ Million)
- 9.1.1.2.1 China: Asia Pacific Pluggable Optics for Data Center Market Share - by Component
- 9.1.1.2.2 China: Asia Pacific Pluggable Optics for Data Center Market Share - by Data Rate
- 9.1.1.3 Japan: Asia Pacific Pluggable Optics for Data Center Market - Revenue and Forecast, 2021-2031 (US$ Million)
- 9.1.1.3.1 Japan: Asia Pacific Pluggable Optics for Data Center Market Share - by Component
- 9.1.1.3.2 Japan: Asia Pacific Pluggable Optics for Data Center Market Share - by Data Rate
- 9.1.1.4 India: Asia Pacific Pluggable Optics for Data Center Market - Revenue and Forecast, 2021-2031 (US$ Million)
- 9.1.1.4.1 India: Asia Pacific Pluggable Optics for Data Center Market Share - by Component
- 9.1.1.4.2 India: Asia Pacific Pluggable Optics for Data Center Market Share - by Data Rate
- 9.1.1.5 South Korea: Asia Pacific Pluggable Optics for Data Center Market - Revenue and Forecast, 2021-2031 (US$ Million)
- 9.1.1.5.1 South Korea: Asia Pacific Pluggable Optics for Data Center Market Share - by Component
- 9.1.1.5.2 South Korea: Asia Pacific Pluggable Optics for Data Center Market Share - by Data Rate
- 9.1.1.6 Australia: Asia Pacific Pluggable Optics for Data Center Market - Revenue and Forecast, 2021-2031 (US$ Million)
- 9.1.1.6.1 Australia: Asia Pacific Pluggable Optics for Data Center Market Share - by Component
- 9.1.1.6.2 Australia: Asia Pacific Pluggable Optics for Data Center Market Share - by Data Rate
- 9.1.1.7 Rest of APAC: Asia Pacific Pluggable Optics for Data Center Market - Revenue and Forecast, 2021-2031 (US$ Million)
- 9.1.1.7.1 Rest of APAC: Asia Pacific Pluggable Optics for Data Center Market Share - by Component
- 9.1.1.7.2 Rest of APAC: Asia Pacific Pluggable Optics for Data Center Market Share - by Data Rate
- 9.1.1 Asia Pacific Pluggable Optics for Data Center Market - Revenue and Forecast Analysis - by Country
10. Competitive Landscape
- 10.1 Heat Map Analysis
- 10.2 Company Positioning Analysis
11. Industry Landscape
- 11.1 Overview
- 11.2 Market Initiative
- 11.3 Product Development
- 11.4 Mergers & Acquisitions
12. Company Profiles
- 12.1 Coherent Corp
- 12.1.1 Key Facts
- 12.1.2 Business Description
- 12.1.3 Products and Services
- 12.1.4 Financial Overview
- 12.1.5 SWOT Analysis
- 12.1.6 Key Developments
- 12.2 Nokia Corp
- 12.2.1 Key Facts
- 12.2.2 Business Description
- 12.2.3 Products and Services
- 12.2.4 Financial Overview
- 12.2.5 SWOT Analysis
- 12.2.6 Key Developments
- 12.3 Cisco Systems Inc
- 12.3.1 Key Facts
- 12.3.2 Business Description
- 12.3.3 Products and Services
- 12.3.4 Financial Overview
- 12.3.5 SWOT Analysis
- 12.3.6 Key Developments
- 12.4 Infinera Corp
- 12.4.1 Key Facts
- 12.4.2 Business Description
- 12.4.3 Products and Services
- 12.4.4 Financial Overview
- 12.4.5 SWOT Analysis
- 12.4.6 Key Developments
- 12.5 Telefonaktiebolaget LM Ericsson
- 12.5.1 Key Facts
- 12.5.2 Business Description
- 12.5.3 Products and Services
- 12.5.4 Financial Overview
- 12.5.5 SWOT Analysis
- 12.5.6 Key Developments
- 12.6 Ciena Corp
- 12.6.1 Key Facts
- 12.6.2 Business Description
- 12.6.3 Products and Services
- 12.6.4 Financial Overview
- 12.6.5 SWOT Analysis
- 12.6.6 Key Developments
- 12.7 Intel Corp
- 12.7.1 Key Facts
- 12.7.2 Business Description
- 12.7.3 Products and Services
- 12.7.4 Financial Overview
- 12.7.5 SWOT Analysis
- 12.7.6 Key Developments
- 12.8 Lumentum Holdings Inc
- 12.8.1 Key Facts
- 12.8.2 Business Description
- 12.8.3 Products and Services
- 12.8.4 Financial Overview
- 12.8.5 SWOT Analysis
- 12.8.6 Key Developments
- 12.9 Juniper Networks Inc
- 12.9.1 Key Facts
- 12.9.2 Business Description
- 12.9.3 Products and Services
- 12.9.4 Financial Overview
- 12.9.5 SWOT Analysis
- 12.9.6 Key Developments
- 12.10 Marvell Technology Inc
- 12.10.1 Key Facts
- 12.10.2 Business Description
- 12.10.3 Products and Services
- 12.10.4 Financial Overview
- 12.10.5 SWOT Analysis
- 12.10.6 Key Developments
- 12.11 Yangtze Optical Fibre and Cable Joint Stock Ltd
- 12.11.1 Key Facts
- 12.11.2 Business Description
- 12.11.3 Products and Services
- 12.11.4 Financial Overview
- 12.11.5 SWOT Analysis
- 12.11.6 Key Developments
- 12.12 Broadcom Inc
- 12.12.1 Key Facts
- 12.12.2 Business Description
- 12.12.3 Products and Services
- 12.12.4 Financial Overview
- 12.12.5 SWOT Analysis
- 12.12.6 Key Developments
13. Appendix
- 13.1 About The Insight Partners
- 13.2 Word Index
