|
|
市場調査レポート
商品コード
1471933
珪砂の世界市場:2024年Global Silica Sand Market Research Report 2024 |
||||||
|
|||||||
カスタマイズ可能
適宜更新あり
|
|||||||

| 珪砂の世界市場:2024年 |
|
出版日: 2024年04月30日
発行: QYResearch
ページ情報: 英文 163 Pages
納期: 2~3営業日
|

全表示
- 概要
- 図表
- 目次
世界の珪砂の市場規模は、2023年の91億8,700万米ドルから、予測期間中は3.54%のCAGRで推移し、2030年末には117億7,300万米ドルに達すると予想されています。
珪砂の世界のトップ3ベンダーによる2023年の収益シェアは約25.52%を占めています。
当レポートでは、世界の珪砂の市場を調査し、市場および製品の概要、競合情勢、市場規模の推移・予測、各種区分・地域/主要国別の詳細分析、価格動向、市場成長への各種影響因子の分析、主要企業の分析などをまとめています。
目次
第1章 珪砂市場概要
- 製品定義
- 珪砂:タイプ別
- 成長率分析:2023 vs 2030
- 珪砂のタイプ別セグメント
- 珪砂:用途別
- 成長率分析:2023 vs 2030
- 珪砂の用途別セグメント
- 世界市場の成長見通し
- 収益の推移・予測
- 販売数の推移・予測
- 平均価格の推移・予測
- 前提と制限
第2章 競合情勢:製造業者別
- 収益シェア:製造業者別
- 市場シェア:企業タイプ別
- 平均価格:製造業者別
- 世界の主要製造業者:本社・販売店
- 競合情勢・動向
- M&A・拡大
第3章 珪砂の製造動向:地域別
- 製造額の推計・予測:2019 vs 2023 vs 2030
- 製造額の推移・予測・市場シェア
- 製造量の推計・予測:2019 vs 2023 vs 2030
- 製造量の推移・予測・市場シェア
- 価格分析
- 製造量・前年比成長率
- 北米
- 欧州
- 中国
- オーストラリア
第4章 珪砂の消費動向:地域別
- 消費量の推計・予測:2019 vs 2023 vs 2030
- 消費量の推移・予測
- 収益の推移・予測
第5章 珪砂の消費国
- 北米
- 欧州
- アジア太平洋
- 南米
- 中東・アフリカ
第6章 タイプ別セグメント
- 製造量の推移・予測・市場シェア
- 製造額の推移・予測・市場シェア
- 価格の推移・予測
第7章 用途別セグメント
- 製造量の推移・予測・市場シェア
- 製造額の推移・予測・市場シェア
- 価格の推移・予測
第8章 主要企業の概要
- U.S. Silica
- Covia
- Sibelco
- Badger Mining
- Quarzwerke Group
- Preferred Sands
- Pattison Sand
- CNBM
- Kibing Glass
- Mitsubishi
- Minerali Industriali
- Fuyao Group
- Sisecam
- Shanyuan
- Lianxin Group
- Sifucel
- Tokai Sand
- Fulchiron
- Strobel Quarzsand
- Aggregate Industries
- Wolff & Muller
- Toyota Tsusho
- Duchang xinshiji
- Bathgate Silica Sand
第9章 産業チェーン・販売チャネルの分析
- 主な原材料
- マーケティングチャネルの状況
- 市場ポジショニング
- 珪砂の顧客プロファイル
第10章 珪砂:市場力学
- 市場動向
- 事業機会と促進要因
- 市場課題
- 市場の好材料と不利な材料
- 市場への影響
- 市場リスク
- 業界の直面する大きな障壁
- ポーターのファイブフォース分析
第11章 調査結果・総論
第12章 調査手法・データソース
List of Tables
- Table 1. Global Silica Sand Market Value by Type, (US$ Million) & (2023 VS 2030)
- Table 2. Global Silica Sand Market Value by Application, (US$ Million) & (2023 VS 2030)
- Table 3. Silica Sand Segment by Application
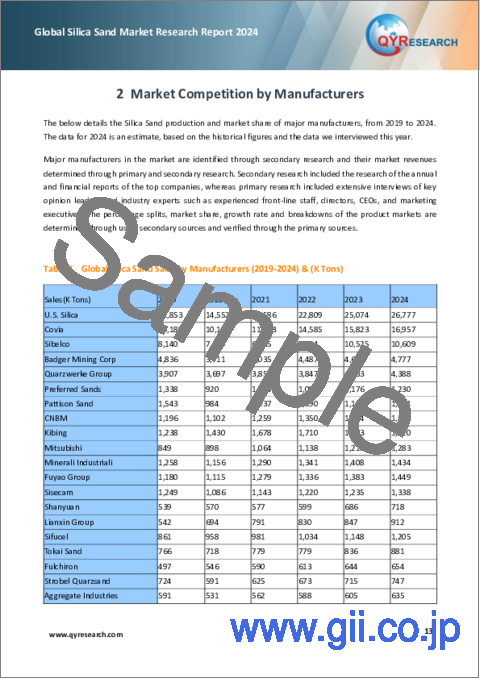
- Table 4. Global Silica Sand Sales by Manufacturers (2019-2024) & (K Tons)
- Table 5. Global Silica Sand Production Market Share by Manufacturers (2019-2024)
- Table 6. Global Silica Sand Revenue by Manufacturers (2019-2024) & (US$ Million)
- Table 7. Global Silica Sand Revenue Share by Manufacturers (2019-2024)
- Table 8. Company Type (Tier 1, Tier 2, and Tier 3) & (based on the Revenue in Silica Sand as of 2023)
- Table 9. Global Market Silica Sand Average Price by Manufacturers (US$/Ton) & (2019-2024)
- Table 10. Global Key Manufacturers of Silica Sand, Headquarters Distribution
- Table 11. Global Silica Sand Manufacturers Market Concentration Ratio (CR5 and HHI)
- Table 12. Mergers & Acquisitions, Expansion Plans
- Table 13. Global Silica Sand Production Comparison by Region: 2019 VS 2023 VS 2030 (K Tons)
- Table 14. Global Silica Sand Production (K Tons) by Region (2019-2024)
- Table 15. Global Silica Sand Production Market Share by Region (2019-2024)
- Table 16. Global Silica Sand Production (K Tons) Forecast by Region (2025-2030)
- Table 17. Global Silica Sand Production Market Share Forecast by Region (2025-2030)
- Table 18. Global Silica Sand Revenue Growth Rate by Region: 2019 VS 2023 VS 2030 (Million USD)
- Table 19. Global Silica Sand Consumption by Region (2019-2024) & (K Tons)
- Table 20. Global Silica Sand Consumption Market Share by Region (2019-2024)
- Table 21. Global Silica Sand Forecasted Consumption by Region (2025-2030) & (K Tons)
- Table 22. Global Silica Sand Forecasted Consumption Market Share by Region (2019-2024)
- Table 23. Global Silica Sand Revenue by Region (2019-2024) & (Million USD)
- Table 24. Global Silica Sand Revenue Market Share by Region (2019-2024)
- Table 25. Global Silica Sand Forecasted Revenue by Region (2025-2030) & (Million USD)
- Table 26. Global Silica Sand Forecasted Revenue Market Share by Region (2019-2024)
- Table 27. North America Silica Sand Consumption Growth Rate by Country: 2019 VS 2023 VS 2030 (K Tons)
- Table 28. North America Silica Sand Consumption by Country (2019-2024) & (K Tons)
- Table 29. North America Silica Sand Consumption by Country (2025-2030) & (K Tons)
- Table 30. Europe Silica Sand Consumption Growth Rate by Country: 2019 VS 2023 VS 2030 (K Tons)
- Table 31. Europe Silica Sand Consumption by Country (2019-2024) & (K Tons)
- Table 32. Europe Silica Sand Consumption by Country (2025-2030) & (K Tons)
- Table 33. Asia Pacific Silica Sand Consumption Growth Rate by Country: 2019 VS 2023 VS 2030 (K Tons)
- Table 34. Asia Pacific Silica Sand Consumption by Region (2019-2024) & (K Tons)
- Table 35. Asia Pacific Silica Sand Consumption by Region (2025-2030) & (K Tons)
- Table 36. South America Silica Sand Consumption Growth Rate by Country: 2019 VS 2023 VS 2030 (K Tons)
- Table 37. South America Silica Sand Consumption by Country (2019-2024) & (K Tons)
- Table 38. South America Silica Sand Consumption by Country (2025-2030) & (K Tons)
- Table 39. Middle East & Africa Silica Sand Consumption Growth Rate by Country: 2019 VS 2023 VS 2030 (K Tons)
- Table 40. Middle East & Africa Silica Sand Consumption by Country (2019-2024) & (K Tons)
- Table 41. Middle East & Africa Silica Sand Consumption by Country (2025-2030) & (K Tons)
- Table 42. Global Silica Sand Sales (K Tons) by Type (2019-2024)
- Table 43. Global Silica Sand Sales (K Tons) by Type (2025-2030)
- Table 44. Global Silica Sand Sales Market Share by Type (2019-2024)
- Table 45. Global Silica Sand Sales Market Share by Type (2025-2030)
- Table 46. Global Silica Sand Revenue (US$ Million) by Type (2019-2024)
- Table 47. Global Silica Sand Revenue (US$ Million) by Type (2025-2030)
- Table 48. Global Silica Sand Revenue Market Share by Type (2019-2024)
- Table 49. Global Silica Sand Revenue Market Share by Type (2025-2030)
- Table 50. Global Silica Sand Price (US$/Ton) by Type (2019-2024)
- Table 51. Global Silica Sand Price (US$/Ton) by Type (2025-2030)
- Table 52. Global Silica Sand Sales (K Tons) by Application (2019-2024)
- Table 53. Global Silica Sand Sales (K Tons) by Application (2025-2030)
- Table 54. Global Silica Sand Sales Market Share by Application (2019-2024)
- Table 55. Global Silica Sand Sales Market Share by Application (2025-2030)
- Table 56. Global Silica Sand Revenue (US$ Million) by Application (2019-2024)
- Table 57. Global Silica Sand Revenue (US$ Million) by Application (2025-2030)
- Table 58. Global Silica Sand Revenue Market Share by Application (2019-2024)
- Table 59. Global Silica Sand Revenue Market Share by Application (2025-2030)
- Table 60. Global Silica Sand Price (US$/Ton) by Application (2019-2024)
- Table 61. Global Silica Sand Price (US$/Ton) by Application (2025-2030)
- Table 62. Table U.S. Silica Information List
- Table 63. Table Silica Sand Information of U.S. Silica
- Table 64. Table Silica Sand Sales, Price and Revenue of U.S. Silica (2019-2023)
- Table 65. Table Covia Information List
- Table 66. Table Silica Sand Information of Covia
- Table 67. Table Silica Sand Sales, Price and Revenue of Covia (2019-2023)
- Table 68. Table Sibelco Information List
- Table 69. Table Silica Sand Information of Sibelco
- Table 70. Table Silica Sand Sales, Price and Revenue of Sibelco (2019-2023)
- Table 71. Table Badger Mining Information List
- Table 72. Table Silica Sand Information of Badger Mining
- Table 73. Table Silica Sand Sales, Price and Revenue of Badger Mining (2019-2023)
- Table 74. Table Quarzwerke Group Information List
- Table 75. Table Silica Sand Information of Quarzwerke Group
- Table 76. Table Silica Sand Sales, Price and Revenue of Quarzwerke Group (2019-2023)
- Table 77. Table Preferred Sands Information List
- Table 78. Table Silica Sand Information of Preferred Sands
- Table 79. Table Silica Sand Sales, Price and Revenue of Preferred Sands (2019-2023)
- Table 80. Table Pattison Sand Information List
- Table 81. Table Silica Sand Information of Pattison Sand
- Table 82. Table Silica Sand Sales, Price and Revenue of Pattison Sand (2019-2023)
- Table 83. Table CNBM Information List
- Table 84. Table Silica Sand Information of CNBM
- Table 85. Table Silica Sand Sales, Price and Revenue of CNBM (2019-2023)
- Table 86. Table Kibing Glass Information List
- Table 87. Table Silica Sand Information of Kibing Glass
- Table 88. Table Silica Sand Sales, Price and Revenue of Kibing Glass (2019-2023)
- Table 89. Table Mitsubishi Information List
- Table 90. Table Silica Sand Information of Mitsubishi
- Table 91. Table Silica Sand Sales, Price and Revenue of Mitsubishi (2019-2023)
- Table 92. Table Minerali Industriali Information List
- Table 93. Table Silica Sand Information of Minerali Industriali
- Table 94. Table Silica Sand Sales, Price and Revenue of Minerali Industriali (2019-2023)
- Table 95. Table Fuyao Group Information List
- Table 96. Table Silica Sand Information of Fuyao Group
- Table 97. Table Silica Sand Sales, Price and Revenue of Fuyao Group (2019-2023)
- Table 98. Table Sisecam Information List
- Table 99. Table Silica Sand Information of Sisecam
- Table 100. Table Silica Sand Sales, Price and Revenue of Sisecam (2019-2023)
- Table 101. Table Shanyuan Information List
- Table 102. Table Silica Sand Information of Shanyuan
- Table 103. Table Silica Sand Sales, Price and Revenue of Shanyuan (2019-2023)
- Table 104. Table Lianxin Group Information List
- Table 105. Table Silica Sand Information of Lianxin Group
- Table 106. Table Silica Sand Sales, Price and Revenue of Lianxin Group (2019-2023)
- Table 107. Table Sifucel Information List
- Table 108. Table Silica Sand Information of Sifucel
- Table 109. Table Silica Sand Sales, Price and Revenue of Sifucel (2019-2023)
- Table 110. Table Tokai Sand Information List
- Table 111. Table Silica Sand Information of Tokai Sand
- Table 112. Table Silica Sand Sales, Price and Revenue of Tokai Sand (2019-2023)
- Table 113. Table Fulchiron Information List
- Table 114. Table Silica Sand Information of Fulchiron
- Table 115. Table Silica Sand Sales, Price and Revenue of Fulchiron (2019-2023)
- Table 116. Table Strobel Quarzsand Information List
- Table 117. Table Silica Sand Information of Strobel Quarzsand
- Table 118. Table Silica Sand Sales, Price and Revenue of Strobel Quarzsand (2019-2023)
- Table 119. Table Aggregate Industries Information List
- Table 120. Table Silica Sand Information of Aggregate Industries
- Table 121. Table Silica Sand Sales, Price and Revenue of Aggregate Industries (2019-2023)
- Table 122. Table Wolff & Muller Information List
- Table 123. Table Silica Sand Information of Wolff & Muller
- Table 124. Table Silica Sand Sales, Price and Revenue of Wolff & Muller (2019-2023)
- Table 125. Table Toyota Tsusho Information List
- Table 126. Table Silica Sand Information of Toyota Tsusho
- Table 127. Table Silica Sand Sales, Price and Revenue of Toyota Tsusho (2019-2023)
- Table 128. Table Duchang xinshiji Information List
- Table 129. Table Silica Sand Information of Duchang xinshiji
- Table 130. Table Silica Sand Sales, Price and Revenue of Duchang xinshiji (2019-2023)
- Table 131. Table Bathgate Silica Sand Information List
- Table 132. Table Silica Sand Information of Bathgate Silica Sand
- Table 133. Table Silica Sand Sales, Price and Revenue of Bathgate Silica Sand (2019-2023)
- Table 134. Market Key Trends
- Table 135. Silica Sand Opportunities and Drivers
- Table 136. Silica Sand Market Challenges
- Table 137. Market Favorable Factors and Unfavorable Factors
- Table 138. COVID-19 Impact on Silica Sand
- Table 139. Market Risks
- Table 140. Industry Enters Major Barriers
- Table 141. Research Programs/Design for This Report
- Table 142. Key Data Information from Secondary Sources
- Table 143. Key Data Information from Primary Sources
- Table 144. Authors List of This Report
List of Figures
- Figure 1. Product Picture of Silica Sand
- Figure 2. Global Silica Sand Market Share by Type in 2023
- Figure 3. Silica Sand Segment by Type
- Figure 4. Global Silica Sand Market Share by Application in 2023
- Figure 5. Global Silica Sand Revenue (US$ Million), 2019 VS 2023 VS 2030
- Figure 6. Global Silica Sand Revenue (US$ Million) & (2019-2030)
- Figure 7. Global Silica Sand Sales Volume (K Tons) & (2019-2030)
- Figure 8. Global Silica Sand Average Price (US$/Ton) & (2019-2030)
- Figure 9. Silica Sand Report Years Considered
- Figure 10. Silica Sand Production Share by Manufacturers in 2023
- Figure 11. Global Silica Sand Revenue Share by Manufacturers (2023)
- Figure 12. The Global 3 Largest Players: Market Share by Silica Sand Revenue in 2023
- Figure 13. The Global 5 Largest Players: Market Share by Silica Sand Revenue in 2023
- Figure 14. North America Silica Sand Production (K Tons) Growth Rate (2019-2030)
- Figure 15. Europe Silica Sand Production (K Tons) Growth Rate (2019-2030)
- Figure 16. China Silica Sand Production (K Tons) Growth Rate (2019-2030)
- Figure 17. Australia Silica Sand Production (K Tons) Growth Rate (2019-2030)
- Figure 18. North America Silica Sand Consumption and Growth Rate (2019-2030) & (K Tons)
- Figure 19. North America Silica Sand Consumption Market Share by Country in 2023
- Figure 20. U.S. Silica Sand Consumption and Growth Rate (2019-2030) & (K Tons)
- Figure 21. Canada Silica Sand Consumption and Growth Rate (2019-2030) & (K Tons)
- Figure 22. Mexico Silica Sand Consumption and Growth Rate (2019-2030) & (K Tons)
- Figure 23. Europe Silica Sand Consumption and Growth Rate (2019-2030) & (K Tons)
- Figure 24. Europe Silica Sand Consumption Market Share by Country in 2023
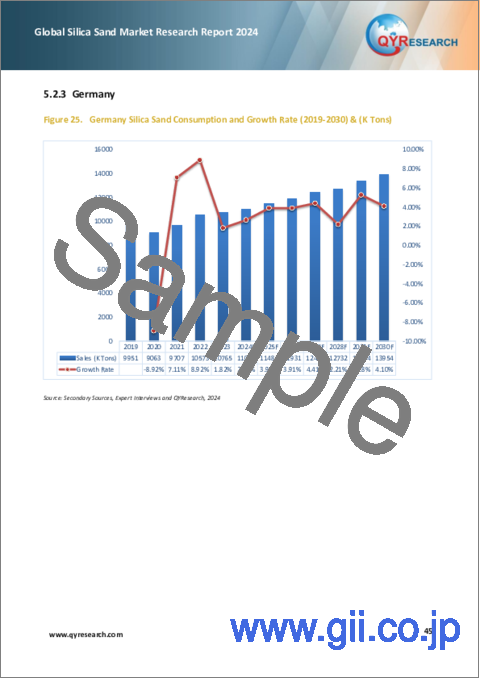
- Figure 25. Germany Silica Sand Consumption and Growth Rate (2019-2030) & (K Tons)
- Figure 26. France Silica Sand Consumption and Growth Rate (2019-2030) & (K Tons)
- Figure 27. U.K. Silica Sand Consumption and Growth Rate (2019-2030) & (K Tons)
- Figure 28. Italy Silica Sand Consumption and Growth Rate (2019-2030) & (K Tons)
- Figure 29. Benelux Silica Sand Consumption and Growth Rate (2019-2030) & (K Tons)
- Figure 30. Asia Pacific Silica Sand Consumption and Growth Rate (2019-2030) & (K Tons)
- Figure 31. Asia Pacific Silica Sand Consumption Market Share by Region in 2023
- Figure 32. China Silica Sand Consumption and Growth Rate (2019-2030) & (K Tons)
- Figure 33. Japan Silica Sand Consumption and Growth Rate (2019-2030) & (K Tons)
- Figure 34. South Korea Silica Sand Consumption and Growth Rate (2019-2030) & (K Tons)
- Figure 35. Southeast Asia Silica Sand Consumption and Growth Rate (2019-2030) & (K Tons)
- Figure 36. India Silica Sand Consumption and Growth Rate (2019-2030) & (K Tons)
- Figure 37. South America Silica Sand Consumption and Growth Rate (2019-2030) & (K Tons)
- Figure 38. South America Silica Sand Consumption Market Share by Country in 2023
- Figure 39. Brazil Silica Sand Consumption and Growth Rate (2019-2030) & (K Tons)
- Figure 40. Argentina Silica Sand Consumption and Growth Rate (2019-2030) & (K Tons)
- Figure 41. Middle East & Africa Silica Sand Consumption and Growth Rate (2019-2030) & (K Tons)
- Figure 42. Middle East & Africa Silica Sand Consumption Market Share by Country in 2023
- Figure 43. Middle East Silica Sand Consumption and Growth Rate (2019-2030) & (K Tons)
- Figure 44. Africa Silica Sand Consumption and Growth Rate (2019-2030) & (K Tons)
- Figure 45. Marketing Channels of Silica Sand by Method
- Figure 46. Customers Profiles
- Figure 47. Porter's Five Forces Analysis
- Figure 48. Bottom-up and Top-down Approaches for This Report
- Figure 49. Data Triangulation
The global Silica Sand market was valued at USD 9187 million in 2023 and is expected to reach USD 11773 million by the end of 2030, growing at a CAGR of 3.54% between 2024 and 2030.
The major global manufacturers of Silica Sand include U.S. Silica, Covia , Badger Mining Corp, Sibelco, Preferred Sands, Pattison Sand, Quarzwerke Group, Fuyao Group, Mitsubishi, etc. in 2023, the world's top three vendors accounted for approximately 25.52% of the revenue.
This report aims to provide a comprehensive presentation of the global market for Silica Sand, with both quantitative and qualitative analysis, to help readers develop business/growth strategies, assess the market competitive situation, analyze their position in the current marketplace, and make informed business decisions regarding Silica Sand.
The Silica Sand market size, estimations, and forecasts are provided in terms of output/shipments (K Tons) and revenue ($ millions), considering 2023 as the base year, with history and forecast data for the period from 2019 to 2030. This report segments the global Silica Sand market comprehensively. Regional market sizes, concerning products by Type, by Application, and by players, are also provided.
For a more in-depth understanding of the market, the report provides profiles of the competitive landscape, key competitors, and their respective market ranks. The report also discusses technological trends and new product developments.
The report will help the Silica Sand manufacturers, new entrants, and industry chain related companies in this market with information on the revenues, production, and average price for the overall market and the sub-segments across the different segments, by company, by Type, by Application, and by regions.
Market Segmentation
By Company
- U.S. Silica
- Covia
- Sibelco
- Badger Mining Corp
- Quarzwerke Group
- Preferred Sands
- Pattison Sand
- CNBM
- Kibing
- Mitsubishi
- Minerali Industriali
- Fuyao Group
- Sisecam
- Shanyuan
- Lianxin Group
- Sifucel
- Tokai Sand
- Fulchiron
- Strobel Quarzsand
- Aggregate Industries
- Wolff & Muller
- Toyota Tsusho
- Duchang xinshiji
- Bathgate Silica Sand
Segment by Type
- Less than 40 mesh
- 40-70 mesh
- More than 70 mesh
Segment by Application
- Hydraulic Fracturing
- Glassmaking
- Foundry
- Ceramics and Refractories
- Others
Production by Region
- North America
- Europe
- China
- Australia
Consumption by Region
- North America
- U.S.
- Canada
- Mexico
- Asia-Pacific
- China
- Japan
- South Korea
- Southeast Asia
- India
- Europe
- Germany
- France
- U.K.
- Italy
- Benelux
- Rest of Europe
- South America, Middle East & Africa
- Brazil
- Middle East
- Africa
Chapter Outline
Chapter 1: Introduces the report scope of the report, executive summary of different market segments (by region, by Type, by Application, etc), including the market size of each market segment, future development potential, and so on. It offers a high-level view of the current state of the market and its likely evolution in the short to mid-term, and long term.
Chapter 2: Detailed analysis of Silica Sand manufacturers competitive landscape, price, production and value market share, latest development plan, merger, and acquisition information, etc.
Chapter 3: Production of Silica Sand by region/country. It provides a quantitative analysis of the market size and development potential of each region in the next six years.
Chapter 4: Consumption of Silica Sand in regional level. It provides a quantitative analysis of the market size and development potential of each region and its main countries and introduces the market development, future development prospects, market space, and production of each country in the world.
Chapter 5: Consumption of Silica Sand in country level. It provides a quantitative analysis of the market size and development potential of each region and its main countries and introduces the market development, future development prospects, market space, and production of each country in the world.
Chapter 6: Provides the analysis of various market segments by Type, covering the market size and development potential of each market segment, to help readers find the blue ocean market in different market segments.
Chapter 7: Provides the analysis of various market segments by Application, covering the market size and development potential of each market segment, to help readers find the blue ocean market in different downstream markets.
Chapter 8: Provides profiles of key players, introducing the basic situation of the main companies in the market in detail, including product production/output, value, price, gross margin, product introduction, recent development, etc.
Chapter 9: Analysis of industrial chain, including the upstream and downstream of the industry.
Chapter 10: Introduces the market dynamics, latest developments of the market, the driving factors and restrictive factors of the market, the challenges and risks faced by manufacturers in the industry, and the analysis of relevant policies in the industry.
Chapter 11: The main points and conclusions of the report.
Table of Contents
1 Silica Sand Market Overview
- 1.1 Product Definition
- 1.2 Silica Sand by Type
- 1.2.1 Global Silica Sand Market Value Growth Rate Analysis by Type: 2023 VS 2030
- 1.2.2 Silica Sand Segment by Type
- 1.3 Silica Sand by Application
- 1.3.1 Global Silica Sand Market Value Growth Rate Analysis by Application: 2023 VS 2030
- 1.3.2 Silica Sand Segment by Application
- 1.4 Global Market Growth Prospects
- 1.4.1 Global Silica Sand Revenue Estimates and Forecasts (2019-2030)
- 1.4.2 Global Silica Sand Sales Volume Estimates and Forecasts (2019-2030)
- 1.4.3 Global Silica Sand Market Average Price Estimates and Forecasts (2019-2030)
- 1.5 Assumptions and Limitations
2 Market Competition by Manufacturers
- 2.1 Global Silica Sand Revenue Market Share by Manufacturers (2019-2024)
- 2.2 Global Silica Sand Market Share by Company Type (Tier 1, Tier 2, and Tier 3)
- 2.3 Global Silica Sand Average Price by Manufacturers (2019-2024)
- 2.4 Global Key Manufacturers of Silica Sand, Headquarters Distribution
- 2.5 Silica Sand Market Competitive Situation and Trends
- 2.5.1 Silica Sand Market Concentration Rate
- 2.5.2 Global 3 and 5 Largest Silica Sand Players Market Share by Revenue
- 2.6 Mergers & Acquisitions, Expansion
3 Silica Sand Production by Region
- 3.1 Global Silica Sand Production Estimates and Forecasts by Region: 2019 VS 2023 VS 2030
- 3.2 Global Silica Sand Production by Region (2019-2030)
- 3.2.1 Global Silica Sand Production Market Share by Region (2019-2024)
- 3.2.2 Global Forecasted Production of Silica Sand by Region (2025-2030)
- 3.3 Global Silica Sand Production, Year-over-Year Growth
- 3.3.1 North America Silica Sand Production Estimates and Forecasts (2019-2030)
- 3.3.2 Europe Silica Sand Production Estimates and Forecasts (2019-2030)
- 3.3.3 China Silica Sand Production Estimates and Forecasts (2019-2030)
- 3.3.4 Australia Silica Sand Production Estimates and Forecasts (2019-2030)
4 Silica Sand Consumption and Revenue by Region
- 4.1 Global Silica Sand Consumption Estimates and Forecasts by Region: 2019 VS 2023 VS 2030
- 4.2 Global Silica Sand Consumption by Region (2019-2030)
- 4.2.1 Global Silica Sand Consumption by Region (2019-2030)
- 4.2.2 Global Silica Sand Forecasted Consumption by Region (2025-2030)
- 4.3 Global Silica Sand Revenue by Region (2019-2030)
- 4.3.1 Global Silica Sand Revenue by Region (2019-2030)
- 4.3.2 Global Silica Sand Forecasted Revenue by Region (2025-2030)
5 Silica Sand Consumption Countries
- 5.1 North America
- 5.1.1 North America Silica Sand Consumption Growth Rate by Country: 2019 VS 2023 VS 2030
- 5.1.2 North America Silica Sand Consumption by Country (2019-2030)
- 5.1.3 U.S.
- 5.1.4 Canada
- 5.1.5 Mexico
- 5.2 Europe
- 5.2.1 Europe Silica Sand Consumption Growth Rate by Country: 2019 VS 2023 VS 2030
- 5.2.2 Europe Silica Sand Consumption by Country (2019-2030)
- 5.2.3 Germany
- 5.2.4 France
- 5.2.5 U.K.
- 5.2.6 Italy
- 5.2.7 Benelux
- 5.3 Asia Pacific
- 5.3.1 Asia Pacific Silica Sand Consumption Growth Rate by Country: 2019 VS 2023 VS 2030
- 5.3.2 Asia Pacific Silica Sand Consumption by Region (2019-2030)
- 5.3.3 China
- 5.3.4 Japan
- 5.3.5 South Korea
- 5.3.6 Southeast Asia
- 5.3.7 India
- 5.4 South America
- 5.4.1 South America Silica Sand Consumption Growth Rate by Country: 2019 VS 2023 VS 2030
- 5.4.2 South America Silica Sand Consumption by Country (2019-2030)
- 5.4.3 Brazil
- 5.4.4 Argentina
- 5.5 Middle East & Africa
- 5.5.1 Middle East & Africa Silica Sand Consumption Growth Rate by Country: 2019 VS 2023 VS 2030
- 5.5.2 Middle East & Africa Silica Sand Consumption by Country (2019-2030)
- 5.5.3 Middle East
- 5.5.4 Africa
6 Segment by Type
- 6.1 Global Silica Sand Sales by Type (2019-2030)
- 6.1.1 Global Silica Sand Sales by Type (2019-2024)
- 6.1.2 Global Silica Sand Sales by Type (2025-2030)
- 6.1.3 Global Silica Sand Sales Market Share by Type (2019-2030)
- 6.2 Global Silica Sand Revenue by Type (2019-2030)
- 6.2.1 Global Silica Sand Revenue by Type (2019-2024)
- 6.2.2 Global Silica Sand Revenue by Type (2025-2030)
- 6.2.3 Global Silica Sand Revenue Market Share by Type (2019-2030)
- 6.3 Global Silica Sand Price by Type (2019-2030)
7 Segment by Application
- 7.1 Global Silica Sand Sales by Application (2019-2030)
- 7.1.1 Global Silica Sand Sales by Application (2019-2024)
- 7.1.2 Global Silica Sand Sales by Application (2025-2030)
- 7.1.3 Global Silica Sand Sales Market Share by Application (2019-2030)
- 7.2 Global Silica Sand Revenue by Application (2019-2030)
- 7.2.1 Global Silica Sand Revenue by Application (2019-2024)
- 7.2.2 Global Silica Sand Revenue by Application (2025-2030)
- 7.2.3 Global Silica Sand Revenue Market Share by Application (2019-2030)
- 7.3 Global Silica Sand Price by Application (2019-2030)
8 Key Companies Profiled
- 8.1 U.S. Silica
- 8.1.1 Company Profile
- 8.1.2 Product Information
- 8.1.3 Sales, Price, Cost, Gross and Revenue
- 8.1.4 Contact Information
- 8.2 Covia
- 8.2.1 Company Profile
- 8.2.2 Product Information
- 8.2.3 Sales, Price, Cost, Gross and Revenue
- 8.2.4 Contact Information
- 8.3 Sibelco
- 8.3.1 Company Profile
- 8.3.2 Product Information
- 8.3.3 Sales, Price, Cost, Gross and Revenue
- 8.3.4 Contact Information
- 8.4 Badger Mining
- 8.4.1 Company Profile
- 8.4.2 Product Information
- 8.4.3 Sales, Price, Cost, Gross and Revenue
- 8.4.4 Contact Information
- 8.5 Quarzwerke Group
- 8.5.1 Company Profile
- 8.5.2 Product Information
- 8.5.3 Sales, Price, Cost, Gross and Revenue
- 8.5.4 Contact Information
- 8.6 Preferred Sands
- 8.6.1 Company Profile
- 8.6.2 Product Information
- 8.6.3 Sales, Price, Cost, Gross and Revenue
- 8.6.4 Contact Information
- 8.7 Pattison Sand
- 8.7.1 Company Profile
- 8.7.2 Product Information
- 8.7.3 Sales, Price, Cost, Gross and Revenue
- 8.7.4 Contact Information
- 8.8 CNBM
- 8.8.1 Company Profile
- 8.8.2 Product Information
- 8.8.3 Sales, Price, Cost, Gross and Revenue
- 8.8.4 Contact Information
- 8.9 Kibing Glass
- 8.9.1 Company Profile
- 8.9.2 Product Information
- 8.9.3 Sales, Price, Cost, Gross and Revenue
- 8.9.4 Contact Information
- 8.10 Mitsubishi
- 8.10.1 Company Profile
- 8.10.2 Product Information
- 8.10.3 Sales, Price, Cost, Gross and Revenue
- 8.10.4 Contact Information
- 8.11 Minerali Industriali
- 8.11.1 Company Profile
- 8.11.2 Product Information
- 8.11.3 Sales, Price, Cost, Gross and Revenue
- 8.11.4 Contact Information
- 8.12 Fuyao Group
- 8.12.1 Company Profile
- 8.12.2 Product Information
- 8.12.3 Sales, Price, Cost, Gross and Revenue
- 8.12.4 Contact Information
- 8.13 Sisecam
- 8.13.1 Company Profile
- 8.13.2 Product Information
- 8.13.3 Sales, Price, Cost, Gross and Revenue
- 8.13.4 Contact Information
- 8.14 Shanyuan
- 8.14.1 Company Profile
- 8.14.2 Product Information
- 8.14.3 Sales, Price, Cost, Gross and Revenue
- 8.14.4 Contact Information
- 8.15 Lianxin Group
- 8.15.1 Company Profile
- 8.15.2 Product Information
- 8.15.3 Sales, Price, Cost, Gross and Revenue
- 8.15.4 Contact Information
- 8.16 Sifucel
- 8.16.1 Company Profile
- 8.16.2 Product Information
- 8.16.3 Sales, Price, Cost, Gross and Revenue
- 8.16.4 Contact Information
- 8.17 Tokai Sand
- 8.17.1 Company Profile
- 8.17.2 Product Information
- 8.17.3 Sales, Price, Cost, Gross and Revenue
- 8.17.4 Contact Information
- 8.18 Fulchiron
- 8.18.1 Company Profile
- 8.18.2 Product Information
- 8.18.3 Sales, Price, Cost, Gross and Revenue
- 8.18.4 Contact Information
- 8.19 Strobel Quarzsand
- 8.19.1 Company Profile
- 8.19.2 Product Information
- 8.19.3 Sales, Price, Cost, Gross and Revenue
- 8.19.4 Contact Information
- 8.20 Aggregate Industries
- 8.20.1 Company Profile
- 8.20.2 Product Information
- 8.20.3 Sales, Price, Cost, Gross and Revenue
- 8.20.4 Contact Information
- 8.21 Wolff & Muller
- 8.21.1 Company Profile
- 8.21.2 Product Information
- 8.21.3 Sales, Price, Cost, Gross and Revenue
- 8.21.4 Contact Information
- 8.22 Toyota Tsusho
- 8.22.1 Company Profile
- 8.22.2 Product Information
- 8.22.3 Sales, Price, Cost, Gross and Revenue
- 8.22.4 Contact Information
- 8.23 Duchang xinshiji
- 8.23.1 Company Profile
- 8.23.2 Product Information
- 8.23.3 Sales, Price, Cost, Gross and Revenue
- 8.23.4 Contact Information
- 8.24 Bathgate Silica Sand
- 8.24.1 Company Profile
- 8.24.2 Product Information
- 8.24.3 Sales, Price, Cost, Gross and Revenue
- 8.24.4 Contact Information
9 Industry Chain and Sales Channels Analysis
- 9.1 Silica Sand Key Raw Materials
- 9.2 Marketing Channels Status of Silica Sand
- 9.3 Market Positioning
- 9.3.1 Pricing Strategy
- 9.3.2 Brand Strategy
- 9.4 Customers Profiles of Silica Sand
10 Silica Sand Market Dynamics
- 10.1 Market Trends
- 10.2 Silica Sand Opportunities and Drivers
- 10.3 Silica Sand Market Challenges
- 10.4 Market Favorable Factors and Unfavorable Factors
- 10.5 Market Impact
- 10.6 Market Risks
- 10.7 Industry Enters Major Barriers
- 10.8 Porter's Five Forces Analysis
11 Research Findings and Conclusion
12 Methodology and Data Source
- 12.1 Methodology/Research Approach
- 12.1.1 Research Programs/Design
- 12.1.2 Market Size Estimation
- 12.1.3 Market Breakdown and Data Triangulation
- 12.2 Data Source
- 12.2.1 Secondary Sources
- 12.2.2 Primary Sources
- 12.3 Author List
- 12.4 Disclaimer

