
|
市場調査レポート
商品コード
1693892
北米の珪砂:市場シェア分析、産業動向、成長予測(2025年~2030年)North America Silica Sand - Market Share Analysis, Industry Trends & Statistics, Growth Forecasts (2025 - 2030) |
||||||
カスタマイズ可能
適宜更新あり
|
|||||||
| 北米の珪砂:市場シェア分析、産業動向、成長予測(2025年~2030年) |
|
出版日: 2025年03月18日
発行: Mordor Intelligence
ページ情報: 英文 100 Pages
納期: 2~3営業日
|

全表示
- 概要
- 目次
概要
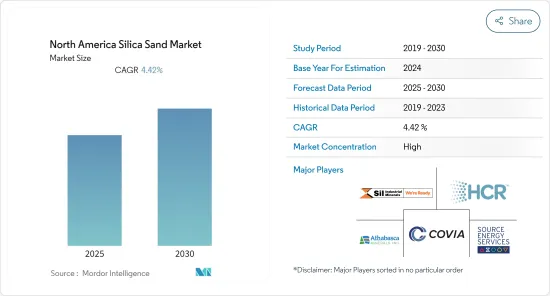
北米の珪砂市場は予測期間中にCAGR 4.42%を記録する見込み
主要ハイライト
- COVID-19パンデミックはいくつかの産業に悪影響を与えました。北米のほとんどの国で封鎖が行われたため、インフラや建設活動、採掘作業、貨物輸送に混乱が生じ、サプライチェーンに支障をきたしました。しかし、2021年には状況が回復し始め、市場の成長軌道が回復しました。
- 北米のガラス製造産業からの需要の増加と鋳造産業での消費は、調査した市場の成長を促進する主要因です。
- しかし、砂の違法採掘と珪砂の代替品の入手可能性は、調査した市場の成長を抑制する可能性が高いです。
- 歯科やバイオテクノロジーにおける砂を使った治療の開発は、調査した市場に有利な成長機会をもたらす可能性が高いです。
- 米国は石油・ガスとガラス製造産業からの珪砂消費が最も多いため、この地域で最大の珪砂市場を占めています。
北米シリカサンド市場動向
石油・ガス産業が市場を独占
- 珪砂は「水圧破砕砂」とも呼ばれ、石油・ガス会社が頁岩(けつがん)のような非在来型の浸透性の低い貯留層から天然ガス、天然ガス液、石油を生産するために使用する仕上げ方法である水圧破砕に使用されることに由来します。
- 珪砂は、天然ガス・石油・天然ガス液体を岩石の孔から放出するために頁岩を破砕する過程で不可欠です。高圧の水流が小さな穿孔を大きな亀裂に押し上げるとき、破砕砂はこれらの亀裂を開いた状態に保ち、化石燃料を放出し続ける。これらの割れ目を開くために白砂が使用される場合、それはプロパントと呼ばれます。プロパントが割れ目の莫大な圧力に耐えれば耐えるほど、より多くの石油を取り出すことができます。より多くの石油を抽出することができ、油井の効率を最大化することができます。
- 米国とカナダは世界最大の石油・ガス生産国のひとつです。カナダは世界第4位の石油生産国です。カナダの石油・ガス産業は、12の州と準州で直接・間接事業(オフショアを含む)を行っています。
- Energy Institute Statistical Review of World Energy 2023によると、2022年のカナダの石油生産量は2億7,400万トンで、世界シェアの6.2%を占めます。さらに、これは前年比で2.8%近い生産量の増加を示しています。
- さらに、カナダ石油生産者協会によると、カナダでの支出は2023年に400億米ドルに増加し、2022年比で11%増加すると予想されています。2023年のオイルサンドへの投資は115億米ドルに達する見込みであるのに対し、在来型石油・天然ガスの設備投資は285億米ドルと予測されています。
- 北米における原油と液体燃料の総生産量は、2021年の2,644万バレル/日に対し、2022年は2,781万バレル/日となりました。
- 米国は、非在来型原油埋蔵量の探査において世界有数の国であり、同国の調査市場にとって大きな機会であることを示しています。
- 米国は世界最大の石油・ガス消費国のひとつであり、輸出国でもあります。米国エネルギー情報局(EIA)によると、米国の2022年の原油生産量は平均1,190万バレル/日(b/d)で、2021年から70万b/d増加しました。また、2023年の生産量は1,280万b/dを超え、2019年に記録した1,230万b/dの年間平均記録を更新すると予想されています。
- 同地域における石油・ガス生産の着実な成長を考慮すると、珪砂の需要は予測期間中に拡大する可能性が高いです。
米国が地域市場を独占する
- 石油・ガス産業は同国の珪砂の主要な消費者です。米国エネルギー情報局によると、2022年の原油生産量は1,190万bpd(バレル/日)でした。これが2023年には平均1,241万B/D、2024年には1,280万B/Dになると推定されています。人口による熱消費の増加と工業用需要を満たすために、需要は急増すると予想されます。
- 米国では近年、全粒シリカの需要が増加しています。全粒シリカの市場は、新しい道路や建物の開発によって盛り上がっています。
- 建設産業は珪砂の最大消費者のひとつです。珪砂の物理的性質は通常の建設用砂とは異なります。珪砂の特性には、高いシリカ含有量と非常に低いレベルの有害な不純物といった化学的・物理的特性の組み合わせが含まれ、そのため珪砂の需要は最近の建設産業で増加しています。
- さらに、米国国勢調査局が作成した統計によると、2021年に1兆5,000億米ドルであった米国の新築年間建設額は、2022年には1兆6,600億米ドルに達しています。
- 米国における住宅建設の年間金額は、2021年の7億4,065万米ドルに対し、2022年は8億4,916万米ドルでした。2021年の7億5,918万米ドルに対し、2022年には8億843万米ドルとなり、短期的に珪砂の消費量が増加します。
- 鋳造砂は、鉄と非鉄金属鋳物の鋳型や中子を製造するために使用される、高い粘度を持つ均一な珪砂です。通常、80%以上の高品質珪砂、5~10%のベントナイト粘土、2~5%の水、5%以下の海炭から構成されています。珪砂のシリカレベルが高いため、鋳造産業は欠陥がなく、表面仕上げが優れた、完全性の高い鋳造品を製造することができます。自動車、建設、電子機器など様々な産業における鉄鋼とアルミニウムの需要の増加は、鋳造における珪砂の消費を押し上げると予測されています。
- 建設産業の成長に伴い、国内のセラミック産業も急成長が見込まれています。米国商務省と北米タイル協議会(TCNA)によると、2022年の米国の総セラミックタイル消費量は2億8,540万平方メートルでした。2022年の国内生産タイル量は約8,730万平方メートルで、2021年に比べ2.3%増加しました。
- その結果、同国の様々なエンドユーザー産業における需要と成長を考慮すると、米国の珪砂市場は今後数年間で安定した成長を遂げると予測されます。
北米の珪砂産業概要
北米の珪砂市場は統合型です。主要企業(順不同)には、Covia Holdings LLC、Hi-Crush Inc.、Source Energy Services Ltd.、Sil Industrial Minerals、Athabasca Minerals Inc.などが含まれます。
その他の特典
- エクセル形式の市場予測(ME)シート
- 3ヶ月間のアナリストサポート
目次
第1章 イントロダクション
- 調査の前提条件
- 調査範囲
第2章 調査手法
第3章 エグゼクティブサマリー
第4章 市場力学
- 促進要因
- ガラス産業からの需要拡大
- 鋳造産業における消費の増加
- その他の促進要因
- 抑制要因
- 代替品の入手可能性
- 砂の違法採掘
- 産業バリューチェーン分析
- ポーターのファイブフォース分析
- 供給企業の交渉力
- 買い手の交渉力
- 新規参入業者の脅威
- 代替品の脅威
- 競合の程度
第5章 市場セグメンテーション
- エンドユーザー産業
- ガラス製造
- 鋳造
- 化学製造
- 建設業
- 塗料・コーティング
- セラミックと耐火物
- 濾過
- 石油・ガス回収
- その他のエンドユーザー産業(食品加工、工業用研磨材、スポーツセグメント)
- 地域
- 米国
- カナダ
- メキシコ
第6章 競合情勢
- M&A、合弁事業、提携、協定
- 市場シェア(%)**/ランキング分析
- 主要企業の戦略
- 企業プロファイル
- Athabasca Minerals Inc.
- Atlas Sand Company, LLC
- Badger Mining Corporation
- Capital Sand Company
- Covia Holdings LLC
- Hi-Crush Inc.
- Sibelco
- Signal Peak Silica LLC
- Sil Industrial Minerals
- Source Energy Services Ltd.
- Superior Silica Sands
- U.S. Silica
第7章 市場機会と今後の動向
- 水処理産業における将来機会
- 歯科とバイオテクノロジーにおける砂を使った治療の開発
目次
Product Code: 50000792
The North America Silica Sand Market is expected to register a CAGR of 4.42% during the forecast period.
Key Highlights
- The COVID-19 pandemic affected several industries negatively. The lockdown in most countries in North America caused disruptions in infrastructure and construction activities, mining operations, and freight transportation which disturbed the supply chain. However, the conditions started recovering in 2021, restoring the market's growth trajectory.
- The growing demand from the glass production industry in North America and consumption in the foundry industry are major factors driving the growth of the market studied.
- However, the illegal mining of sand and the availability of substitutes for silica sand are likely to restrain the growth of the studied market.
- Nevertheless, the development of sand-based treatments in dentistry and biotechnology is likely to create lucrative growth opportunities for the studied market.
- The United States represents the largest market for silica sand in the region owing to the highest consumption of silica sand from the oil and gas and glass production industries.
North America Silica Sand Market Trends
Oil and Gas Industry to Dominate the Market
- Silica sand, also known as "frac sand," comes from its use in hydraulic fracturing, a completion method used by oil and gas companies to produce natural gas, natural gas liquids, and oil from unconventional, low permeability reservoirs such as shale.
- Silica sand is essential in the process of fracturing shale to release natural gas, oil, and natural gas liquids from pores in the rock. When the high-pressure water stream forces the small perforations to become larger fractures, fracking sand keeps these fractures open to continue releasing fossil fuels. When white sand is used to prop open these fractures, it is referred to as a proppant. The longer the proppant can withstand the enormous pressure of the fractures. The more petroleum can be extracted, maximizing the well's efficiency.
- The United States and Canada are among the world's largest Oil and Gas producers. Canada is the world's fourth-largest producer of oil. The Canadian oil and gas industry has direct and indirect operations (including offshore) in twelve provinces and territories.
- According to the Energy Institute Statistical Review of World Energy 2023, Canada's oil production in 2022 was 274 million tonnes, accounting for 6.2% of the global share. Further, this represents a nearly 2.8% increase in production over the previous year.
- Additionally, according to the Canadian Association of Petroleum Producers, spending in Canada is expected to rise to USD 40 billion in 2023, 11% more compared to 2022. Oil sands investment for 2023 is expected to reach USD 11.5 billion, whereas conventional oil and natural gas capital investment is projected at USD 28.5 billion.
- The total production of crude oil and liquid fuels in North America was 27.81 million barrels per day in 2022, compared to 26.44 million barrels per day in 2021.
- The United States is one of the leading countries globally in the exploration of unconventional crude oil reserves, indicating a massive opportunity for the studied market in the country.
- The United States is one of the world's largest consumers and exporters of oil and gas. According to U.S. Energy Information Administration (EIA), crude oil production in the United States was an average of 11.9 million barrels per day (b/d) in 2022, up 0.7 million b/d from 2021. Also, the output will is expected to exceed 12.8 million b/d in 2023, breaking the previous annual average record of 12.3 million b/d set in 2019.
- Considering the steady growth of oil and gas production in the region, the demand for silica sand is likely to grow during the forecast period.
United States to Dominate the Regional Market
- The oil and gas industry is the country's major consumer of silica sand. According to the US Energy Information Administration, the crude oil output was 11.9 million bpd (barrels per day) in 2022. This is estimated to average 12.41 million bpd by 2023 and 12.8 million bpd in 2024. With the increase in heat consumption by the population and to meet the industrial requirement, the demand is expected to surge.
- The demand for whole-grain silica has increased in the United States in recent years. The market for whole-grain silica is being boosted by the development of new roads and buildings.
- The construction industry is one of the largest consumers of silica sand. The physical properties of silica sands are different from the normal construction sands. The properties of silica sand include the combination of chemical and physical properties, such as high silica content and very low levels of deleterious impurities, for which the demand for silica sand has been increasing in the construction industry in recent times.
- Additionally, as per further statistics generated by the US Census Bureau, the annual value for new construction put in place in the United States accounted for USD 1.66 trillion in 2022, compared to USD 1.50 trillion in 2021.
- The annual value of residential construction put in place in the United States was valued at USD 849.16 million in 2022, compared to USD 740.65 million in 2021. The annual value of non-residential construction put in place in the country was valued at USD 808.43 million in 2022, compared to USD 759.18 million in 2021, thereby increasing the consumption of silica sand in the short term.
- Foundry sand is a uniform silica sand of high consistency that is used to produce molds and cores for ferrous and nonferrous metal castings. It typically comprises more than 80% high-quality silica sand, 5-10% bentonite clay, 2 to 5% water, and less than 5% sea coal. Because of the high silica levels of silica sand, the foundry industry can produce high-integrity castings, free of defects and with superior surface finishes. The rising demand for steel and aluminum in various industries, including automotive, construction, and electronics, is projected to boost the consumption of silica sand in the foundry.
- With the growing construction industry, the ceramic industry in the country is expected to grow rapidly. According to the US Department of Commerce and Tile Council of North America (TCNA), total ceramic tile consumption in the United States was 285.4 million square meters in 2022. The volume of domestically produced tile was around 87.3 million square meters in 2022, up 2.3% in 2021.
- Consequently, given the demand and growth across various end-user industries in the country, the silica sand market in the United States is forecasted to witness steady growth in the coming years.
North America Silica Sand Industry Overview
The North America silica sand market is consolidated in nature. The major players (not in any particular order) include Covia Holdings LLC, Hi-Crush Inc., Source Energy Services Ltd., Sil Industrial Minerals, and Athabasca Minerals Inc., among others.
Additional Benefits:
- The market estimate (ME) sheet in Excel format
- 3 months of analyst support
TABLE OF CONTENTS
1 INTRODUCTION
- 1.1 Study Assumptions
- 1.2 Scope of the Study
2 RESEARCH METHODOLOGY
3 EXECUTIVE SUMMARY
4 MARKET DYNAMICS
- 4.1 Drivers
- 4.1.1 Growing Demand from the Glass Industry
- 4.1.2 Increasing Consumption in the Foundry Industry
- 4.1.3 Other Drivers
- 4.2 Restraints
- 4.2.1 Availability of Substitutes
- 4.2.2 Illegal Mining of Sand
- 4.3 Industry Value Chain Analysis
- 4.4 Porter's Five Forces Analysis
- 4.4.1 Bargaining Power of Suppliers
- 4.4.2 Bargaining power of Buyers
- 4.4.3 Threat of New Entrants
- 4.4.4 Threat of Substitute Products and Services
- 4.4.5 Degree of Competition
5 MARKET SEGMENTATION (Market Size in Volume)
- 5.1 End-User Industry
- 5.1.1 Glass Manufacturing
- 5.1.2 Foundry
- 5.1.3 Chemical Production
- 5.1.4 Construction
- 5.1.5 Paints and Coatings
- 5.1.6 Ceramics and Refractories
- 5.1.7 Filtration
- 5.1.8 Oil and Gas Recovery
- 5.1.9 Other End User Industries (Food Processing, Industrial Abrasives and Sports Fields)
- 5.2 Geography
- 5.2.1 United States
- 5.2.2 Canada
- 5.2.3 Mexico
6 COMPETITIVE LANDSCAPE
- 6.1 Merger & Acquisitions, Joint Ventures, Collaborations, and Agreements
- 6.2 Market Share (%)**/Ranking Analysis
- 6.3 Strategies Adopted by Leading Players
- 6.4 Company Profiles
- 6.4.1 Athabasca Minerals Inc.
- 6.4.2 Atlas Sand Company, LLC
- 6.4.3 Badger Mining Corporation
- 6.4.4 Capital Sand Company
- 6.4.5 Covia Holdings LLC
- 6.4.6 Hi-Crush Inc.
- 6.4.7 Sibelco
- 6.4.8 Signal Peak Silica LLC
- 6.4.9 Sil Industrial Minerals
- 6.4.10 Source Energy Services Ltd.
- 6.4.11 Superior Silica Sands
- 6.4.12 U.S. Silica
7 MARKET OPPORTUNITIES AND FUTURE TRENDS
- 7.1 Future Opportunities in the Water Treatment Industry
- 7.2 Development of Sand-based Treatments in Dentistry and Biotechnology
