|
|
市場調査レポート
商品コード
1462828
再生可能合成燃料の世界市場:市場シェアおよびランキング・全体の売上および需要予測 (2024-2030年)Renewable Synfuels - Global Market Share and Ranking, Overall Sales and Demand Forecast 2024-2030 |
||||||
|
|||||||
カスタマイズ可能
適宜更新あり
|
|||||||

| 再生可能合成燃料の世界市場:市場シェアおよびランキング・全体の売上および需要予測 (2024-2030年) |
|
出版日: 2024年04月13日
発行: QYResearch
ページ情報: 英文 207 Pages
納期: 2~3営業日
|

全表示
- 概要
- 図表
- 目次
世界の再生可能合成燃料の市場規模は、2023年の1,340億米ドルから、予測期間中は14.23%のCAGRで推移し、2030年には3,730億米ドルの規模に成長すると予測されています。
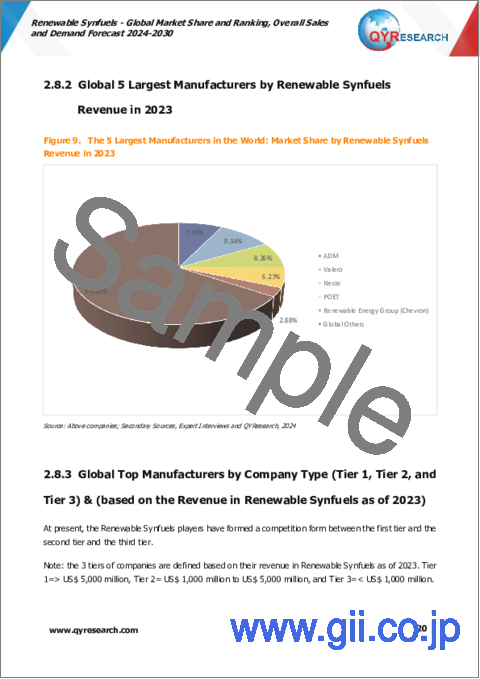
世界の再生可能合成燃料の主要企業には、ADM、Valero、Neste、POET、Renewable Energy Group(Chevron)、Raizen、Saipol、Green Plains、Alto Ingredientsなどがあります。2023年には、世界の大手5社が収益で約34.18%のシェアを占めています。
当レポートでは、世界の再生可能合成燃料の市場を調査し、市場および製品の概要、市場成長への各種影響因子の分析、市場規模の推移・予測、タイプ別・用途別、地域・主要国別の詳細分析、競合環境、市場シェア、ランキング、主要企業のプロファイルなどをまとめています。
目次
第1章 市場概要
- 再生可能合成燃料:製品概要
- 世界市場の規模・予測
- 販売額
- 販売量
- 販売価格
- 市場動向と促進要因
- 産業動向
- 市場促進要因・機会
- 市場課題・制約
- 前提と制限
- 調査目的
- 調査年数
第2章 競合分析:企業別
- 世界の再生可能合成燃料企業:収益ランキング
- 世界の再生可能合成燃料収益:企業別
- 世界の再生可能合成燃料企業:販売量ランキング
- 世界の再生可能合成燃料販売量:企業別
- 世界の再生可能合成燃料の平均価格:企業別
- 主要製造業者:製造拠点および本社
- 主要製造業者:提供製品
- 競合分析
- M&A・拡大
第3章 タイプ別セグメント
- タイプ別概要
- バイオディーゼル
- バイオエタノール
- 再生可能天然ガス
- 電子燃料
- 販売額の推移・予測:タイプ別
- 販売量の推移・予測:タイプ別
- 平均価格の推移・予測
第4章 用途別セグメント
- 用途別概要
- 道路輸送
- 配送
- 航空
- 産業
- 発電
- 暖房
- 販売額の推移・予測:用途別
- 販売量の推移・予測:用途別
- 平均価格の推移・予測
第5章 地域別セグメント
- 販売額の推移・予測:地域別
- 販売量の推移・予測:地域別
- 平均価格の推移・予測
- 北米
- 欧州
- アジア太平洋
- 中東・アフリカ
第6章 主要国/地域別セグメント
- 主要国/地域別の販売額・成長動向:2019年 vs 2023年 vs 2030年
- 主要国/地域別の販売額・販売量の推移・予測
- 米国
- 欧州
- 中国
- インド
- 東南アジア
- ラテンアメリカ
第7章 企業プロファイル
- ADM
- Valero
- Neste
- POET
- Renewable Energy Group(Chevron)
- Raizen
- Saipol
- Green Plains
- Alto Ingredients
- CropEnergies
- The Andersons
- Verbio
- TotalEnergies
- Cargill
- Zhuoyue New Energy
- Nature Energy(Shell)
- HIF Global
- Liquid Wind
- Infinium
- Norsk e-Fuel
- Nordic Electrofuel
- European Energy
第8章 産業チェーン分析
- 産業チェーン
- 上流分析
- 中流分析
- 下流分析(顧客分析)
- 販売モデルと販売チャネル
第9章 調査結果・総論
第10章 付録
List of Tables
- Table 1. Renewable Synfuels Market Trends
- Table 2. Renewable Synfuels Market Drivers & Opportunity
- Table 3. Renewable Synfuels Market Challenges and Restraints
- Table 4. Global Renewable Synfuels Revenue by Company (2019-2024) & (US$ Million)
- Table 5. Global Renewable Synfuels Revenue Market Share by Company (2019-2024)
- Table 6. Global Renewable Synfuels Sales Volume by Company (2019-2024) & (K MT)
- Table 7. Global Renewable Synfuels Sales Volume Market Share by Company (2019-2024)
- Table 8. Global Market Renewable Synfuels Price by Company (2019-2024) & (US$/MT)
- Table 9. Key Manufacturers Renewable Synfuels Manufacturing Base and Headquarters
- Table 10. Key Manufacturers Renewable Synfuels Product Type
- Table 11. Global Renewable Synfuels Manufacturers Market Concentration Ratio (CR5 and HHI)
- Table 12. Global Top Manufacturers Market Share by Company Type (Tier 1, Tier 2, and Tier 3) & (based on the Revenue in Renewable Synfuels as of 2023)
- Table 13. Mergers & Acquisitions, Expansion Plans
- Table 14. Global Renewable Synfuels Sales Value by Type: 2019 VS 2023 VS 2030 (US$ Million)
- Table 15. Global Renewable Synfuels Sales Value by Type (2019-2024) & (US$ Million)
- Table 16. Global Renewable Synfuels Sales Value by Type (2025-2030) & (US$ Million)
- Table 17. Global Renewable Synfuels Sales Market Share in Value by Type (2019-2024)
- Table 18. Global Renewable Synfuels Sales Market Share in Value by Type (2025-2030)
- Table 19. Global Renewable Synfuels Sales Volume by Type: 2019 VS 2023 VS 2030 (K MT)
- Table 20. Global Renewable Synfuels Sales Volume by Type (2019-2024) & (K MT)
- Table 21. Global Renewable Synfuels Sales Volume by Type (2025-2030) & (K MT)
- Table 22. Global Renewable Synfuels Sales Market Share in Value by Type (2019-2024)
- Table 23. Global Renewable Synfuels Sales Market Share in Value by Type (2025-2030)
- Table 24. Global Renewable Synfuels Price by Type (2019-2024) & (US$/MT)
- Table 25. Global Renewable Synfuels Price by Type (2025-2030) & (US$/MT)
- Table 26. Global Renewable Synfuels Sales Value by Application: 2019 VS 2023 VS 2030 (US$ Million)
- Table 27. Global Renewable Synfuels Sales Value by Application (2019-2024) & (US$ Million)
- Table 28. Global Renewable Synfuels Sales Value by Application (2025-2030) & (US$ Million)
- Table 29. Global Renewable Synfuels Sales Market Share in Value by Application (2019-2024)
- Table 30. Global Renewable Synfuels Sales Market Share in Value by Application (2025-2030)
- Table 31. Global Renewable Synfuels Sales Volume by Application: 2019 VS 2023 VS 2030 (K MT)
- Table 32. Global Renewable Synfuels Sales Volume by Application (2019-2024) & (K MT)
- Table 33. Global Renewable Synfuels Sales Volume by Application (2025-2030) & (K MT)
- Table 34. Global Renewable Synfuels Sales Market Share in Value by Application (2019-2024)
- Table 35. Global Renewable Synfuels Sales Market Share in Value by Application (2025-2030)
- Table 36. Global Renewable Synfuels Price by Application (2019-2024) & (US$/MT)
- Table 37. Global Renewable Synfuels Price by Application (2025-2030) & (US$/MT)
- Table 38. Global Renewable Synfuels Sales Value by Region, (2019 VS 2023 VS 2030) & (US$ Million)
- Table 39. Global Renewable Synfuels Sales Value by Region (2019-2024) & (US$ Million)
- Table 40. Global Renewable Synfuels Sales Value by Region (2025-2030) & (US$ Million)
- Table 41. Global Renewable Synfuels Sales Value by Region (2019-2024) & (%)
- Table 42. Global Renewable Synfuels Sales Value by Region (2025-2030) & (%)
- Table 43. Global Renewable Synfuels Sales Volume by Region (K MT): 2019 VS 2023 VS 2030
- Table 44. Global Renewable Synfuels Sales Volume by Region (2019-2024) & (K MT)
- Table 45. Global Renewable Synfuels Sales Volume by Region (2025-2030) & (K MT)
- Table 46. Global Renewable Synfuels Sales Volume by Region (2019-2024) & (%)
- Table 47. Global Renewable Synfuels Sales Volume by Region (2025-2030) & (%)
- Table 48. Global Renewable Synfuels Average Price by Region (2019-2024) & (US$/MT)
- Table 49. Global Renewable Synfuels Average Price by Region (2025-2030) & (US$/MT)
- Table 50. Key Countries/Regions Renewable Synfuels Sales Value Growth Trends, (US$ Million): 2019 VS 2023 VS 2030
- Table 51. Key Countries/Regions Renewable Synfuels Sales Value, (2019-2024) & (US$ Million)
- Table 52. Key Countries/Regions Renewable Synfuels Sales Value, (2025-2030) & (US$ Million)
- Table 53. Key Countries/Regions Renewable Synfuels Sales Volume, (2019-2024) & (K MT)
- Table 54. Key Countries/Regions Renewable Synfuels Sales Volume, (2025-2030) & (K MT)
- Table 55. ADM Company Information
- Table 56. ADM Introduction and Business Overview
- Table 57. ADM Renewable Synfuels Sales (K MT), Revenue (US$ Million), Price (US$/MT) and Gross Margin (2019-2024)
- Table 58. ADM Renewable Synfuels Product Offerings
- Table 59. ADM Recent Development
- Table 60. Valero Company Information
- Table 61. Valero Introduction and Business Overview
- Table 62. Valero Renewable Synfuels Sales (K MT), Revenue (US$ Million), Price (US$/MT) and Gross Margin (2019-2024)
- Table 63. Valero Renewable Synfuels Product Offerings
- Table 64. Valero Recent Development
- Table 65. Neste Company Information
- Table 66. Neste Introduction and Business Overview
- Table 67. Neste Renewable Synfuels Sales (K MT), Revenue (US$ Million), Price (US$/MT) and Gross Margin (2019-2024)
- Table 68. Neste Renewable Synfuels Product Offerings
- Table 69. Neste Recent Development
- Table 70. POET Company Information
- Table 71. POET Introduction and Business Overview
- Table 72. POET Renewable Synfuels Sales (K MT), Revenue (US$ Million), Price (US$/MT) and Gross Margin (2019-2024)
- Table 73. POET Renewable Synfuels Product Offerings
- Table 74. POET Recent Development
- Table 75. Renewable Energy Group (Chevron) Company Information
- Table 76. Renewable Energy Group (Chevron) Introduction and Business Overview
- Table 77. Renewable Energy Group (Chevron) Renewable Synfuels Sales (K MT), Revenue (US$ Million), Price (US$/MT) and Gross Margin (2019-2024)
- Table 78. Renewable Energy Group (Chevron) Renewable Synfuels Product Offerings
- Table 79. Renewable Energy Group (Chevron) Recent Development
- Table 80. Raizen Company Information
- Table 81. Raizen Introduction and Business Overview
- Table 82. Raizen Renewable Synfuels Sales (K MT), Revenue (US$ Million), Price (US$/MT) and Gross Margin (2019-2024)
- Table 83. Raizen Renewable Synfuels Product Offerings
- Table 84. Raizen Recent Development
- Table 85. Saipol Company Information
- Table 86. Saipol Introduction and Business Overview
- Table 87. Saipol Renewable Synfuels Sales (K MT), Revenue (US$ Million), Price (US$/MT) and Gross Margin (2019-2024)
- Table 88. Saipol Renewable Synfuels Product Offerings
- Table 89. Saipol Recent Development
- Table 90. Green Plains Company Information
- Table 91. Green Plains Introduction and Business Overview
- Table 92. Green Plains Renewable Synfuels Sales (K MT), Revenue (US$ Million), Price (US$/MT) and Gross Margin (2019-2024)
- Table 93. Green Plains Renewable Synfuels Product Offerings
- Table 94. Green Plains Recent Development
- Table 95. Alto Ingredients Company Information
- Table 96. Alto Ingredients Introduction and Business Overview
- Table 97. Alto Ingredients Renewable Synfuels Sales (K MT), Revenue (US$ Million), Price (US$/MT) and Gross Margin (2019-2024)
- Table 98. Alto Ingredients Renewable Synfuels Product Offerings
- Table 99. Alto Ingredients Recent Development
- Table 100. CropEnergies Company Information
- Table 101. CropEnergies Introduction and Business Overview
- Table 102. CropEnergies Renewable Synfuels Sales (K MT), Revenue (US$ Million), Price (US$/MT) and Gross Margin (2019-2024)
- Table 103. CropEnergies Renewable Synfuels Product Offerings
- Table 104. CropEnergies Recent Development
- Table 105. The Andersons Company Information
- Table 106. The Andersons Introduction and Business Overview
- Table 107. The Andersons Renewable Synfuels Sales (K MT), Revenue (US$ Million), Price (US$/MT) and Gross Margin (2019-2024)
- Table 108. The Andersons Renewable Synfuels Product Offerings
- Table 109. The Andersons Recent Development
- Table 110. Verbio Company Information
- Table 111. Verbio Introduction and Business Overview
- Table 112. Verbio Renewable Synfuels Sales (K MT), Revenue (US$ Million), Price (US$/MT) and Gross Margin (2019-2024)
- Table 113. Verbio Renewable Synfuels Product Offerings
- Table 114. Verbio Recent Development
- Table 115. TotalEnergies Company Information
- Table 116. TotalEnergies Introduction and Business Overview
- Table 117. TotalEnergies Renewable Synfuels Sales (K MT), Revenue (US$ Million), Price (US$/MT) and Gross Margin (2019-2024)
- Table 118. TotalEnergies Renewable Synfuels Product Offerings
- Table 119. TotalEnergies Recent Development
- Table 120. Cargill Company Information
- Table 121. Cargill Introduction and Business Overview
- Table 122. Cargill Renewable Synfuels Sales (K MT), Revenue (US$ Million), Price (US$/MT) and Gross Margin (2019-2024)
- Table 123. Cargill Renewable Synfuels Product Offerings
- Table 124. Cargill Recent Development
- Table 125. Zhuoyue New Energy Company Information
- Table 126. Zhuoyue New Energy Introduction and Business Overview
- Table 127. Zhuoyue New Energy Renewable Synfuels Sales (K MT), Revenue (US$ Million), Price (US$/MT) and Gross Margin (2019-2024)
- Table 128. Zhuoyue New Energy Renewable Synfuels Product Offerings
- Table 129. Nature Energy (Shell) Company Information
- Table 130. Nature Energy (Shell) Introduction and Business Overview
- Table 131. Nature Energy (Shell) Renewable Synfuels Sales (K MT), Revenue (US$ Million), Price (US$/MT) and Gross Margin (2019-2024)
- Table 132. Nature Energy (Shell) Renewable Synfuels Product Offerings
- Table 133. Nature Energy (Shell) Recent Development
- Table 134. HIF Global Company Information
- Table 135. HIF Global Introduction and Business Overview
- Table 136. HIF Global Renewable Synfuels Projects
- Table 137. HIF Global Recent Development
- Table 138. Liquid Wind Company Information
- Table 139. Liquid Wind Introduction and Business Overview
- Table 140. Liquid Wind Renewable Synfuels Product Offerings
- Table 141. Liquid Wind Renewable Synfuels Projects
- Table 142. Liquid Wind Recent Development
- Table 143. Infinium Company Information
- Table 144. Infinium Introduction and Business Overview
- Table 145. Infinium Renewable Synfuels Product Offerings
- Table 146. Infinium Renewable Synfuels Projects
- Table 147. Infinium Recent Development
- Table 148. Norsk e-Fuel Company Information
- Table 149. Norsk e-Fuel Introduction and Business Overview
- Table 150. Norsk e-Fuel Renewable Synfuels Product Offerings
- Table 151. Norsk e-Fuel Renewable Synfuels Projects
- Table 152. Norsk e-Fuel Recent Development
- Table 153. Nordic Electrofuel Company Information
- Table 154. Nordic Electrofuel Introduction and Business Overview
- Table 155. Nordic Electrofuel Renewable Synfuels Projects
- Table 156. Nordic Electrofuel Recent Development
- Table 157. European Energy Company Information
- Table 158. European Energy Introduction and Business Overview
- Table 159. European Energy Renewable Synfuels Product Offerings
- Table 160. European Energy Renewable Synfuels Projects
- Table 161. European Energy Recent Development
- Table 162. Key Raw Materials Lists
- Table 163. Renewable Synfuels Downstream Customers
- Table 164. Renewable Synfuels Distributors List
- Table 165. Research Programs/Design for This Report
- Table 166. Key Data Information from Secondary Sources
- Table 167. Key Data Information from Primary Sources
List of Figures
- Figure 1. Renewable Synfuels Product Picture
- Figure 2. Global Renewable Synfuels Sales Value, 2019 VS 2024 VS 2030 (US$ Million)
- Figure 3. Global Renewable Synfuels Sales Value (2019-2030) & (US$ Million)
- Figure 4. Global Renewable Synfuels Sales Volume (2019-2030) & (K MT)
- Figure 5. Global Renewable Synfuels Sales Price (2019-2030) & (US$/MT)
- Figure 6. Renewable Synfuels Report Years Considered
- Figure 7. Global Renewable Synfuels Players Revenue Ranking (2023) & (US$ Million)
- Figure 8. Global Renewable Synfuels Players Sales Volume Ranking (2023) & (K MT)
- Figure 9. The 5 Largest Manufacturers in the World: Market Share by Renewable Synfuels Revenue in 2023
- Figure 10. Renewable Synfuels Market Share by Company Type (Tier 1, Tier 2, and Tier 3): 2019 VS 2023
- Figure 11. Biodiesel Picture
- Figure 12. Bioethanol Picture
- Figure 13. Renewable Natural Gas Picture
- Figure 14. eFuels Picture
- Figure 15. Global Renewable Synfuels Sales Value by Type (2019 VS 2023 VS 2030) & (US$ Million)
- Figure 16. Global Renewable Synfuels Sales Value Market Share by Type, 2023
- Figure 17. Global Renewable Synfuels Sales Value Market Share by Type, 2030
- Figure 18. Global Renewable Synfuels Sales Volume Market Share by Type, 2023
- Figure 19. Global Renewable Synfuels Sales Volume Market Share by Type, 2030
- Figure 20. Global Renewable Synfuels Price by Type (2019-2030) & (US$/MT)
- Figure 21. Product Picture of Road Transport
- Figure 22. Product Picture of Shipping
- Figure 23. Product Picture of Aviation
- Figure 24. Product Picture of Industrial
- Figure 25. Product Picture of Power Generation
- Figure 26. Product Picture of Heating
- Figure 27. Global Renewable Synfuels Sales Value by Application (2019 VS 2023 VS 2030) & (US$ Million)
- Figure 28. Global Renewable Synfuels Sales Value Market Share by Application, 2023
- Figure 29. Global Renewable Synfuels Sales Value Market Share by Application, 2030
- Figure 30. Global Renewable Synfuels Sales Volume Market Share by Application, 2023
- Figure 31. Global Renewable Synfuels Sales Volume Market Share by Application, 2030
- Figure 32. Global Renewable Synfuels Price by Application (2019-2030) & (US$/MT)
- Figure 33. North America Renewable Synfuels Sales Value (2019-2030) & (US$ Million)
- Figure 34. North America Renewable Synfuels Sales Value by Country (%), 2023
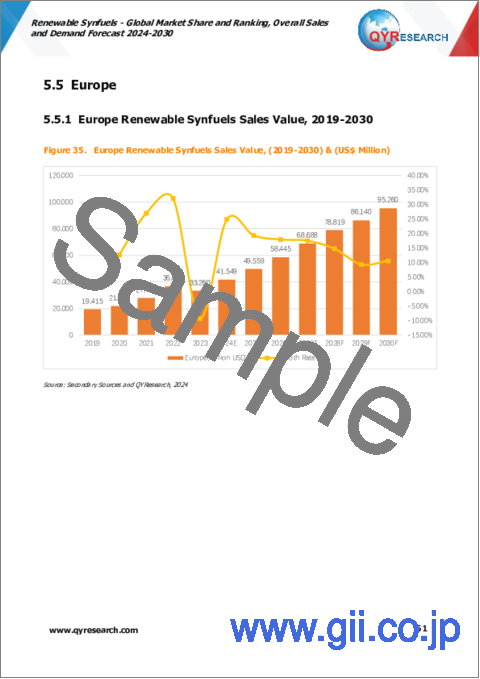
- Figure 35. Europe Renewable Synfuels Sales Value, (2019-2030) & (US$ Million)
- Figure 36. Europe Renewable Synfuels Sales Value by Country (%), 2023
- Figure 37. Asia Pacific Renewable Synfuels Sales Value, (2019-2030) & (US$ Million)
- Figure 38. Asia Pacific Renewable Synfuels Sales Value by Region (%), 2023
- Figure 39. Latin America Renewable Synfuels Sales Value, (2019-2030) & (US$ Million)
- Figure 40. Latin America Renewable Synfuels Sales Value by Country (%), 2023
- Figure 41. Middle East & Africa Renewable Synfuels Sales Value, (2019-2030) & (US$ Million)
- Figure 42. Middle East & Africa Renewable Synfuels Sales Value by Country (%), 2023
- Figure 43. Key Countries/Regions Renewable Synfuels Sales Value (%), (2019-2030)
- Figure 44. Key Countries/Regions Renewable Synfuels Sales Volume (%), (2019-2030)
- Figure 45. United States Renewable Synfuels Sales Value, (2019-2030) & (US$ Million)
- Figure 46. United States Renewable Synfuels Sales Value by Type (%), 2023
- Figure 47. United States Renewable Synfuels Sales Value by Application (%), 2023
- Figure 48. Europe Renewable Synfuels Sales Value, (2019-2030) & (US$ Million)
- Figure 49. Europe Renewable Synfuels Sales Value by Type (%), 2023
- Figure 50. Europe Renewable Synfuels Sales Value by Application (%), 2023
- Figure 51. China Renewable Synfuels Sales Value, (2019-2030) & (US$ Million)
- Figure 52. China Renewable Synfuels Sales Value by Type (%), 2023
- Figure 53. China Renewable Synfuels Sales Value by Application (%), 2023
- Figure 54. India Renewable Synfuels Sales Value, (2019-2030) & (US$ Million)
- Figure 55. India Renewable Synfuels Sales Value by Type (%), 2023
- Figure 56. India Renewable Synfuels Sales Value by Application (%), 2023
- Figure 57. Southeast Asia Renewable Synfuels Sales Value, (2019-2030) & (US$ Million)
- Figure 58. Southeast Asia Renewable Synfuels Sales Value by Type (%), 2023
- Figure 59. Southeast Asia Renewable Synfuels Sales Value by Application (%), 2023
- Figure 60. Latin America Renewable Synfuels Sales Value, (2019-2030) & (US$ Million)
- Figure 61. Latin America Renewable Synfuels Sales Value by Type (%), 2023 VS 2030
- Figure 62. Latin America Renewable Synfuels Sales Value by Application (%), 2023 VS 2030
- Figure 63. Renewable Synfuels Industrial Chain
- Figure 64. Renewable Synfuels Manufacturing Cost Structure
- Figure 65. Channels of Distribution (Direct Sales, and Distribution)
- Figure 66. Bottom-up and Top-down Approaches for This Report
- Figure 67. Data Triangulation
- Figure 68. Key Executives Interviewed
The global market for Renewable Synfuels was estimated to be worth US$ 134 billion in 2023 and is forecast to a readjusted size of US$ 373 billion by 2030 with a CAGR of 14.23% during the forecast period 2024-2030.
The global key companies of Renewable Synfuels include ADM, Valero, Neste, POET, Renewable Energy Group (Chevron), Raizen, Saipol, Green Plains, and Alto Ingredients, etc. In 2023, the global five largest players hold a share approximately34.18% in terms of revenue.
This report aims to provide a comprehensive presentation of the global market for Renewable Synfuels, focusing on the total sales volume, sales revenue, price, key companies market share and ranking, together with an analysis of Renewable Synfuels by region & country, by Type, and by Application.
The Renewable Synfuels market size, estimations, and forecasts are provided in terms of sales volume (K MT) and sales revenue ($ millions), considering 2023 as the base year, with history and forecast data for the period from 2019 to 2030. With both quantitative and qualitative analysis, to help readers develop business/growth strategies, assess the market competitive situation, analyze their position in the current marketplace, and make informed business decisions regarding Renewable Synfuels.
Market Segmentation
By Company
- ADM
- Valero
- Neste
- POET
- Renewable Energy Group (Chevron)
- Raizen
- Saipol
- Green Plains
- Alto Ingredients
- CropEnergies
- The Andersons
- Verbio
- Total
- Cargill
- Zhuoyue New Energy
- Nature Energy (Shell)
Segment by Type
- Biodiesel
- Bioethanol
- Renewable Natural Gas
- eFuels
Segment by Application
- Road Transport
- Shipping
- Aviation
- Industrial
- Power Generation
- Heating
- Others
By Region
- North America
- United States
- Canada
- Asia-Pacific
- China
- Japan
- South Korea
- Southeast Asia
- India
- Rest of Asia-Pacific
- Europe
- Germany
- France
- U.K.
- Italy
- Nordic Countries
- Rest of Europe
- Latin America
- Mexico
- Brazil
- Argentina
- Rest of Latin America
- Middle East & Africa
- Middle East
- Africa
Chapter Outline
Chapter 1: Introduces the report scope of the report, global total market size (valve, volume and price). This chapter also provides the market dynamics, latest developments of the market, the driving factors and restrictive factors of the market, the challenges and risks faced by manufacturers in the industry, and the analysis of relevant policies in the industry.
Chapter 2: Detailed analysis of Renewable Synfuels manufacturers competitive landscape, price, sales and revenue market share, latest development plan, merger, and acquisition information, etc.
Chapter 3: Provides the analysis of various market segments by Type, covering the market size and development potential of each market segment, to help readers find the blue ocean market in different market segments.
Chapter 4: Provides the analysis of various market segments by Application, covering the market size and development potential of each market segment, to help readers find the blue ocean market in different downstream markets.
Chapter 5: Sales, revenue of Renewable Synfuels in regional level. It provides a quantitative analysis of the market size and development potential of each region and introduces the market development, future development prospects, market space, and market size of each country in the world.
Chapter 6: Sales, revenue of Renewable Synfuels in country level. It provides sigmate data by Type, and by Application for each country/region.
Chapter 7: Provides profiles of key players, introducing the basic situation of the main companies in the market in detail, including product sales, revenue, price, gross margin, product introduction, recent development, etc.
Chapter 8: Analysis of industrial chain, including the upstream and downstream of the industry.
Chapter 9: Conclusion.
Table of Contents
1 Market Overview
- 1.1 Renewable Synfuels Product Introduction
- 1.2 Global Renewable Synfuels Market Size Forecast
- 1.2.1 Global Renewable Synfuels Sales Value (2019-2030)
- 1.2.2 Global Renewable Synfuels Sales Volume (2019-2030)
- 1.2.3 Global Renewable Synfuels Sales Price (2019-2030)
- 1.3 Renewable Synfuels Market Trends & Drivers
- 1.3.1 Renewable Synfuels Industry Trends
- 1.3.2 Renewable Synfuels Market Drivers & Opportunity
- 1.3.3 Renewable Synfuels Market Challenges and Restraints
- 1.4 Assumptions and Limitations
- 1.5 Study Objectives
- 1.6 Years Considered
2 Competitive Analysis by Company
- 2.1 Global Renewable Synfuels Players Revenue Ranking (2023)
- 2.2 Global Renewable Synfuels Revenue by Company (2019-2024)
- 2.3 Global Renewable Synfuels Players Sales Volume Ranking (2023)
- 2.4 Global Renewable Synfuels Sales Volume by Company Players (2019-2024)
- 2.5 Global Renewable Synfuels Average Price by Company (2019-2024)
- 2.6 Key Manufacturers Renewable Synfuels Manufacturing Base and Headquarters
- 2.7 Key Manufacturers Renewable Synfuels Product Offered
- 2.8 Renewable Synfuels Market Competitive Analysis
- 2.8.1 Renewable Synfuels Market Concentration Rate (2019-2024)
- 2.8.2 Global 5 Largest Manufacturers by Renewable Synfuels Revenue in 2023
- 2.8.3 Global Top Manufacturers by Company Type (Tier 1, Tier 2, and Tier 3) & (based on the Revenue in Renewable Synfuels as of 2023)
- 2.9 Mergers & Acquisitions, Expansion
3 Segmentation by Type
- 3.1 Introduction by Type
- 3.1.1 Biodiesel
- 3.1.2 Bioethanol
- 3.1.3 Renewable Natural Gas
- 3.1.4 eFuels
- 3.2 Global Renewable Synfuels Sales Value by Type
- 3.2.1 Global Renewable Synfuels Sales Value by Type (2019 VS 2023 VS 2030)
- 3.2.2 Global Renewable Synfuels Sales Value, by Type (2019-2030)
- 3.2.3 Global Renewable Synfuels Sales Value, by Type (%) (2019-2030)
- 3.3 Global Renewable Synfuels Sales Volume by Type
- 3.3.1 Global Renewable Synfuels Sales Volume by Type (2019 VS 2023 VS 2030)
- 3.3.2 Global Renewable Synfuels Sales Volume, by Type (2019-2030)
- 3.3.3 Global Renewable Synfuels Sales Volume, by Type (%) (2019-2030)
- 3.4 Global Renewable Synfuels Average Price by Type (2019-2030)
4 Segmentation by Application
- 4.1 Introduction by Application
- 4.1.1 Road Transport
- 4.1.2 Shipping
- 4.1.3 Aviation
- 4.1.4 Industrial
- 4.1.5 Power Generation
- 4.1.6 Heating
- 4.2 Global Renewable Synfuels Sales Value by Application
- 4.2.1 Global Renewable Synfuels Sales Value by Application (2019 VS 2023 VS 2030)
- 4.2.2 Global Renewable Synfuels Sales Value, by Application (2019-2030)
- 4.2.3 Global Renewable Synfuels Sales Value, by Application (%) (2019-2030)
- 4.3 Global Renewable Synfuels Sales Volume by Application
- 4.3.1 Global Renewable Synfuels Sales Volume by Application (2019 VS 2023 VS 2030)
- 4.3.2 Global Renewable Synfuels Sales Volume, by Application (2019-2030)
- 4.3.3 Global Renewable Synfuels Sales Volume, by Application (%) (2019-2030)
- 4.4 Global Renewable Synfuels Average Price by Application (2019-2030)
5 Segmentation by Region
- 5.1 Global Renewable Synfuels Sales Value by Region
- 5.1.1 Global Renewable Synfuels Sales Value by Region: 2019 VS 2023 VS 2030
- 5.1.2 Global Renewable Synfuels Sales Value by Region (2019-2024)
- 5.1.3 Global Renewable Synfuels Sales Value by Region (2025-2030)
- 5.1.4 Global Renewable Synfuels Sales Value by Region (%), (2019-2030)
- 5.2 Global Renewable Synfuels Sales Volume by Region
- 5.2.1 Global Renewable Synfuels Sales Volume by Region: 2019 VS 2023 VS 2030
- 5.2.2 Global Renewable Synfuels Sales Volume by Region (2019-2024)
- 5.2.3 Global Renewable Synfuels Sales Volume by Region (2025-2030)
- 5.2.4 Global Renewable Synfuels Sales Volume by Region (%), (2019-2030)
- 5.3 Global Renewable Synfuels Average Price by Region (2019-2030)
- 5.4 North America
- 5.4.1 North America Renewable Synfuels Sales Value, 2019-2030
- 5.4.2 North America Renewable Synfuels Sales Value by Country (%), 2023
- 5.5 Europe
- 5.5.1 Europe Renewable Synfuels Sales Value, 2019-2030
- 5.5.2 Europe Renewable Synfuels Sales Value by Country (%), 2023
- 5.6 Asia Pacific
- 5.6.1 Asia Pacific Renewable Synfuels Sales Value, 2019-2030
- 5.6.2 Asia Pacific Renewable Synfuels Sales Value by Region (%), 2023
- 5.7 Latin America
- 5.7.1 Latin America Renewable Synfuels Sales Value, 2019-2030
- 5.7.2 Latin America Renewable Synfuels Sales Value by Country (%), 2023
- 5.8 Middle East & Africa
- 5.8.1 Middle East & Africa Renewable Synfuels Sales Value, 2019-2030
- 5.8.2 Middle East & Africa Renewable Synfuels Sales Value by Country (%), 2023
6 Segmentation by Key Countries/Regions
- 6.1 Key Countries/Regions Renewable Synfuels Sales Value Growth Trends, 2019 VS 2023 VS 2030
- 6.2 Key Countries/Regions Renewable Synfuels Sales Value
- 6.2.1 Key Countries/Regions Renewable Synfuels Sales Value, 2019-2030
- 6.2.2 Key Countries/Regions Renewable Synfuels Sales Volume, 2019-2030
- 6.3 United States
- 6.3.1 United States Renewable Synfuels Sales Value, 2019-2030
- 6.3.2 United States Renewable Synfuels Sales Value by Type (%), 2023
- 6.3.3 United States Renewable Synfuels Sales Value by Application, 2023
- 6.4 Europe
- 6.4.1 Europe Renewable Synfuels Sales Value, 2019-2030
- 6.4.2 Europe Renewable Synfuels Sales Value by Type (%), 2023
- 6.4.3 Europe Renewable Synfuels Sales Value by Application, 2023
- 6.5 China
- 6.5.1 China Renewable Synfuels Sales Value, 2019-2030
- 6.5.2 China Renewable Synfuels Sales Value by Type (%), 2023
- 6.5.3 China Renewable Synfuels Sales Value by Application, 2023
- 6.6 India
- 6.6.1 India Renewable Synfuels Sales Value, 2019-2030
- 6.6.2 India Renewable Synfuels Sales Value by Type (%), 2023
- 6.6.3 India Renewable Synfuels Sales Value by Application, 2023
- 6.7 Southeast Asia
- 6.7.1 Southeast Asia Renewable Synfuels Sales Value, 2019-2030
- 6.7.2 Southeast Asia Renewable Synfuels Sales Value by Type (%), 2023
- 6.7.3 Southeast Asia Renewable Synfuels Sales Value by Application, 2023
- 6.8 Latin America
- 6.8.1 Latin America Renewable Synfuels Sales Value, 2019-2030
- 6.8.2 Latin America Renewable Synfuels Sales Value by Type (%), 2023 VS 2030
- 6.8.3 Latin America Renewable Synfuels Sales Value by Application, 2023 VS 2030
7 Company Profiles
- 7.1 ADM
- 7.1.1 ADM Company Information
- 7.1.2 ADM Introduction and Business Overview
- 7.1.3 ADM Renewable Synfuels Sales, Revenue, Price and Gross Margin (2019-2024)
- 7.1.4 ADM Renewable Synfuels Product Offerings
- 7.1.5 ADM Recent Development
- 7.2 Valero
- 7.2.1 Valero Company Information
- 7.2.2 Valero Introduction and Business Overview
- 7.2.3 Valero Renewable Synfuels Sales, Revenue, Price and Gross Margin (2019-2024)
- 7.2.4 Valero Renewable Synfuels Product Offerings
- 7.2.5 Valero Recent Development
- 7.3 Neste
- 7.3.1 Neste Company Information
- 7.3.2 Neste Introduction and Business Overview
- 7.3.3 Neste Renewable Synfuels Sales, Revenue, Price and Gross Margin (2019-2024)
- 7.3.4 Neste Renewable Synfuels Product Offerings
- 7.3.5 Neste Recent Development
- 7.4 POET
- 7.4.1 POET Company Information
- 7.4.2 POET Introduction and Business Overview
- 7.4.3 POET Renewable Synfuels Sales, Revenue, Price and Gross Margin (2019-2024)
- 7.4.4 POET Renewable Synfuels Product Offerings
- 7.4.5 POET Recent Development
- 7.5 Renewable Energy Group (Chevron)
- 7.5.1 Renewable Energy Group (Chevron) Company Information
- 7.5.2 Renewable Energy Group (Chevron) Introduction and Business Overview
- 7.5.3 Renewable Energy Group (Chevron) Renewable Synfuels Sales, Revenue, Price and Gross Margin (2019-2024)
- 7.5.4 Renewable Energy Group (Chevron) Renewable Synfuels Product Offerings
- 7.5.5 Renewable Energy Group (Chevron) Recent Development
- 7.6 Raizen
- 7.6.1 Raizen Company Information
- 7.6.2 Raizen Introduction and Business Overview
- 7.6.3 Raizen Renewable Synfuels Sales, Revenue, Price and Gross Margin (2019-2024)
- 7.6.4 Raizen Renewable Synfuels Product Offerings
- 7.6.5 Raizen Recent Development
- 7.7 Saipol
- 7.7.1 Saipol Company Information
- 7.7.2 Saipol Introduction and Business Overview
- 7.7.3 Saipol Renewable Synfuels Sales, Revenue, Price and Gross Margin (2019-2024)
- 7.7.4 Saipol Renewable Synfuels Product Offerings
- 7.7.5 Saipol Recent Development
- 7.8 Green Plains
- 7.8.1 Green Plains Company Information
- 7.8.2 Green Plains Introduction and Business Overview
- 7.8.3 Green Plains Renewable Synfuels Sales, Revenue, Price and Gross Margin (2019-2024)
- 7.8.4 Green Plains Renewable Synfuels Product Offerings
- 7.8.5 Green Plains Recent Development
- 7.9 Alto Ingredients
- 7.9.1 Alto Ingredients Company Information
- 7.9.2 Alto Ingredients Introduction and Business Overview
- 7.9.3 Alto Ingredients Renewable Synfuels Sales, Revenue, Price and Gross Margin (2019-2024)
- 7.9.4 Alto Ingredients Renewable Synfuels Product Offerings
- 7.9.5 Alto Ingredients Recent Development
- 7.10 CropEnergies
- 7.10.1 CropEnergies Company Information
- 7.10.2 CropEnergies Introduction and Business Overview
- 7.10.3 CropEnergies Renewable Synfuels Sales, Revenue, Price and Gross Margin (2019-2024)
- 7.10.4 CropEnergies Renewable Synfuels Product Offerings
- 7.10.5 CropEnergies Recent Development
- 7.11 The Andersons
- 7.11.1 The Andersons Company Information
- 7.11.2 The Andersons Introduction and Business Overview
- 7.11.3 The Andersons Renewable Synfuels Sales, Revenue, Price and Gross Margin (2019-2024)
- 7.11.4 The Andersons Renewable Synfuels Product Offerings
- 7.11.5 The Andersons Recent Development
- 7.12 Verbio
- 7.12.1 Verbio Company Information
- 7.12.2 Verbio Introduction and Business Overview
- 7.12.3 Verbio Renewable Synfuels Sales, Revenue, Price and Gross Margin (2019-2024)
- 7.12.4 Verbio Renewable Synfuels Product Offerings
- 7.12.5 Verbio Recent Development
- 7.13 TotalEnergies
- 7.13.1 TotalEnergies Company Information
- 7.13.2 TotalEnergies Introduction and Business Overview
- 7.13.3 TotalEnergies Renewable Synfuels Sales, Revenue, Price and Gross Margin (2019-2024)
- 7.13.4 TotalEnergies Renewable Synfuels Product Offerings
- 7.13.5 TotalEnergies Recent Development
- 7.14 Cargill
- 7.14.1 Cargill Company Information
- 7.14.2 Cargill Introduction and Business Overview
- 7.14.3 Cargill Renewable Synfuels Sales, Revenue, Price and Gross Margin (2019-2024)
- 7.14.4 Cargill Renewable Synfuels Product Offerings
- 7.14.5 Cargill Recent Development
- 7.15 Zhuoyue New Energy
- 7.15.1 Zhuoyue New Energy Company Information
- 7.15.2 Zhuoyue New Energy Introduction and Business Overview
- 7.15.3 Zhuoyue New Energy Renewable Synfuels Sales, Revenue, Price and Gross Margin (2019-2024)
- 7.15.4 Zhuoyue New Energy Renewable Synfuels Product Offerings
- 7.16 Nature Energy (Shell)
- 7.16.1 Nature Energy (Shell) Company Information
- 7.16.2 Nature Energy (Shell) Introduction and Business Overview
- 7.16.3 Nature Energy (Shell) Renewable Synfuels Sales, Revenue, Price and Gross Margin (2019-2024)
- 7.16.4 Nature Energy (Shell) Renewable Synfuels Product Offerings
- 7.16.5 Nature Energy (Shell) Recent Development
- 7.17 HIF Global
- 7.17.1 HIF Global Company Information
- 7.17.2 HIF Global Introduction and Business Overview
- 7.17.3 HIF Global Renewable Synfuels Projects
- 7.17.4 HIF Global Recent Development
- 7.18 Liquid Wind
- 7.18.1 Liquid Wind Company Information
- 7.18.2 Liquid Wind Introduction and Business Overview
- 7.18.3 Liquid Wind Renewable Synfuels Product Offerings
- 7.18.4 Liquid Wind Renewable Synfuels Projects
- 7.18.5 Liquid Wind Recent Development
- 7.19 Infinium
- 7.19.1 Infinium Company Information
- 7.19.2 Infinium Introduction and Business Overview
- 7.19.3 Infinium Renewable Synfuels Product Offerings
- 7.19.4 Infinium Renewable Synfuels Projects
- 7.19.5 Infinium Recent Development
- 7.20 Norsk e-Fuel
- 7.20.1 Norsk e-Fuel Company Information
- 7.20.2 Norsk e-Fuel Introduction and Business Overview
- 7.20.3 Norsk e-Fuel Renewable Synfuels Product Offerings
- 7.20.4 Norsk e-Fuel Renewable Synfuels Projects
- 7.20.5 Norsk e-Fuel Recent Development
- 7.21 Nordic Electrofuel
- 7.21.1 Nordic Electrofuel Company Information
- 7.21.2 Nordic Electrofuel Introduction and Business Overview
- 7.21.3 Nordic Electrofuel Renewable Synfuels Projects
- 7.21.4 Nordic Electrofuel Recent Development
- 7.22 European Energy
- 7.22.1 European Energy Company Information
- 7.22.2 European Energy Introduction and Business Overview
- 7.22.3 European Energy Renewable Synfuels Product Offerings
- 7.22.4 European Energy Renewable Synfuels Projects
- 7.22.5 European Energy Recent Development
8 Industry Chain Analysis
- 8.1 Renewable Synfuels Industrial Chain
- 8.2 Renewable Synfuels Upstream Analysis
- 8.2.1 Key Raw Materials
- 8.2.2 Manufacturing Cost Structure
- 8.3 Midstream Analysis
- 8.4 Downstream Analysis (Customers Analysis)
- 8.5 Sales Model and Sales Channels
- 8.5.1 Renewable Synfuels Sales Model
- 8.5.2 Sales Channel
- 8.5.3 Renewable Synfuels Distributors
9 Research Findings and Conclusion
10 Appendix
- 10.1 Research Methodology
- 10.1.1 Methodology/Research Approach
- 10.1.2 Data Source
- 10.2 Author Details
- 10.3 Disclaimer
