|
|
市場調査レポート
商品コード
1462816
フィギュリンの世界市場:2024年Global Figurine Market Research Report 2024 |
||||||
|
|||||||
カスタマイズ可能
適宜更新あり
|
|||||||

| フィギュリンの世界市場:2024年 |
|
出版日: 2024年04月13日
発行: QYResearch
ページ情報: 英文 103 Pages
納期: 2~3営業日
|

全表示
- 概要
- 図表
- 目次
世界のフィギュリンの市場規模は、2023年の706万米ドルから、予測期間中は10.10%のCAGRで推移し、2030年には139億4,000万米ドルに達すると予測されています。
フィギュリンの主な世界的メーカーには、Bandai Namco、Funko。Good Smile Company、POP MART、Mattelなどがあります。2023年には世界の上位ベンダー3社が収益の31.17%のシェアを占めました。
当レポートでは、世界のフィギュリンの市場を調査し、市場および製品の概要、競合情勢、市場規模の推移・予測、各種区分・地域/主要国別の詳細分析、価格動向、市場成長への各種影響因子の分析、主要企業の分析などをまとめています。
目次
第1章 フィギュリン市場概要
- 製品定義
- フィギュリン市場:タイプ別
- 市場規模の比較:タイプ別
- アニメフィギュリン
- 映画フィギュリン
- その他
- フィギュリン市場:用途別
- 市場規模:用途別
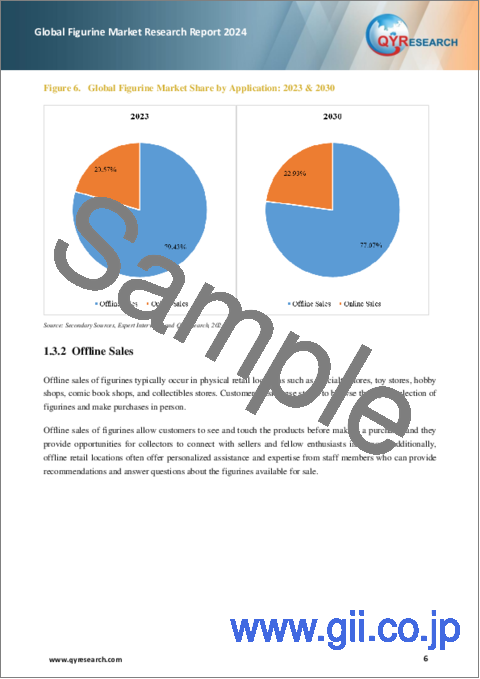
- オフライン販売
- オンライン販売
- 世界のフィギュリン市場:市場規模の推移・予測
- 収益の推移・予測
- 販売数の推移・予測
- 平均価格の推移・予測
- 前提と制限
第2章 フィギュリン市場の競合情勢:製造業者別
- 世界の販売数シェア:製造業者別
- 世界の収益シェア:製造業者別
- 世界の平均価格:製造業者別
- 世界の主要企業:業界ランキング
- 世界の主要製造業者:製造拠点・本社
- 競合情勢・動向
第3章 世界のフィギュリン市場の状況:地域別
- 世界市場の規模:2019年 vs 2023年 vs 2030年
- 世界のフィギュリン販売数の推移・予測:地域別
- 世界のフィギュリン収益の推移・予測:地域別
- 北米:国別データ・統計
- 欧州:国別データ・統計
- アジア太平洋:国別データ・統計
- ラテンアメリカ:国別データ・統計
- 中東・アフリカ:国別データ・統計
第4章 タイプ別セグメント
- 世界の販売数の推移・予測・市場シェア
- 世界の収益の推移・予測・市場シェア
- 世界の価格の推移・予測
第5章 用途別セグメント
- 世界の販売数の推移・予測・市場シェア
- 世界の収益の推移・予測・市場シェア
- 世界の価格の推移・予測
第6章 主要企業の紹介
- Bandai Namco
- Funko
- Good Smile Company
- POP MART
- Mattel
- Hasbro
- Hot Toys
- MaxFactory
- Sideshow Collectibles
- Kotobukiya
- Kaiyodo
- Aniplex
- ALTER
第7章 産業チェーンと販売チャネルの分析
- 産業チェーン分析
- 主要原材料
- 製造モード・プロセス
- 販売・マーケティング
- 顧客
第8章 フィギュリン:市場力学
- 産業動向
- 市場促進要因
- 市場課題
- 市場抑制要因
第9章 調査結果・総論
第10章 調査手法・データソース
List of Tables
- Table 1. Global Figurine Market Value Comparison by Type (2024-2030) & (US$ Million)
- Table 2. Global Figurine Market Value by Application (2024-2030) & (US$ Million)
- Table 3. Global Figurine Market Competitive Situation by Manufacturers in 2023
- Table 4. Global Figurine Sales (K Units) of Key Manufacturers (2019-2024)
- Table 5. Global Figurine Sales Market Share by Manufacturers (2019-2024)
- Table 6. Global Figurine Revenue (US$ Million) by Manufacturers (2019-2024)
- Table 7. Global Figurine Revenue Share by Manufacturers (2019-2024)
- Table 8. Global Market Figurine Average Price (US$/Unit) of Key Manufacturers (2019-2024)
- Table 9. Global Key Players of Figurine, Industry Ranking, 2022 VS 2023 VS 2024
- Table 10. Global Key Manufacturers of Figurine, Manufacturing Sites & Headquarters
- Table 11. Global Manufacturers Market Concentration Ratio (CR5 and HHI)
- Table 12. Global Figurine by Company Type (Tier 1, Tier 2, and Tier 3) & (based on the Revenue in Figurine as of 2023)
- Table 13. Global Figurine Market Size by Region (US$ Million): 2019 VS 2023 VS 2030
- Table 14. Global Figurine Sales by Region (2019-2024) & (K Units)
- Table 15. Global Figurine Sales Market Share by Region (2019-2024)
- Table 16. Global Figurine Sales by Region (2025-2030) & (K Units)
- Table 17. Global Figurine Sales Market Share by Region (2025-2030)
- Table 18. Global Figurine Revenue by Region (2019-2024) & (US$ Million)
- Table 19. Global Figurine Revenue Market Share by Region (2019-2024)
- Table 20. Global Figurine Revenue by Region (2025-2030) & (US$ Million)
- Table 21. Global Figurine Revenue Market Share by Region (2025-2030)
- Table 22. North America Figurine Revenue by Country: 2019 VS 2023 VS 2030 (US$ Million)
- Table 23. North America Figurine Sales by Country (2019-2024) & (K Units)
- Table 24. North America Figurine Sales by Country (2025-2030) & (K Units)
- Table 25. North America Figurine Revenue by Country (2019-2024) & (US$ Million)
- Table 26. North America Figurine Revenue by Country (2025-2030) & (US$ Million)
- Table 27. Europe Figurine Revenue by Country: 2019 VS 2023 VS 2030 (US$ Million)
- Table 28. Europe Figurine Sales by Country (2019-2024) & (K Units)
- Table 29. Europe Figurine Sales by Country (2025-2030) & (K Units)
- Table 30. Europe Figurine Revenue by Country (2019-2024) & (US$ Million)
- Table 31. Europe Figurine Revenue by Country (2025-2030) & (US$ Million)
- Table 32. Asia Pacific Figurine Revenue by Region: 2019 VS 2023 VS 2030 (US$ Million)
- Table 33. Asia Pacific Figurine Sales by Region (2019-2024) & (K Units)
- Table 34. Asia Pacific Figurine Sales by Region (2025-2030) & (K Units)
- Table 35. Asia Pacific Figurine Revenue by Region (2019-2024) & (US$ Million)
- Table 36. Asia Pacific Figurine Revenue by Region (2025-2030) & (US$ Million)
- Table 37. Latin America Figurine Revenue by Country: 2019 VS 2023 VS 2030 (US$ Million)
- Table 38. Latin America Figurine Sales by Country (2019-2024) & (K Units)
- Table 39. Latin America Figurine Sales by Country (2025-2030) & (K Units)
- Table 40. Latin America Figurine Revenue by Country (2019-2024) & (US$ Million)
- Table 41. Latin America Figurine Revenue Market Share by Country (2019-2024)
- Table 42. Middle East and Africa Figurine Revenue by Country: 2019 VS 2023 VS 2030 (US$ Million)
- Table 43. Middle East and Africa Figurine Sales by Country (2019-2024) & (K Units)
- Table 44. Middle East and Africa Figurine Sales by Country (2025-2030) & (K Units)
- Table 45. Middle East and Africa Figurine Revenue by Country (2019-2024) & (US$ Million)
- Table 46. Middle East and Africa Figurine Revenue by Country (2025-2030) & (US$ Million)
- Table 47. Global Figurine Sales (K Units) by Type (2019-2024)
- Table 48. Global Figurine Sales (K Units) by Type (2025-2030)
- Table 49. Global Figurine Sales Market Share by Type (2019-2024)
- Table 50. Global Figurine Sales Market Share by Type (2025-2030)
- Table 51. Global Figurine Revenue (US$ Million) by Type (2019-2024)
- Table 52. Global Figurine Revenue (US$ Million) by Type (2025-2030)
- Table 53. Global Figurine Revenue Market Share by Type (2019-2024)
- Table 54. Global Figurine Revenue Market Share by Type (2025-2030)
- Table 55. Global Figurine Price (US$/Unit) by Type (2019-2024)
- Table 56. Global Figurine Price (US$/Unit) by Type (2025-2030)
- Table 57. Global Figurine Sales (K Units) by Application (2019-2024)
- Table 58. Global Figurine Sales (K Units) by Application (2025-2030)
- Table 59. Global Figurine Sales Market Share by Application (2019-2024)
- Table 60. Global Figurine Sales Market Share by Application (2025-2030)
- Table 61. Global Figurine Revenue (US$ Million) by Application (2019-2024)
- Table 62. Global Figurine Revenue (US$ Million) by Application (2025-2030)
- Table 63. Global Figurine Revenue Market Share by Application (2019-2024)
- Table 64. Global Figurine Revenue Market Share by Application (2025-2030)
- Table 65. Global Figurine Price (US$/Unit) by Application (2019-2024)
- Table 66. Global Figurine Price (US$/Unit) by Application (2025-2030)
- Table 67. Bandai Namco Company Information
- Table 68. Bandai Namco Figurine Sales (K Units), Revenue (US$ Million), Price (US$/Unit) and Gross Margin (2019-2024)
- Table 69. Bandai Namco Figurine Product
- Table 70. Funko Company Information
- Table 71. Funko Figurine Sales (K Units), Revenue (US$ Million), Price (US$/Unit) and Gross Margin (2019-2024)
- Table 72. Funko Figurine Product
- Table 73. Good Smile Company Company Information
- Table 74. Good Smile Company Figurine Sales (K Units), Revenue (US$ Million), Price (US$/Unit) and Gross Margin (2019-2024)
- Table 75. Good Smile Company Figurine Product
- Table 76. POP MART Company Information
- Table 77. POP MART Figurine Sales (K Units), Revenue (US$ Million), Price (US$/Unit) and Gross Margin (2019-2024)
- Table 78. POP MART Figurine Product
- Table 79. Mattel Company Information
- Table 80. Mattel Figurine Sales (K Units), Revenue (US$ Million), Price (US$/Unit) and Gross Margin (2019-2024)
- Table 81. Mattel Figurine Product
- Table 82. Hasbro Company Information
- Table 83. Hasbro Figurine Sales (K Units), Revenue (US$ Million), Price (US$/Unit) and Gross Margin (2019-2024)
- Table 84. Hasbro Figurine Product
- Table 85. Hot Toys Company Information
- Table 86. Hot Toys Figurine Sales (K Units), Revenue (US$ Million), Price (US$/Unit) and Gross Margin (2019-2024)
- Table 87. Hot Toys Figurine Product
- Table 88. MaxFactory Company Information
- Table 89. MaxFactory Figurine Sales (K Units), Revenue (US$ Million), Price (US$/Unit) and Gross Margin (2019-2024)
- Table 90. MaxFactory Figurine Product
- Table 91. Sideshow Collectibles Company Information
- Table 92. Sideshow Collectibles Figurine Sales (K Units), Revenue (US$ Million), Price (US$/Unit) and Gross Margin (2019-2024)
- Table 93. Sideshow Collectibles Figurine Product
- Table 94. Kotobukiya Company Information
- Table 95. Kotobukiya Figurine Sales (K Units), Revenue (US$ Million), Price (US$/Unit) and Gross Margin (2019-2024)
- Table 96. Kotobukiya Figurine Product
- Table 97. Kaiyodo Company Information
- Table 98. Kaiyodo Figurine Sales (K Units), Revenue (US$ Million), Price (US$/Unit) and Gross Margin (2019-2024)
- Table 99. Kaiyodo Figurine Product
- Table 100. Aniplex Company Information
- Table 101. Aniplex Figurine Sales (K Units), Revenue (US$ Million), Price (US$/Unit) and Gross Margin (2019-2024)
- Table 102. Aniplex Figurine Product
- Table 103. ALTER Company Information
- Table 104. ALTER Figurine Sales (K Units), Revenue (US$ Million), Price (US$/Unit) and Gross Margin (2019-2024)
- Table 105. ALTER Figurine Product
- Table 106. Key Raw Materials Lists
- Table 107. Raw Materials Key Suppliers Lists
- Table 108. Figurine Distributors List
- Table 109. Figurine Customers List
- Table 110. Figurine Market Trends
- Table 111. Figurine Market Drivers
- Table 112. Figurine Market Challenges
- Table 113. Figurine Market Restraints
- Table 114. Research Programs/Design for This Report
- Table 115. Key Data Information from Secondary Sources
- Table 116. Key Data Information from Primary Sources
- Table 117. Authors List of This Report
List of Figures
- Figure 1. Product Picture of Figurine
- Figure 2. Global Figurine Market Share by Type: 2023 & 2030
- Figure 3. Anime Figurines Product Picture
- Figure 4. Movie Figurines Product Picture
- Figure 5. Virtual Idol Figurines
- Figure 6. Global Figurine Market Share by Application: 2023 & 2030
- Figure 7. Offline Sales
- Figure 8. Online Sales
- Figure 9. Global Figurine Revenue, (US$ Million), 2019 VS 2023 VS 2030
- Figure 10. Global Figurine Market Size (2019-2030) & (US$ Million)
- Figure 11. Global Figurine Sales (2019-2030) & (K Units)
- Figure 12. Global Figurine Average Price (US$/Unit) & (2019-2030)
- Figure 13. Figurine Report Years Considered
- Figure 14. Global 5 and 10 Largest Figurine Players: Market Share by Revenue in Figurine in 2023
- Figure 15. Figurine Market Share by Company Type (Tier 1, Tier 2, and Tier 3): 2019 VS 2023
- Figure 16. United States Figurine Revenue Growth Rate (2019-2030) & (US$ Million)
- Figure 17. Canada Figurine Revenue Growth Rate (2019-2030) & (US$ Million)
- Figure 18. Germany Figurine Revenue Growth Rate (2019-2030) & (US$ Million)
- Figure 19. France Figurine Revenue Growth Rate (2019-2030) & (US$ Million)
- Figure 20. U.K. Figurine Revenue Growth Rate (2019-2030) & (US$ Million)
- Figure 21. Italy Figurine Revenue Growth Rate (2019-2030) & (US$ Million)
- Figure 22. Russia Figurine Revenue Growth Rate (2019-2030) & (US$ Million)
- Figure 23. China Figurine Revenue Growth Rate (2019-2030) & (US$ Million)
- Figure 24. Japan Figurine Revenue Growth Rate (2019-2030) & (US$ Million)
- Figure 25. South Korea Figurine Revenue Growth Rate (2019-2030) & (US$ Million)
- Figure 26. India Figurine Revenue Growth Rate (2019-2030) & (US$ Million)
- Figure 27. Australia Figurine Revenue Growth Rate (2019-2030) & (US$ Million)
- Figure 28. China Taiwan Figurine Revenue Growth Rate (2019-2030) & (US$ Million)
- Figure 29. Southeast Asia Figurine Revenue Growth Rate (2019-2030) & (US$ Million)
- Figure 30. Brazil Figurine Revenue Growth Rate (2019-2030) & (US$ Million)
- Figure 31. Mexico Figurine Revenue Growth Rate (2019-2030) & (US$ Million)
- Figure 32. Argentina Figurine Revenue Growth Rate (2019-2030) & (US$ Million)
- Figure 33. Middle East Figurine Revenue Growth Rate (2019-2030) & (US$ Million)
- Figure 34. Africa Figurine Revenue Growth Rate (2019-2030) & (US$ Million)
- Figure 35. Figurine Value Chain
- Figure 36. Figurine Production Mode & Process
- Figure 37. Channels of Distribution
- Figure 38. Bottom-up and Top-down Approaches for This Report
- Figure 39. Data Triangulation
- Figure 40. Key Executives Interviewed
The global Figurine market was valued at US$ 7.06 million in 2023 and is anticipated to reach US$ 13.94 billion by 2030, witnessing a CAGR of 10.10% during the forecast period 2024-2030.
The major global manufacturers of Figurine include Bandai Namco, Funko, Good Smile Company, POP MART, Mattel, etc. In 2023, the world's top three vendors accounted for 31.17% of the revenue.
This report aims to provide a comprehensive presentation of the global market for Figurine, with both quantitative and qualitative analysis, to help readers develop business/growth strategies, assess the market competitive situation, analyze their position in the current marketplace, and make informed business decisions regarding Figurine.
The Figurine market size, estimations, and forecasts are provided in terms of sales volume (K Units) and revenue ($ millions), considering 2023 as the base year, with history and forecast data for the period from 2019 to 2030. This report segments the global Figurine market comprehensively. Regional market sizes, concerning products by Type, by Application, and by players, are also provided.
For a more in-depth understanding of the market, the report provides profiles of the competitive landscape, key competitors, and their respective market ranks. The report also discusses technological trends and new product developments.
The report will help the Figurine manufacturers, new entrants, and industry chain related companies in this market with information on the revenues, sales volume, and average price for the overall market and the sub-segments across the different segments, by company, by Type, by Application, and by regions.
By Company
- Bandai Namco
- Funko
- Good Smile Company
- POP MART
- Mattel
- Hasbro
- Hot Toys
- Max Factory
- Sideshow Collectibles
- Kotobukiya
- Kaiyodo
- Aniplex
- Alter
Segment by Type
- Anime Figurines
- Movie Figurines
- Others
Segment by Application
- Offline Sales
- Online Sales
Consumption by Region
- North America
- U.S.
- Canada
- Asia-Pacific
- China
- Japan
- South Korea
- China Taiwan
- Southeast Asia
- India
- Australia
- Europe
- Germany
- France
- U.K.
- Italy
- Russia
- South America
- Brazil
- Mexico
- Argentina
- Rest of South America
Table of Contents
1 Figurine Market Overview
- 1.1 Product Definition
- 1.2 Figurine by Type
- 1.2.1 Global Figurine Market Value Comparison by Type (2024-2030)
- 1.2.2 Anime Figurines
- 1.2.3 Movie Figurines
- 1.2.4 Others
- 1.3 Figurine by Application
- 1.3.1 Global Figurine Market Value by Application (2024-2030)
- 1.3.2 Offline Sales
- 1.3.3 Online Sales
- 1.4 Global Figurine Market Size Estimates and Forecasts
- 1.4.1 Global Figurine Revenue 2019-2030
- 1.4.2 Global Figurine Sales 2019-2030
- 1.4.3 Global Figurine Market Average Price (2019-2030)
- 1.5 Assumptions and Limitations
2 Figurine Market Competition by Manufacturers
- 2.1 Global Figurine Sales Market Share by Manufacturers (2019-2024)
- 2.2 Global Figurine Revenue Market Share by Manufacturers (2019-2024)
- 2.3 Global Figurine Average Price by Manufacturers (2019-2024)
- 2.4 Global Key Players of Figurine, Industry Ranking, 2022 VS 2023 VS 2024
- 2.5 Global Key Manufacturers of Figurine, Manufacturing Sites & Headquarters
- 2.6 Global Figurine Market Competitive Situation and Trends
- 2.6.1 Global Figurine Market Concentration Rate
- 2.6.2 The Global 5 and 10 Largest Figurine Players Market Share by Revenue
- 2.6.3 Global Figurine Market Share by Company Type (Tier 1, Tier 2, and Tier 3)
3 Global Figurine Market Scenario by Region
- 3.1 Global Figurine Market Size by Region: 2019 Versus 2023 Versus 2030
- 3.2 Global Figurine Sales by Region: 2019-2030
- 3.2.1 Global Figurine Sales by Region: 2019-2024
- 3.2.2 Global Figurine Sales by Region: 2025-2030
- 3.3 Global Figurine Revenue by Region: 2019-2030
- 3.3.1 Global Figurine Revenue by Region: 2019-2024
- 3.3.2 Global Figurine Revenue by Region: 2025-2030
- 3.4 North America Figurine Market Facts & Figures by Country
- 3.4.1 North America Figurine Market Size by Country: 2019 VS 2023 VS 2030
- 3.4.2 North America Figurine Sales by Country (2019-2030)
- 3.4.3 North America Figurine Revenue by Country (2019-2030)
- 3.4.4 United States
- 3.4.5 Canada
- 3.5 Europe Figurine Market Facts & Figures by Country
- 3.5.1 Europe Figurine Market Size by Country: 2019 VS 2023 VS 2030
- 3.5.2 Europe Figurine Sales by Country (2019-2030)
- 3.5.3 Europe Figurine Revenue by Country (2019-2030)
- 3.5.4 Germany
- 3.5.5 France
- 3.5.6 U.K.
- 3.5.7 Italy
- 3.5.8 Russia
- 3.6 Asia Pacific Figurine Market Facts & Figures by Region
- 3.6.1 Asia Pacific Figurine Market Size by Region: 2019 VS 2023 VS 2030
- 3.6.2 Asia Pacific Figurine Sales by Region (2019-2030)
- 3.6.3 Asia Pacific Figurine Revenue by Region (2019-2030)
- 3.6.4 China
- 3.6.5 Japan
- 3.6.6 South Korea
- 3.6.7 India
- 3.6.8 Australia
- 3.6.9 China Taiwan
- 3.6.10 Southeast Asia
- 3.7 Latin America Figurine Market Facts & Figures by Country
- 3.7.1 Latin America Figurine Market Size by Country: 2019 VS 2023 VS 2030
- 3.7.2 Latin America Figurine Sales by Country (2019-2030)
- 3.7.3 Latin America Figurine Revenue by Country
- 3.7.4 Brazil
- 3.7.5 Mexico
- 3.7.6 Argentina
- 3.8 Middle East and Africa Figurine Market Facts & Figures by Country
- 3.8.1 Middle East and Africa Figurine Market Size by Country: 2019 VS 2023 VS 2030
- 3.8.2 Middle East and Africa Figurine Sales by Country (2019-2030)
- 3.8.3 Middle East and Africa Figurine Revenue by Country
- 3.8.4 Middle East
- 3.8.5 Africa
4 Segment by Type
- 4.1 Global Figurine Sales by Type (2019-2030)
- 4.1.1 Global Figurine Sales by Type (2019-2024)
- 4.1.2 Global Figurine Sales by Type (2025-2030)
- 4.1.3 Global Figurine Sales Market Share by Type (2019-2030)
- 4.2 Global Figurine Revenue by Type (2019-2030)
- 4.2.1 Global Figurine Revenue by Type (2019-2024)
- 4.2.2 Global Figurine Revenue by Type (2025-2030)
- 4.2.3 Global Figurine Revenue Market Share by Type (2019-2030)
- 4.3 Global Figurine Price by Type (2019-2030)
5 Segment by Application
- 5.1 Global Figurine Sales by Application (2019-2030)
- 5.1.1 Global Figurine Sales by Application (2019-2024)
- 5.1.2 Global Figurine Sales by Application (2025-2030)
- 5.1.3 Global Figurine Sales Market Share by Application (2019-2030)
- 5.2 Global Figurine Revenue by Application (2019-2030)
- 5.2.1 Global Figurine Revenue by Application (2019-2024)
- 5.2.2 Global Figurine Revenue by Application (2025-2030)
- 5.2.3 Global Figurine Revenue Market Share by Application (2019-2030)
- 5.3 Global Figurine Price by Application (2019-2030)
6 Key Companies Profiled
- 6.1 Bandai Namco
- 6.1.1 Bandai Namco Company Information
- 6.1.2 Bandai Namco Description and Business Overview
- 6.1.3 Bandai Namco Figurine Sales, Revenue and Gross Margin (2019-2024)
- 6.1.4 Bandai Namco Figurine Product Portfolio
- 6.2 Funko
- 6.2.1 Funko Company Information
- 6.2.2 Funko Description and Business Overview
- 6.2.3 Funko Figurine Sales, Revenue and Gross Margin (2019-2024)
- 6.2.4 Funko Figurine Product Portfolio
- 6.3 Good Smile Company
- 6.3.1 Good Smile Company Company Information
- 6.3.2 Good Smile Company Description and Business Overview
- 6.3.3 Good Smile Company Figurine Sales, Revenue and Gross Margin (2019-2024)
- 6.3.4 Good Smile Company Figurine Product Portfolio
- 6.4 POP MART
- 6.4.1 POP MART Company Information
- 6.4.2 POP MART Description and Business Overview
- 6.4.3 POP MART Figurine Sales, Revenue and Gross Margin (2019-2024)
- 6.4.4 POP MART Figurine Product Portfolio
- 6.5 Mattel
- 6.5.1 Mattel Company Information
- 6.5.2 Mattel Description and Business Overview
- 6.5.3 Mattel Figurine Sales, Revenue and Gross Margin (2019-2024)
- 6.5.4 Mattel Figurine Product Portfolio
- 6.6 Hasbro
- 6.6.1 Hasbro Company Information
- 6.6.2 Hasbro Description and Business Overview
- 6.6.3 Hasbro Figurine Sales, Revenue and Gross Margin (2019-2024)
- 6.6.4 Hasbro Figurine Product Portfolio
- 6.7 Hot Toys
- 6.7.1 Hot Toys Company Information
- 6.7.2 Hot Toys Description and Business Overview
- 6.7.3 Hot Toys Figurine Sales, Revenue and Gross Margin (2019-2024)
- 6.7.4 Hot Toys Figurine Product Portfolio
- 6.8 MaxFactory
- 6.8.1 MaxFactory Company Information
- 6.8.2 MaxFactory Description and Business Overview
- 6.8.3 MaxFactory Figurine Sales, Revenue and Gross Margin (2019-2024)
- 6.8.4 MaxFactory Figurine Product Portfolio
- 6.9 Sideshow Collectibles
- 6.9.1 Sideshow Collectibles Company Information
- 6.9.2 Sideshow Collectibles Description and Business Overview
- 6.9.3 Sideshow Collectibles Figurine Sales, Revenue and Gross Margin (2019-2024)
- 6.9.4 Sideshow Collectibles Figurine Product Portfolio
- 6.10 Kotobukiya
- 6.10.1 Kotobukiya Company Information
- 6.10.2 Kotobukiya Description and Business Overview
- 6.10.3 Kotobukiya Figurine Sales, Revenue and Gross Margin (2019-2024)
- 6.10.4 Kotobukiya Figurine Product Portfolio
- 6.11 Kaiyodo
- 6.11.1 Kaiyodo Company Information
- 6.11.2 Kaiyodo Description and Business Overview
- 6.11.3 Kaiyodo Figurine Sales, Revenue and Gross Margin (2019-2024)
- 6.11.4 Kaiyodo Figurine Product Portfolio
- 6.12 Aniplex
- 6.12.1 Aniplex Company Information
- 6.12.2 Aniplex Description and Business Overview
- 6.12.3 Aniplex Figurine Sales, Revenue and Gross Margin (2019-2024)
- 6.12.4 Aniplex Figurine Product Portfolio
- 6.13 ALTER
- 6.13.1 ALTER Company Information
- 6.13.2 ALTER Description and Business Overview
- 6.13.3 ALTER Figurine Sales, Revenue and Gross Margin (2019-2024)
- 6.13.4 ALTER Figurine Product Portfolio
7 Industry Chain and Sales Channels Analysis
- 7.1 Figurine Industry Chain Analysis
- 7.2 Figurine Key Raw Materials
- 7.2.1 Key Raw Materials
- 7.2.2 Raw Materials Key Suppliers
- 7.3 Figurine Production Mode & Process
- 7.4 Figurine Sales and Marketing
- 7.4.1 Figurine Sales Channels
- 7.4.2 Figurine Distributors
- 7.5 Figurine Customers
8 Figurine Market Dynamics
- 8.1 Figurine Industry Trends
- 8.2 Figurine Market Drivers
- 8.3 Figurine Market Challenges
- 8.4 Figurine Market Restraints
9 Research Findings and Conclusion
10 Methodology and Data Source
- 10.1 Methodology/Research Approach
- 10.1.1 Research Programs/Design
- 10.1.2 Market Size Estimation
- 10.1.3 Market Breakdown and Data Triangulation
- 10.2 Data Source
- 10.2.1 Secondary Sources
- 10.2.2 Primary Sources
- 10.3 Author List
- 10.4 Disclaimer
