|
|
市場調査レポート
商品コード
1453657
世界のテトラヒドロクルクミン (CAS 36062-04-1) 産業の世界市場:2024年Global Tetrahydrocurcumin (CAS 36062-04-1) Industry 2024 Market Research Report |
||||||
|
|||||||
カスタマイズ可能
適宜更新あり
|
|||||||

| 世界のテトラヒドロクルクミン (CAS 36062-04-1) 産業の世界市場:2024年 |
|
出版日: 2024年03月20日
発行: QYResearch
ページ情報: 英文 113 Pages
納期: 2~3営業日
|

全表示
- 概要
- 図表
- 目次
世界のテトラヒドロクルクミン (CAS 36062-04-1) の市場規模を収益額でみると、2023年の715万米ドルから2030年には1,004万米ドルに達し、2024~2030年のCAGRは4.84%と予測されます。
一方、世界のテトラヒドロクルクミンの販売量は、2023年の23.89MTから、2030年には33.33MTに達し、2024~2030年のCAGRは4.55%と予測されます。
北米のテトラヒドロクルクミン市場は、2023年の184万米ドルと評価され、予測期間中 (2024年~2030年) に3.81%のCAGRで成長し、2030年には249万米ドルに達すると予測されます。
欧州のテトラヒドロクルクミン市場は、2023年の171万米ドルと評価され、予測期間中 (2024年~2030年) に4.37%のCAGRで成長し、2030年には234万米ドルに達すると予測されます。
アジア太平洋のテトラヒドロクルクミン市場は、2023年の319万米ドルと評価され、予測期間中 (2024年~2030年) に5.71%のCAGRで成長し、2030年には466万米ドルに達すると予測されます。
世界のテトラヒドロクルクミンの主要メーカーには、Huateng Pharma、Hangzhou Great Forest、Hangzhou Lingeba Technology、Hangzhou Linran Biotechnology、Plamed Green Science、Sinoway Industrialなどがあります。2023年には、世界の上位5ベンダーが収益の約47.13%を占めました。
当レポートでは、世界のテトラヒドロクルクミンの市場について分析し、純度別・用途別・地域別の市場動向の見通し (2019年~2030年)、主要企業のプロファイルなどについて調査しております。
目次
第1章 テトラヒドロクルクミン:市場概要
- 製品の定義
- テトラヒドロクルクミン:純度別
- 世界のテトラヒドロクルクミンの市場規模・成長率の分析:純度別 (金額ベース、2023年・2030年)
- 98%以下
- 98%以上
- テトラヒドロクルクミン:用途別
- 世界のテトラヒドロクルクミンの市場規模・成長率の分析:用途別 (金額ベース、2023年・2030年)
- 化粧品
- 医薬品
- 食品
- 世界市場の成長見通し
- 世界のテトラヒドロクルクミンの生産額、推定・予測 (2019年~2030年)
- 世界のテトラヒドロクルクミンの生産能力、推定・予測 (2019年~2030年)
- 世界のテトラヒドロクルクミンの生産、推定・予測 (2019年~2030年)
- 世界のテトラヒドロクルクミンの平均市場価格、推定・予測 (2019年~2030年)
- 前提と制限
第2章 市場競合:メーカー別
- 世界のテトラヒドロクルクミンの生産シェア:メーカー別 (2019年~2024年)
- 世界のテトラヒドロクルクミンの生産額シェア:メーカー別 (2019年~2024年)
- 世界のテトラヒドロクルクミンの主要企業:業界ランキング (2022年・2023年)
- 世界のテトラヒドロクルクミンの市場シェア:企業の種類別(ティア1、ティア2、ティア3)
- 世界のテトラヒドロクルクミンの平均価格:メーカー別 (2019年~2024年)
- 世界のテトラヒドロクルクミンの主要メーカー:製造拠点・本社
- 世界のテトラヒドロクルクミンの主要メーカー:提供製品とその用途
- 世界のテトラヒドロクルクミンの主要メーカー:市場参入時期
- 世界のテトラヒドロクルクミン市場:競争状況と動向
- 企業合併・買収 (M&A)、拡大
第3章 テトラヒドロクルクミンの生産:地域別
- 世界のテトラヒドロクルクミンの生産額、推定・予測:地域別 (2019年・2023年・2030年)
- 世界のテトラヒドロクルクミンの生産額:地域別 (2019年~2030年)
- 世界のテトラヒドロクルクミンの生産額シェア:地域別 (2019年~2024年)
- 世界のテトラヒドロクルクミンの生産額の予測:地域別 (2025年~2030年)
- 世界のテトラヒドロクルクミンの生産、推定・予測:地域別 (2019年・2023年・2030年)
- 世界のテトラヒドロクルクミンの生産:地域別 (2019年~2030年)
- 世界のテトラヒドロクルクミンの生産シェア:地域別 (2019年~2024年)
- 世界のテトラヒドロクルクミンの生産の予測:地域別 (2025年~2030年)
- 世界のテトラヒドロクルクミンの市場価格の分析:地域別 (2019年~2024年)
- 世界のテトラヒドロクルクミンの生産・生産額・対前年成長率 (YoY)
- 中国のテトラヒドロクルクミンの生産額、推定・予測 (2019年~2030年)
第4章 テトラヒドロクルクミンの消費:地域別
- 世界のテトラヒドロクルクミンの消費、推定・予測:地域別 (2019年・2023年・2030年)
- 世界のテトラヒドロクルクミンの消費:地域別 (2019年~2030年)
- 世界のテトラヒドロクルクミンの消費:地域別 (2019年~2030年)
- 世界のテトラヒドロクルクミンの消費予測:地域別 (2025年~2030年)
- 北米
- 米国
- カナダ
- 欧州
- ドイツ
- フランス
- 英国
- イタリア
- ロシア
- アジア太平洋
- 中国
- 日本
- 韓国
- 東南アジア
- インド
- オーストラリア
- ラテンアメリカ
- メキシコ
- ブラジル
- 中東・アフリカ
第5章 純度別のセグメント
- 世界のテトラヒドロクルクミンの生産:純度別 (2019年~2030年)
- 世界のテトラヒドロクルクミンの生産額:純度別 (2019年~2030年)
- 世界のテトラヒドロクルクミンの価格:純度別 (2019年~2030年)
第6章 用途別のセグメント
- 世界のテトラヒドロクルクミンの生産:用途別 (2019年~2030年)
- 世界のテトラヒドロクルクミンの生産額:用途別 (2019年~2030年)
- 世界のテトラヒドロクルクミンの価格:用途別 (2019年~2030年)
第7章 主要企業のプロファイル
- Huateng Pharma
- 企業情報
- 製品ポートフォリオ
- 生産・生産額・価格・粗利益 (2019年~2024年)
- 主力事業・市場
- 近年の動向
- Hangzhou Great Forest
- Hangzhou Lingeba Technology
- Hangzhou Lin Ran
- Plamed Green Science
- Sinoway Industrial
第8章 産業チェーンと販売チャネルの分析
- テトラヒドロクルクミンの産業チェーンの分析
- テトラヒドロクルクミンの主要原材料
- テトラヒドロクルクミンの生産モードとプロセス
- テトラヒドロクルクミンの販売とマーケティング
- テトラヒドロクルクミンの顧客
第9章 テトラヒドロクルクミンの市場力学
- テトラヒドロクルクミン業界の動向
- テトラヒドロクルクミン市場の促進要因
- テトラヒドロクルクミン市場の課題
- テトラヒドロクルクミン市場の抑制要因
第10章 調査結果と結論
第11章 調査手法とデータソース
List of Tables
- Table 1. Global Tetrahydrocurcumin Market Value by Purity, (US$ Million) & (2023 VS 2030)
- Table 2. Global Tetrahydrocurcumin Market Value by Application, (US$ Million) & (2023 VS 2030)
- Table 3. Global Tetrahydrocurcumin Production Capacity (Tons) by Manufacturers in 2023
- Table 4. Global Tetrahydrocurcumin Production by Manufacturers (2019-2024) & (Tons)
- Table 5. Global Tetrahydrocurcumin Production Market Share by Manufacturers (2019-2024)
- Table 6. Global Tetrahydrocurcumin Production Value by Manufacturers (2019-2024) & (US$ Million)
- Table 7. Global Tetrahydrocurcumin Production Value Share by Manufacturers (2019-2024)
- Table 8. Global Key Players of Tetrahydrocurcumin, Industry Ranking, 2022 VS 2023
- Table 9. Company Type (Tier 1, Tier 2, and Tier 3) & (based on the Production Value in Tetrahydrocurcumin as of 2023)
- Table 10. Global Market Tetrahydrocurcumin Average Price by Manufacturers (US$/Kg) & (2019-2024)
- Table 11. Global Key Manufacturers of Tetrahydrocurcumin, Manufacturing Base Distribution and Headquarters
- Table 12. Global Key Manufacturers of Tetrahydrocurcumin, Product Offered and Application
- Table 13. Global Key Manufacturers of Tetrahydrocurcumin, Date of Enter into This Industry
- Table 14. Global Tetrahydrocurcumin Manufacturers Market Concentration Ratio (CR5 and HHI)
- Table 15. Mergers & Acquisitions, Expansion Plans
- Table 16. Global Tetrahydrocurcumin Production Value by Region: 2019 VS 2023 VS 2030 (US$ Million)
- Table 17. Global Tetrahydrocurcumin Production Value (US$ Million) by Region (2019-2024)
- Table 18. Global Tetrahydrocurcumin Production Value Market Share by Region (2019-2024)
- Table 19. Global Tetrahydrocurcumin Production Value (US$ Million) Forecast by Region (2025-2030)
- Table 20. Global Tetrahydrocurcumin Production Value Market Share Forecast by Region (2025-2030)
- Table 21. Global Tetrahydrocurcumin Production Comparison by Region: 2019 VS 2023 VS 2030 (Tons)
- Table 22. Global Tetrahydrocurcumin Production (Tons) by Region (2019-2024)
- Table 23. Global Tetrahydrocurcumin Production Market Share by Region (2019-2024)
- Table 24. Global Tetrahydrocurcumin Production (Tons) Forecast by Region (2025-2030)
- Table 25. Global Tetrahydrocurcumin Production Market Share Forecast by Region (2025-2030)
- Table 26. Global Tetrahydrocurcumin Market Average Price (US$/Kg) by Region (2019-2024)
- Table 27. Global Tetrahydrocurcumin Market Average Price (US$/Kg) by Region (2025-2030)
- Table 28. Global Tetrahydrocurcumin Consumption Growth Rate by Region: 2019 VS 2023 VS 2030 (Tons)
- Table 29. Global Tetrahydrocurcumin Consumption by Region (2019-2024) & (Tons)
- Table 30. Global Tetrahydrocurcumin Consumption Market Share by Region (2019-2024)
- Table 31. Global Tetrahydrocurcumin Forecasted Consumption by Region (2025-2030) & (Tons)
- Table 32. Global Tetrahydrocurcumin Forecasted Consumption Market Share by Region (2019-2024)
- Table 33. North America Tetrahydrocurcumin Consumption Growth Rate by Country: 2019 VS 2023 VS 2030 (Tons)
- Table 34. North America Tetrahydrocurcumin Consumption by Country (2019-2024) & (Tons)
- Table 35. North America Tetrahydrocurcumin Consumption by Country (2025-2030) & (Tons)
- Table 36. Europe Tetrahydrocurcumin Consumption Growth Rate by Country: 2019 VS 2023 VS 2030 (Tons)
- Table 37. Europe Tetrahydrocurcumin Consumption by Country (2019-2024) & (Tons)
- Table 38. Europe Tetrahydrocurcumin Consumption by Country (2025-2030) & (Tons)
- Table 39. Asia Pacific Tetrahydrocurcumin Consumption Growth Rate by Country: 2019 VS 2023 VS 2030 (Tons)
- Table 40. Asia Pacific Tetrahydrocurcumin Consumption by Region (2019-2024) & (Tons)
- Table 41. Asia Pacific Tetrahydrocurcumin Consumption by Region (2025-2030) & (Tons)
- Table 42. Latin America Tetrahydrocurcumin Consumption Growth Rate by Country: 2019 VS 2023 VS 2030 (Tons)
- Table 43. Latin America Tetrahydrocurcumin Consumption by Country (2019-2024) & (Tons)
- Table 44. Latin America Tetrahydrocurcumin Consumption by Country (2025-2030) & (Tons)
- Table 45. Global Tetrahydrocurcumin Production (Tons) by Purity (2019-2024)
- Table 46. Global Tetrahydrocurcumin Production (Tons) by Purity (2025-2030)
- Table 47. Global Tetrahydrocurcumin Production Market Share by Purity (2019-2024)
- Table 48. Global Tetrahydrocurcumin Production Market Share by Purity (2025-2030)
- Table 49. Global Tetrahydrocurcumin Production Value (US$ Million) by Purity (2019-2024)
- Table 50. Global Tetrahydrocurcumin Production Value (US$ Million) by Purity (2025-2030)
- Table 51. Global Tetrahydrocurcumin Production Value Market Share by Purity (2019-2024)
- Table 52. Global Tetrahydrocurcumin Production Value Market Share by Purity (2025-2030)
- Table 53. Global Tetrahydrocurcumin Price (US$/Kg) by Purity (2019-2024)
- Table 54. Global Tetrahydrocurcumin Price (US$/Kg) by Purity (2025-2030)
- Table 55. Global Tetrahydrocurcumin Production (Tons) by Application (2019-2024)
- Table 56. Global Tetrahydrocurcumin Production (Tons) by Application (2025-2030)
- Table 57. Global Tetrahydrocurcumin Production Market Share by Application (2019-2024)
- Table 58. Global Tetrahydrocurcumin Production Market Share by Application (2025-2030)
- Table 59. Global Tetrahydrocurcumin Production Value (US$ Million) by Application (2019-2024)
- Table 60. Global Tetrahydrocurcumin Production Value (US$ Million) by Application (2025-2030)
- Table 61. Global Tetrahydrocurcumin Production Value Market Share by Application (2019-2024)
- Table 62. Global Tetrahydrocurcumin Production Value Market Share by Application (2025-2030)
- Table 63. Global Tetrahydrocurcumin Price (US$/Kg) by Application (2019-2024)
- Table 64. Global Tetrahydrocurcumin Price (US$/Kg) by Application (2025-2030)
- Table 65. Huateng Pharma Tetrahydrocurcumin Company Information
- Table 66. Huateng Pharma Tetrahydrocurcumin Specification and Application
- Table 67. Huateng Pharma Tetrahydrocurcumin Production (Tons), Value (US$ Million), Price (US$/Kg) and Gross Margin (2019-2024)
- Table 68. Huateng Pharma Main Business and Markets Served
- Table 69. Huateng Pharma Recent Developments/Updates
- Table 70. Hangzhou Great Forest Tetrahydrocurcumin Company Information
- Table 71. Hangzhou Great Forest Tetrahydrocurcumin Specification and Application
- Table 72. Hangzhou Great Forest Tetrahydrocurcumin Production (Tons), Value (US$ Million), Price (US$/Kg) and Gross Margin (2019-2024)
- Table 73. Hangzhou Great Forest Main Business and Markets Served
- Table 74. Hangzhou Great Forest Recent Developments/Updates
- Table 75. Hangzhou Lingeba Technology Tetrahydrocurcumin Company Information
- Table 76. Hangzhou Lingeba Technology Tetrahydrocurcumin Specification and Application
- Table 77. Hangzhou Lingeba Technology Tetrahydrocurcumin Production (Tons), Value (US$ Million), Price (US$/Kg) and Gross Margin (2019-2024)
- Table 78. Hangzhou Lingeba Technology Main Business and Markets Served
- Table 79. Hangzhou Lin Ran Tetrahydrocurcumin Company Information
- Table 80. Hangzhou Lin Ran Tetrahydrocurcumin Specification and Application
- Table 81. Hangzhou Lin Ran Tetrahydrocurcumin Production (Tons), Value (US$ Million), Price (US$/Kg) and Gross Margin (2019-2024)
- Table 82. Hangzhou Lin Ran Main Business and Markets Served
- Table 83. Plamed Green Science Tetrahydrocurcumin Company Information
- Table 84. Plamed Green Science Tetrahydrocurcumin Specification and Application
- Table 85. Plamed Green Science Tetrahydrocurcumin Production (Tons), Value (US$ Million), Price (US$/Kg) and Gross Margin (2019-2024)
- Table 86. Plamed Green Science Main Business and Markets Served
- Table 87. Plamed Green Science Recent Developments/Updates
- Table 88. Sinoway Industrial Tetrahydrocurcumin Company Information
- Table 89. Sinoway Industrial Tetrahydrocurcumin Specification and Application
- Table 90. Sinoway Industrial Tetrahydrocurcumin Production (Tons), Value (US$ Million), Price (US$/Kg) and Gross Margin (2019-2024)
- Table 91. Sinoway Industrial Main Business and Markets Served
- Table 92. Key Raw Materials Lists
- Table 93. Raw Materials Key Suppliers Lists
- Table 94. Tetrahydrocurcumin Distributors List
- Table 95. Tetrahydrocurcumin Customers List
- Table 96. Tetrahydrocurcumin Market Trends
- Table 97. Tetrahydrocurcumin Market Drivers
- Table 98. Tetrahydrocurcumin Market Challenges
- Table 99. Tetrahydrocurcumin Market Restraints
- Table 100. Research Programs/Design for This Report
- Table 101. Key Data Information from Secondary Sources
- Table 102. Key Data Information from Primary Sources
- Table 103. Authors List of This Report
List of Figures
- Figure 1. Product Picture of Tetrahydrocurcumin
- Figure 2. Global Tetrahydrocurcumin Market Value by Purity, (US$ Million) & (2023 VS 2030)
- Figure 3. Global Tetrahydrocurcumin Market Share by Purity: 2023 VS 2030
- Figure 4. Less than or equal to98% Product Picture
- Figure 5. <98% Product Picture
- Figure 6. Global Tetrahydrocurcumin Market Value by Application, (US$ Million) & (2023 VS 2030)
- Figure 7. Global Tetrahydrocurcumin Market Share by Application: 2023 VS 2030
- Figure 8. Cosmetics
- Figure 9. Pharmaceutical
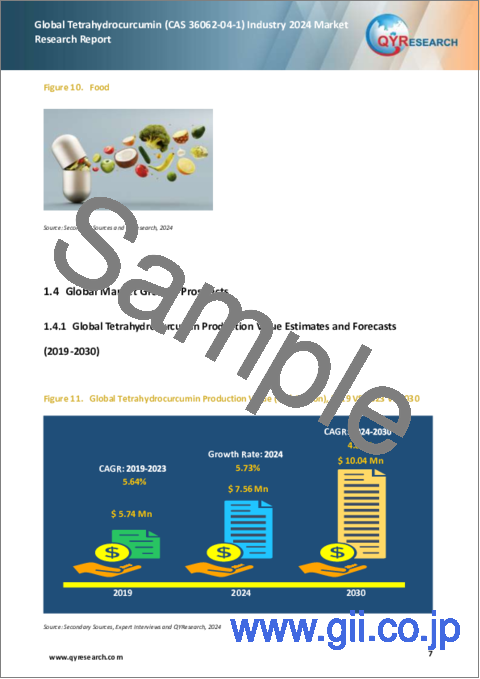
- Figure 10. Food
- Figure 11. Global Tetrahydrocurcumin Production Value (US$ Million), 2019 VS 2023 VS 2030
- Figure 12. Global Tetrahydrocurcumin Production Value (US$ Million) & (2019-2030)
- Figure 13. Global Tetrahydrocurcumin Production Capacity (Tons) & (2019-2030)
- Figure 14. Global Tetrahydrocurcumin Production (Tons) & (2019-2030)
- Figure 15. Global Tetrahydrocurcumin Average Price (US$/Kg) & (2019-2030)
- Figure 16. Tetrahydrocurcumin Report Years Considered
- Figure 17. Tetrahydrocurcumin Production Share by Manufacturers in 2023
- Figure 18. Global Tetrahydrocurcumin Production Value Share by Manufacturers (2023)
- Figure 19. Tetrahydrocurcumin Market Share by Company Type (Tier 1, Tier 2, and Tier 3): 2019 VS 2023
- Figure 20. The Global 5 Largest Players: Market Share by Tetrahydrocurcumin Revenue in 2023
- Figure 21. Global Tetrahydrocurcumin Production Value by Region: 2019 VS 2023 VS 2030 (US$ Million)
- Figure 22. Global Tetrahydrocurcumin Production Value Market Share by Region: 2019 VS 2023 VS 2030
- Figure 23. Global Tetrahydrocurcumin Production Comparison by Region: 2019 VS 2023 VS 2030 (Tons)
- Figure 24. Global Tetrahydrocurcumin Production Market Share by Region: 2019 VS 2023 VS 2030
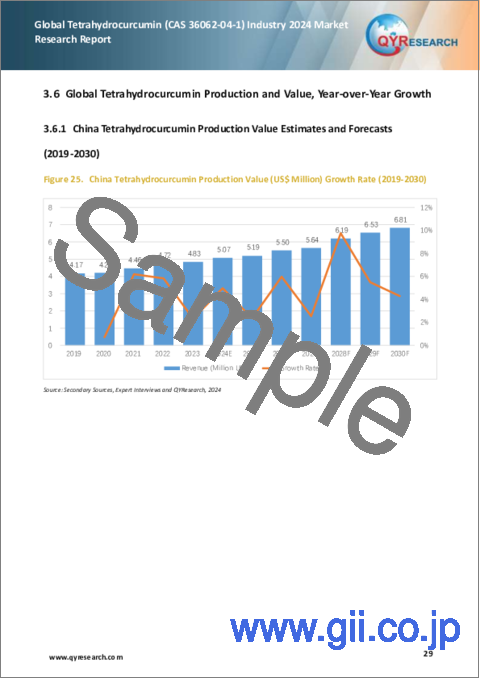
- Figure 25. China Tetrahydrocurcumin Production Value (US$ Million) Growth Rate (2019-2030)
- Figure 26. Global Tetrahydrocurcumin Consumption by Region: 2019 VS 2023 VS 2030 (Tons)
- Figure 27. Global Tetrahydrocurcumin Consumption Market Share by Region: 2019 VS 2023 VS 2030
- Figure 28. North America Tetrahydrocurcumin Consumption and Growth Rate (2019-2030) & (Tons)
- Figure 29. North America Tetrahydrocurcumin Consumption Market Share by Country (2019-2030)
- Figure 30. U.S. Tetrahydrocurcumin Consumption and Growth Rate (2019-2030) & (Tons)
- Figure 31. Canada Tetrahydrocurcumin Consumption and Growth Rate (2019-2030) & (Tons)
- Figure 32. Europe Tetrahydrocurcumin Consumption and Growth Rate (2019-2030) & (Tons)
- Figure 33. Europe Tetrahydrocurcumin Consumption Market Share by Country (2019-2030)
- Figure 34. Germany Tetrahydrocurcumin Consumption and Growth Rate (2019-2030) & (Tons)
- Figure 35. France Tetrahydrocurcumin Consumption and Growth Rate (2019-2030) & (Tons)
- Figure 36. U.K. Tetrahydrocurcumin Consumption and Growth Rate (2019-2030) & (Tons)
- Figure 37. Italy Tetrahydrocurcumin Consumption and Growth Rate (2019-2030) & (Tons)
- Figure 38. Russia Tetrahydrocurcumin Consumption and Growth Rate (2019-2030) & (Tons)
- Figure 39. Asia Pacific Tetrahydrocurcumin Consumption and Growth Rate (2019-2030) & (Tons)
- Figure 40. Asia Pacific Tetrahydrocurcumin Consumption Market Share by Region (2025-2030)
- Figure 41. China Tetrahydrocurcumin Consumption and Growth Rate (2019-2030) & (Tons)
- Figure 42. Japan Tetrahydrocurcumin Consumption and Growth Rate (2019-2030) & (Tons)
- Figure 43. South Korea Tetrahydrocurcumin Consumption and Growth Rate (2019-2030) & (Tons)
- Figure 44. Southeast Asia Tetrahydrocurcumin Consumption and Growth Rate (2019-2030) & (Tons)
- Figure 45. India Tetrahydrocurcumin Consumption and Growth Rate (2019-2030) & (Tons)
- Figure 46. Australia Tetrahydrocurcumin Consumption and Growth Rate (2019-2030) & (Tons)
- Figure 47. Latin America Tetrahydrocurcumin Consumption and Growth Rate (2019-2030) & (Tons)
- Figure 48. Latin America Tetrahydrocurcumin Consumption Market Share by Country (2019-2030)
- Figure 49. Mexico Tetrahydrocurcumin Consumption and Growth Rate (2019-2030) & (Tons)
- Figure 50. Brazil Tetrahydrocurcumin Consumption and Growth Rate (2019-2030) & (Tons)
- Figure 51. Middle East & Africa Tetrahydrocurcumin Consumption and Growth Rate (2019-2030) & (Tons)
- Figure 52. Global Production Market Share of Tetrahydrocurcumin by Purity (2019-2030)
- Figure 53. Global Production Value Market Share of Tetrahydrocurcumin by Purity (2019-2030)
- Figure 54. Global Tetrahydrocurcumin Price (US$/Kg) by Purity (2019-2030)
- Figure 55. Global Production Market Share of Tetrahydrocurcumin by Application (2019-2030)
- Figure 56. Global Production Value Market Share of Tetrahydrocurcumin by Application (2019-2030)
- Figure 57. Global Tetrahydrocurcumin Price (US$/Kg) by Application (2019-2030)
- Figure 58. Tetrahydrocurcumin Value Chain
- Figure 59. Tetrahydrocurcumin Production Process
- Figure 60. Channels of Distribution (Direct Vs Distribution)
- Figure 61. Bottom-up and Top-down Approaches for This Report
- Figure 62. Data Triangulation
Global Tetrahydrocurcumin (CAS 36062-04-1) market size in terms of revenue is projected to reach 10.04 Million USD by 2030 from 7.15 Million USD in 2023, with a CAGR 4.84% during 2024-2030. Global Tetrahydrocurcumin market size in terms of sales is projected to reach 33.33 MT by 2030 from 23.89 MT in 2023, with a CAGR 4.55% during 2024-2030.
North America market for Tetrahydrocurcumin is estimated to increase from 1.84 million USD in 2023 to reach 2.49 million USD by 2030, at a CAGR of 3.81% during the forecast period of 2024 through 2030.
Europe market for Tetrahydrocurcumin is estimated to increase from 1.71 million USD in 2023 to reach 2.34 million USD by 2030, at a CAGR of 4.37% during the forecast period of 2024 through 2030.
Asia-Pacific market for Tetrahydrocurcumin is estimated to increase from 3.19 million USD in 2023 to reach 4.66 million USD by 2030, at a CAGR of 5.71% during the forecast period of 2024 through 2030.
The major global manufacturers of Tetrahydrocurcumin include Huateng Pharma, Hangzhou Great Forest, Hangzhou Lingeba Technology, Hangzhou Linran Biotechnology, Plamed Green Science, Sinoway Industrial, etc. In 2023, the world's top five vendors accounted for approximately 47.13% of the revenue.
This report aims to provide a comprehensive presentation of the global market for Tetrahydrocurcumin, with both quantitative and qualitative analysis, to help readers develop business/growth strategies, assess the market competitive situation, analyze their position in the current marketplace, and make informed business decisions regarding Tetrahydrocurcumin.
The Tetrahydrocurcumin market size, estimations, and forecasts are provided in terms of output/shipments (Tons) and revenue ($ millions), considering 2023 as the base year, with history and forecast data for the period from 2019 to 2030. This report segments the global Tetrahydrocurcumin market comprehensively. Regional market sizes, concerning products by Purity, by Application, and by players, are also provided.
For a more in-depth understanding of the market, the report provides profiles of the competitive landscape, key competitors, and their respective market ranks. The report also discusses technological trends and new product developments.
The report will help the Tetrahydrocurcumin manufacturers, new entrants, and industry chain related companies in this market with information on the revenues, production, and average price for the overall market and the sub-segments across the different segments, by company, by Purity, by Application, and by regions.
Market Segmentation
By Company
- Huateng Pharma
- Hangzhou Great Forest
- Hangzhou Lingeba Technology
- Hangzhou Linran Biotechnology
- Plamed Green Science
- Sinoway Industrial
Segment by Purity
- >98%
- <98%
Segment by Application
- Cosmetics
- Pharmaceutical
- Food
Production by Region
- China
- Other Regions
Consumption by Region
- North America
- U.S.
- Canada
- Asia-Pacific
- China
- Japan
- South Korea
- Southeast Asia
- India
- Australia
- Europe
- Germany
- France
- U.K.
- Italy
- Russia
- Rest of Europe
- South America
- Mexico
- Brazil
- Rest of South America
Chapter Outline
Chapter 1: Introduces the report scope of the report, executive summary of different market segments (by region, by Purity, by Application, etc), including the market size of each market segment, future development potential, and so on. It offers a high-level view of the current state of the market and its likely evolution in the short to mid-term, and long term.
Chapter 2: Detailed analysis of Tetrahydrocurcumin manufacturers competitive landscape, price, production and value market share, latest development plan, merger, and acquisition information, etc.
Chapter 3: Production/output, value of Tetrahydrocurcumin by region/country. It provides a quantitative analysis of the market size and development potential of each region in the next six years.
Chapter 4: Consumption of Tetrahydrocurcumin in regional level and country level. It provides a quantitative analysis of the market size and development potential of each region and its main countries and introduces the market development, future development prospects, market space, and production of each country in the world.
Chapter 5: Provides the analysis of various market segments by Purity, covering the market size and development potential of each market segment, to help readers find the blue ocean market in different market segments.
Chapter 6: Provides the analysis of various market segments by Application, covering the market size and development potential of each market segment, to help readers find the blue ocean market in different downstream markets.
Chapter 7: Provides profiles of key players, introducing the basic situation of the main companies in the market in detail, including product production/output, value, price, gross margin, product introduction, recent development, etc.
Chapter 8: Analysis of industrial chain, including the upstream and downstream of the industry.
Chapter 9: Introduces the market dynamics, latest developments of the market, the driving factors and restrictive factors of the market, the challenges and risks faced by manufacturers in the industry, and the analysis of relevant policies in the industry.
Chapter 10: The main points and conclusions of the report.
Table of Contents
1 Tetrahydrocurcumin Market Overview
- 1.1 Product Definition
- 1.2 Tetrahydrocurcumin by Purity
- 1.2.1 Global Tetrahydrocurcumin Market Value Growth Rate Analysis by Purity: 2023 VS 2030
- 1.2.2 >98%
- 1.2.3 <98%
- 1.3 Tetrahydrocurcumin by Application
- 1.3.1 Global Tetrahydrocurcumin Market Value Growth Rate Analysis by Application: 2023 VS 2030
- 1.3.2 Cosmetics
- 1.3.3 Pharmaceutical
- 1.3.4 Food
- 1.4 Global Market Growth Prospects
- 1.4.1 Global Tetrahydrocurcumin Production Value Estimates and Forecasts (2019-2030)
- 1.4.2 Global Tetrahydrocurcumin Production Capacity Estimates and Forecasts (2019-2030)
- 1.4.3 Global Tetrahydrocurcumin Production Estimates and Forecasts (2019-2030)
- 1.4.4 Global Tetrahydrocurcumin Market Average Price Estimates and Forecasts (2019-2030)
- 1.5 Assumptions and Limitations
2 Market Competition by Manufacturers
- 2.1 Global Tetrahydrocurcumin Production Market Share by Manufacturers (2019-2024)
- 2.2 Global Tetrahydrocurcumin Production Value Market Share by Manufacturers (2019-2024)
- 2.3 Global Key Players of Tetrahydrocurcumin, Industry Ranking, 2022 VS 2023
- 2.4 Global Tetrahydrocurcumin Market Share by Company Type (Tier 1, Tier 2, and Tier 3)
- 2.5 Global Tetrahydrocurcumin Average Price by Manufacturers (2019-2024)
- 2.6 Global Key Manufacturers of Tetrahydrocurcumin, Manufacturing Base Distribution and Headquarters
- 2.7 Global Key Manufacturers of Tetrahydrocurcumin, Product Offered and Application
- 2.8 Global Key Manufacturers of Tetrahydrocurcumin, Date of Enter into This Industry
- 2.9 Tetrahydrocurcumin Market Competitive Situation and Trends
- 2.9.1 Tetrahydrocurcumin Market Concentration Rate
- 2.9.2 Global 5 Largest Tetrahydrocurcumin Players Market Share by Revenue
- 2.10 Mergers & Acquisitions, Expansion
3 Tetrahydrocurcumin Production by Region
- 3.1 Global Tetrahydrocurcumin Production Value Estimates and Forecasts by Region: 2019 VS 2023 VS 2030
- 3.2 Global Tetrahydrocurcumin Production Value by Region (2019-2030)
- 3.2.1 Global Tetrahydrocurcumin Production Value Market Share by Region (2019-2024)
- 3.2.2 Global Forecasted Production Value of Tetrahydrocurcumin by Region (2025-2030)
- 3.3 Global Tetrahydrocurcumin Production Estimates and Forecasts by Region: 2019 VS 2023 VS 2030
- 3.4 Global Tetrahydrocurcumin Production by Region (2019-2030)
- 3.4.1 Global Tetrahydrocurcumin Production Market Share by Region (2019-2024)
- 3.4.2 Global Forecasted Production of Tetrahydrocurcumin by Region (2025-2030)
- 3.5 Global Tetrahydrocurcumin Market Price Analysis by Region (2019-2024)
- 3.6 Global Tetrahydrocurcumin Production and Value, Year-over-Year Growth
- 3.6.1 China Tetrahydrocurcumin Production Value Estimates and Forecasts (2019-2030)
4 Tetrahydrocurcumin Consumption by Region
- 4.1 Global Tetrahydrocurcumin Consumption Estimates and Forecasts by Region: 2019 VS 2023 VS 2030
- 4.2 Global Tetrahydrocurcumin Consumption by Region (2019-2030)
- 4.2.1 Global Tetrahydrocurcumin Consumption by Region (2019-2030)
- 4.2.2 Global Tetrahydrocurcumin Forecasted Consumption by Region (2025-2030)
- 4.3 North America
- 4.3.1 North America Tetrahydrocurcumin Consumption Growth Rate by Country: 2019 VS 2023 VS 2030
- 4.3.2 North America Tetrahydrocurcumin Consumption by Country (2019-2030)
- 4.3.3 U.S.
- 4.3.4 Canada
- 4.4 Europe
- 4.4.1 Europe Tetrahydrocurcumin Consumption Growth Rate by Country: 2019 VS 2023 VS 2030
- 4.4.2 Europe Tetrahydrocurcumin Consumption by Country (2019-2030)
- 4.4.3 Germany
- 4.4.4 France
- 4.4.5 U.K.
- 4.4.6 Italy
- 4.4.7 Russia
- 4.5 Asia Pacific
- 4.5.1 Asia Pacific Tetrahydrocurcumin Consumption Growth Rate by Country: 2019 VS 2023 VS 2030
- 4.5.2 Asia Pacific Tetrahydrocurcumin Consumption by Region (2019-2030)
- 4.5.3 China
- 4.5.4 Japan
- 4.5.5 South Korea
- 4.5.6 Southeast Asia
- 4.5.7 India
- 4.5.8 Australia
- 4.6 Latin America
- 4.6.1 Latin America Tetrahydrocurcumin Consumption Growth Rate by Country: 2019 VS 2023 VS 2030
- 4.6.2 Latin America Tetrahydrocurcumin Consumption by Country (2019-2030)
- 4.6.3 Mexico
- 4.6.4 Brazil
- 4.7 Middle East & Africa
5 Segment by Purity
- 5.1 Global Tetrahydrocurcumin Production by Purity (2019-2030)
- 5.1.1 Global Tetrahydrocurcumin Production by Purity (2019-2024)
- 5.1.2 Global Tetrahydrocurcumin Production by Purity (2025-2030)
- 5.1.3 Global Tetrahydrocurcumin Production Market Share by Purity (2019-2030)
- 5.2 Global Tetrahydrocurcumin Production Value by Purity (2019-2030)
- 5.2.1 Global Tetrahydrocurcumin Production Value by Purity (2019-2024)
- 5.2.2 Global Tetrahydrocurcumin Production Value by Purity (2025-2030)
- 5.2.3 Global Tetrahydrocurcumin Production Value Market Share by Purity (2019-2030)
- 5.3 Global Tetrahydrocurcumin Price by Purity (2019-2030)
6 Segment by Application
- 6.1 Global Tetrahydrocurcumin Production by Application (2019-2030)
- 6.1.1 Global Tetrahydrocurcumin Production by Application (2019-2024)
- 6.1.2 Global Tetrahydrocurcumin Production by Application (2025-2030)
- 6.1.3 Global Tetrahydrocurcumin Production Market Share by Application (2019-2030)
- 6.2 Global Tetrahydrocurcumin Production Value by Application (2019-2030)
- 6.2.1 Global Tetrahydrocurcumin Production Value by Application (2019-2024)
- 6.2.2 Global Tetrahydrocurcumin Production Value by Application (2025-2030)
- 6.2.3 Global Tetrahydrocurcumin Production Value Market Share by Application (2019-2030)
- 6.3 Global Tetrahydrocurcumin Price by Application (2019-2030)
7 Key Companies Profiled
- 7.1 Huateng Pharma
- 7.1.1 Huateng Pharma Tetrahydrocurcumin Company Information
- 7.1.2 Huateng Pharma Tetrahydrocurcumin Product Portfolio
- 7.1.3 Huateng Pharma Tetrahydrocurcumin Production, Value, Price and Gross Margin (2019-2024)
- 7.1.4 Huateng Pharma Main Business and Markets Served
- 7.1.5 Huateng Pharma Recent Developments/Updates
- 7.2 Hangzhou Great Forest
- 7.2.1 Hangzhou Great Forest Tetrahydrocurcumin Company Information
- 7.2.2 Hangzhou Great Forest Tetrahydrocurcumin Product Portfolio
- 7.2.3 Hangzhou Great Forest Tetrahydrocurcumin Production, Value, Price and Gross Margin (2019-2024)
- 7.2.4 Hangzhou Great Forest Main Business and Markets Served
- 7.2.5 Hangzhou Great Forest Recent Developments/Updates
- 7.3 Hangzhou Lingeba Technology
- 7.3.1 Hangzhou Lingeba Technology Tetrahydrocurcumin Company Information
- 7.3.2 Hangzhou Lingeba Technology Tetrahydrocurcumin Product Portfolio
- 7.3.3 Hangzhou Lingeba Technology Tetrahydrocurcumin Production, Value, Price and Gross Margin (2019-2024)
- 7.3.4 Hangzhou Lingeba Technology Main Business and Markets Served
- 7.4 Hangzhou Lin Ran
- 7.4.1 Hangzhou Lin Ran Tetrahydrocurcumin Company Information
- 7.4.2 Hangzhou Lin Ran Tetrahydrocurcumin Product Portfolio
- 7.4.3 Hangzhou Lin Ran Tetrahydrocurcumin Production, Value, Price and Gross Margin (2019-2024)
- 7.4.4 Hangzhou Lin Ran Main Business and Markets Served
- 7.5 Plamed Green Science
- 7.5.1 Plamed Green Science Tetrahydrocurcumin Company Information
- 7.5.2 Plamed Green Science Tetrahydrocurcumin Product Portfolio
- 7.5.3 Plamed Green Science Tetrahydrocurcumin Production, Value, Price and Gross Margin (2019-2024)
- 7.5.4 Plamed Green Science Main Business and Markets Served
- 7.5.5 Plamed Green Science Recent Developments/Updates
- 7.6 Sinoway Industrial
- 7.6.1 Sinoway Industrial Tetrahydrocurcumin Company Information
- 7.6.2 Sinoway Industrial Tetrahydrocurcumin Product Portfolio
- 7.6.3 Sinoway Industrial Tetrahydrocurcumin Production, Value, Price and Gross Margin (2019-2024)
- 7.6.4 Sinoway Industrial Main Business and Markets Served
8 Industry Chain and Sales Channels Analysis
- 8.1 Tetrahydrocurcumin Industry Chain Analysis
- 8.2 Tetrahydrocurcumin Key Raw Materials
- 8.2.1 Key Raw Materials
- 8.2.2 Raw Materials Key Suppliers
- 8.3 Tetrahydrocurcumin Production Mode & Process
- 8.4 Tetrahydrocurcumin Sales and Marketing
- 8.4.1 Tetrahydrocurcumin Sales Channels
- 8.4.2 Tetrahydrocurcumin Distributors
- 8.5 Tetrahydrocurcumin Customers
9 Tetrahydrocurcumin Market Dynamics
- 9.1 Tetrahydrocurcumin Industry Trends
- 9.2 Tetrahydrocurcumin Market Drivers
- 9.3 Tetrahydrocurcumin Market Challenges
- 9.4 Tetrahydrocurcumin Market Restraints
10 Research Findings and Conclusion
11 Methodology and Data Source
- 11.1 Methodology/Research Approach
- 11.1.1 Research Programs/Design
- 11.1.2 Market Size Estimation
- 11.1.3 Market Breakdown and Data Triangulation
- 11.2 Data Source
- 11.2.1 Secondary Sources
- 11.2.2 Primary Sources
- 11.3 Author List
- 11.4 Disclaimer

