|
|
市場調査レポート
商品コード
1426862
宝石および宝飾品の世界市場:考察と予測 (~2030年)Global Gems and Jewelry Market Insights, Forecast to 2030 |
||||||
|
|||||||
カスタマイズ可能
適宜更新あり
|
|||||||

| 宝石および宝飾品の世界市場:考察と予測 (~2030年) |
|
出版日: 2024年02月18日
発行: QYResearch
ページ情報: 英文 203 Pages
納期: 2~3営業日
|

全表示
- 概要
- 図表
- 目次
世界の宝石および宝飾品の市場規模は、2024年の1,776億米ドルから2030年には2,601億米ドルに成長し、予測期間中の年間平均成長率(CAGR)は6.6%になると予測されています。
宝石および宝飾品の世界の主要メーカーには、Chow Tai Fook、Richemont、Signet Jewellers、Swatch Group、Rajesh Exports、Lao Feng Xiang、Kering、Malabar Gold and Diamonds、LVMH、Daniel Swarovskiなどがあります。2023年、世界の上位5社の収益面でのシェアは約36%でした。
当レポートでは、世界の宝石および宝飾品市場について調査し、市場の概要とともに、タイプ別、チャネル別、地域別の動向、および市場に参入する企業のプロファイルなどを提供しています。
目次
第1章 調査内容
- 宝石および宝飾品の製品イントロダクション
- タイプ別市場
- チャネル別市場
- 前提と制限
- 調査目的
- 対象年
第2章 エグゼクティブサマリー
第3章 メーカーによる競合
第4章 市場規模、タイプ別
- 世界の宝石および宝飾品の販売高、タイプ別
- 世界の宝石および宝飾品の収益、タイプ別
- 世界の宝石および宝飾品の価格、タイプ別
第5章 市場規模、チャネル別
- 世界の宝石および宝飾品の販売高、チャネル別
- 世界の宝石および宝飾品の収益、チャネル別
- 世界の宝石および宝飾品の価格、チャネル別
第6章 米国とカナダ
第7章 欧州
第8章 中国
第9章 アジア太平洋(中国を除く)
第10章 中東・アフリカ、ラテンアメリカ
第11章 企業プロファイル
- Chow Tai Fook
- Richemont
- Signet Jewellers
- Swatch Group
- Rajesh Exports
- Lao Feng Xiang
- Kering
- Malabar Gold and Diamonds
- LVMH
- Daniel Swarovski
- De Beers
- Chow Sang Sang
- Luk Fook
- Pandora
- Titan
- Stuller
- Gitanjali Gems
- Mingr
- Graff Diamond
- Caibai Jewelry
- Damas International
- Cuihua Gold
- Tse Sui Luen
- CHJ
- Asian Star Company
- TBZ Shrikant Zaveri
- Thangamayil
第12章 産業チェーンと販売チャネルの分析
- 宝石および宝飾品業界のチェーン分析
- 宝石および宝飾品の主要原材料
- 宝石および宝飾品の生産モードとプロセス
- 宝石および宝飾品の販売業者
第13章 宝石および宝飾品市場力学
- 宝石および宝飾品業界の動向
- 宝石および宝飾品市場の促進要因
- 宝石および宝飾品市場の課題
- 宝石および宝飾品市場の抑制要因
第14章 世界の宝石および宝飾品調査における主な調査結果
第15章 付録
List of Tables
- Table 1. Global Gems and Jewelry Market Size Growth Rate by Type, 2019 VS 2023 VS 2030 (US$ Million)
- Table 2. Product Picture of Gold Jewelry
- Table 3. GIA Diamond Grading Laboratory Data
- Table 4. Others Products
- Table 5. Global Gems and Jewelry Market Size Growth Rate by Channel, 2019 VS 2023 VS 2030 (US$ Million)
- Table 6. Global Gems and Jewelry Revenue Grow Rate (CAGR) by Region: 2019 VS 2023 VS 2030 (US$ Million)
- Table 7. Global Gems and Jewelry Revenue by Region (2019-2024) & (US$ Million)
- Table 8. Global Gems and Jewelry Revenue by Region (2025-2030) & (US$ Million)
- Table 9. Global Gems and Jewelry Revenue Market Share by Region (2019-2024)
- Table 10. Global Gems and Jewelry Revenue Market Share by Region (2025-2030)
- Table 11. Global Gems and Jewelry Sales Grow Rate (CAGR) by Region: 2019 VS 2023 VS 2030 (K Units)
- Table 12. Global Gems and Jewelry Sales by Region (2019-2024) & (K Units)
- Table 13. Global Gems and Jewelry Sales by Region (2025-2030) & (K Units)
- Table 14. Global Gems and Jewelry Sales Market Share by Region (2019-2024)
- Table 15. Global Gems and Jewelry Sales Market Share by Region (2025-2030)
- Table 16. Global Gems and Jewelry Sales by Manufacturers (2019-2024) & (K Units)
- Table 17. Global Gems and Jewelry Sales Share by Manufacturers (2019-2024)
- Table 18. Global Gems and Jewelry Revenue by Manufacturers (2019-2024) & (US$ Million)
- Table 19. Global Gems and Jewelry Revenue Market Share by Manufacturers (2019-2024)
- Table 20. Global Key Players of Gems and Jewelry, Industry Ranking, 2023
- Table 21. Gems and Jewelry Price by Manufacturers (2019-2024) & (USD/Unit)
- Table 22. Global Gems and Jewelry Manufacturers Market Concentration Ratio (CR5)
- Table 23. Global Key Manufacturers of Gems and Jewelry, Sales Distribution and Headquarters
- Table 24. Mergers & Acquisitions, Expansion Plans
- Table 25. Global Gems and Jewelry Sales by Type (2019-2024) & (K Units)
- Table 26. Global Gems and Jewelry Sales by Type (2025-2030) & (K Units)
- Table 27. Global Gems and Jewelry Sales Share by Type (2019-2024)
- Table 28. Global Gems and Jewelry Sales Share by Type (2025-2030)
- Table 29. Global Gems and Jewelry Revenue by Type (2019-2024) & (US$ Million)
- Table 30. Global Gems and Jewelry Revenue by Type (2025-2030) & (US$ Million)
- Table 31. Global Gems and Jewelry Revenue Share by Type (2019-2024)
- Table 32. Global Gems and Jewelry Revenue Share by Type (2025-2030)
- Table 33. Gems and Jewelry Price by Type (2019-2024) & (USD/Unit)
- Table 34. Global Gems and Jewelry Price Forecast by Type (2025-2030) & (USD/Unit)
- Table 35. Global Gems and Jewelry Sales by Channel (2019-2024) & (K Units)
- Table 36. Global Gems and Jewelry Sales by Channel (2025-2030) & (K Units)
- Table 37. Global Gems and Jewelry Sales Share by Channel (2019-2024)
- Table 38. Global Gems and Jewelry Sales Share by Channel (2025-2030)
- Table 39. Global Gems and Jewelry Revenue by Channel (2019-2024) & (US$ Million)
- Table 40. Global Gems and Jewelry Revenue by Channel (2025-2030) & (US$ Million)
- Table 41. Global Gems and Jewelry Revenue Share by Channel (2019-2024)
- Table 42. Global Gems and Jewelry Revenue Share by Channel (2025-2030)
- Table 43. Gems and Jewelry Price by Channel (2019-2024) & (USD/Unit)
- Table 44. Global Gems and Jewelry Price Forecast by Channel (2025-2030) & (USD/Unit)
- Table 45. US & Canada Gems and Jewelry Sales by Type (2019-2024) & (K Units)
- Table 46. US & Canada Gems and Jewelry Sales by Type (2025-2030) & (K Units)
- Table 47. US & Canada Gems and Jewelry Revenue by Type (2019-2024) & (US$ Million)
- Table 48. US & Canada Gems and Jewelry Revenue by Type (2025-2030) & (US$ Million)
- Table 49. US & Canada Gems and Jewelry Sales by Channel (2019-2024) & (K Units)
- Table 50. US & Canada Gems and Jewelry Sales by Channel (2025-2030) & (K Units)
- Table 51. US & Canada Gems and Jewelry Revenue by Channel (2019-2024) & (US$ Million)
- Table 52. US & Canada Gems and Jewelry Revenue by Channel (2025-2030) & (US$ Million)
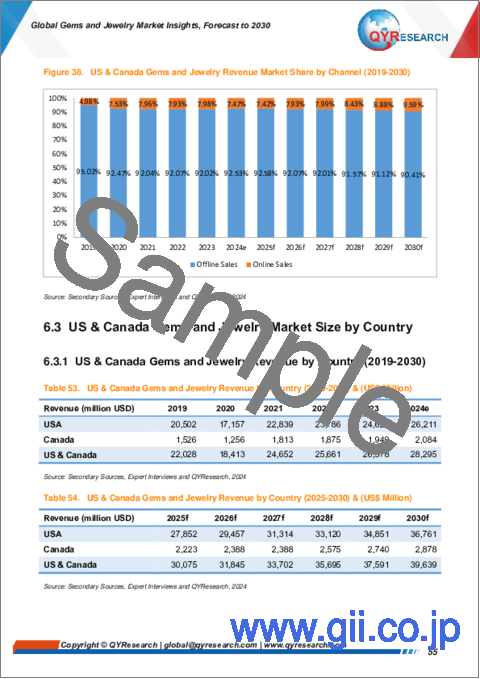
- Table 53. US & Canada Gems and Jewelry Revenue by Country (2019-2024) & (US$ Million)
- Table 54. US & Canada Gems and Jewelry Revenue by Country (2025-2030) & (US$ Million)
- Table 55. US & Canada Gems and Jewelry Sales by Country (2019-2024) & (K Units)
- Table 56. US & Canada Gems and Jewelry Sales by Country (2025-2030) & (K Units)
- Table 57. Europe Gems and Jewelry Sales by Type (2019-2024) & (K Units)
- Table 58. Europe Gems and Jewelry Sales by Type (2025-2030) & (K Units)
- Table 59. Europe Gems and Jewelry Revenue by Type (2019-2024) & (US$ Million)
- Table 60. Europe Gems and Jewelry Revenue by Type (2025-2030) & (US$ Million)
- Table 61. Europe Gems and Jewelry Sales by Channel (2019-2024) & (K Units)
- Table 62. Europe Gems and Jewelry Sales by Channel (2025-2030) & (K Units)
- Table 63. Europe Gems and Jewelry Revenue by Channel (2019-2024) & (US$ Million)
- Table 64. Europe Gems and Jewelry Revenue by Channel (2025-2030) & (US$ Million)
- Table 65. Europe Gems and Jewelry Revenue by Country (2019-2024) & (US$ Million)
- Table 66. Europe Gems and Jewelry Revenue by Country (2025-2030) & (US$ Million)
- Table 67. Europe Gems and Jewelry Sales by Country (2019-2024) & (K Units)
- Table 68. Europe Gems and Jewelry Sales by Country (2025-2030) & (K Units)
- Table 69. China Gems and Jewelry Sales by Type (2019-2024) & (K Units)
- Table 70. China Gems and Jewelry Sales by Type (2025-2030) & (K Units)
- Table 71. China Gems and Jewelry Revenue by Type (2019-2024) & (US$ Million)
- Table 72. China Gems and Jewelry Revenue by Type (2025-2030) & (US$ Million)
- Table 73. China Gems and Jewelry Sales by Channel (2019-2024) & (K Units)
- Table 74. China Gems and Jewelry Sales by Channel (2025-2030) & (K Units)
- Table 75. China Gems and Jewelry Revenue by Channel (2019-2024) & (US$ Million)
- Table 76. China Gems and Jewelry Revenue by Channel (2025-2030) & (US$ Million)
- Table 77. Asia Pacific Gems and Jewelry Sales by Type (2019-2024) & (K Units)
- Table 78. Asia Pacific Gems and Jewelry Sales by Type (2025-2030) & (K Units)
- Table 79. Asia Pacific Gems and Jewelry Revenue by Type (2019-2024) & (US$ Million)
- Table 80. Asia Pacific Gems and Jewelry Revenue by Type (2025-2030) & (US$ Million)
- Table 81. Asia Pacific Gems and Jewelry Sales by Channel (2019-2024) & (K Units)
- Table 82. Asia Pacific Gems and Jewelry Sales by Channel (2025-2030) & (K Units)
- Table 83. Asia Pacific Gems and Jewelry Revenue by Channel (2019-2024) & (US$ Million)
- Table 84. Asia Pacific Gems and Jewelry Revenue by Channel (2025-2030) & (US$ Million)
- Table 85. Asia Pacific Gems and Jewelry Revenue by Region (2019-2024) & (US$ Million)
- Table 86. Asia Pacific Gems and Jewelry Revenue by Region (2025-2030) & (US$ Million)
- Table 87. Asia Pacific Gems and Jewelry Sales by Region (2019-2024) & (K Units)
- Table 88. Asia Pacific Gems and Jewelry Sales by Region (2025-2030) & (K Units)
- Table 89. Middle East, Africa and Latin America Gems and Jewelry Sales by Type (2019-2024) & (K Units)
- Table 90. Middle East, Africa and Latin America Gems and Jewelry Sales by Type (2025-2030) & (K Units)
- Table 91. Middle East, Africa and Latin America Gems and Jewelry Revenue by Type (2019-2024) & (US$ Million)
- Table 92. Middle East, Africa and Latin America Gems and Jewelry Revenue by Type (2025-2030) & (US$ Million)
- Table 93. Middle East, Africa and Latin America Gems and Jewelry Sales by Channel (2019-2024) & (K Units)
- Table 94. Middle East, Africa and Latin America Gems and Jewelry Sales by Channel (2025-2030) & (K Units)
- Table 95. Middle East, Africa and Latin America Gems and Jewelry Revenue by Channel (2019-2024) & (US$ Million)
- Table 96. Middle East, Africa and Latin America Gems and Jewelry Revenue by Channel (2025-2030) & (US$ Million)
- Table 97. Middle East, Africa and Latin America Gems and Jewelry Revenue by Country (2019-2024) & (US$ Million)
- Table 98. Middle East, Africa and Latin America Gems and Jewelry Revenue by Country (2025-2030) & (US$ Million)
- Table 99. Middle East, Africa and Latin America Gems and Jewelry Sales by Country (2019-2024) & (K Units)
- Table 100. Middle East, Africa and Latin America Gems and Jewelry Sales by Country (2025-2030) & (K Units)
- Table 101. Chow Tai Fook Company Information
- Table 102. Chow Tai Fook Description and Major Businesses
- Table 103. Chow Tai Fook Gems and Jewelry Sales (K Units), Revenue (US$ Million), Price (USD/Unit) and Gross Margin (2019-2024)
- Table 104. Chow Tai Fook Gems and Jewelry Product Model Numbers, Pictures, Descriptions and Specifications
- Table 105. Chow Tai Fook Recent Developments
- Table 106. Richemont Company Information
- Table 107. Richemont Description and Major Businesses
- Table 108. Richemont Gems and Jewelry Sales (K Units), Revenue (US$ Million), Price (USD/Unit) and Gross Margin (2019-2024)
- Table 109. Richemont Gems and Jewelry Product Model Numbers, Pictures, Descriptions and Specifications
- Table 110. Richemont Recent Developments
- Table 111. Signet Jewellers Company Information
- Table 112. Signet Jewellers Description and Major Businesses
- Table 113. Signet Jewellers Gems and Jewelry Sales (K Units), Revenue (US$ Million), Price (USD/Unit) and Gross Margin (2019-2024)
- Table 114. Signet Jewellers Gems and Jewelry Product Model Numbers, Pictures, Descriptions and Specifications
- Table 115. Signet Jewellers Recent Developments
- Table 116. Swatch Group Company Information
- Table 117. Swatch Group Description and Major Businesses
- Table 118. Swatch Group Gems and Jewelry Sales (K Units), Revenue (US$ Million), Price (USD/Unit) and Gross Margin (2019-2024)
- Table 119. Swatch Group Gems and Jewelry Product Model Numbers, Pictures, Descriptions and Specifications
- Table 120. Rajesh Exports Company Information
- Table 121. Rajesh Exports Description and Major Businesses
- Table 122. Rajesh Exports Gems and Jewelry Sales (K Units), Revenue (US$ Million), Price (USD/Unit) and Gross Margin (2019-2024)
- Table 123. Rajesh Exports Gems and Jewelry Product Model Numbers, Pictures, Descriptions and Specifications
- Table 124. Lao Feng Xiang Company Information
- Table 125. Lao Feng Xiang Description and Major Businesses
- Table 126. Lao Feng Xiang Gems and Jewelry Sales (K Units), Revenue (US$ Million), Price (USD/Unit) and Gross Margin (2019-2024)
- Table 127. Lao Feng Xiang Gems and Jewelry Product Model Numbers, Pictures, Descriptions and Specifications
- Table 128. Kering Company Information
- Table 129. Kering Description and Major Businesses
- Table 130. Kering Gems and Jewelry Sales (K Units), Revenue (US$ Million), Price (USD/Unit) and Gross Margin (2019-2024)
- Table 131. Kering Gems and Jewelry Product Model Numbers, Pictures, Descriptions and Specifications
- Table 132. Malabar Gold and Diamonds Company Information
- Table 133. Malabar Gold and Diamonds Description and Major Businesses
- Table 134. Malabar Gold and Diamonds Gems and Jewelry Sales (K Units), Revenue (US$ Million), Price (USD/Unit) and Gross Margin (2019-2024)
- Table 135. Malabar Gold and Diamonds Gems and Jewelry Product Model Numbers, Pictures, Descriptions and Specifications
- Table 136. Malabar Gold and Diamonds Recent Developments
- Table 137. LVMH Company Information
- Table 138. LVMH Description and Major Businesses
- Table 139. LVMH Gems and Jewelry Sales (K Units), Revenue (US$ Million), Price (USD/Unit) and Gross Margin (2019-2024)
- Table 140. LVMH Gems and Jewelry Product Model Numbers, Pictures, Descriptions and Specifications
- Table 141. LVMH Recent Developments
- Table 142. Daniel Swarovski Company Information
- Table 143. Daniel Swarovski Description and Major Businesses
- Table 144. Daniel Swarovski Gems and Jewelry Sales (K Units), Revenue (US$ Million), Price (USD/Unit) and Gross Margin (2019-2024)
- Table 145. Daniel Swarovski Gems and Jewelry Product Model Numbers, Pictures, Descriptions and Specifications
- Table 146. De Beers Company Information
- Table 147. De Beers Description and Major Businesses
- Table 148. De Beers Gems and Jewelry Sales (K Units), Revenue (US$ Million), Price (USD/Unit) and Gross Margin (2019-2024)
- Table 149. De Beers Gems and Jewelry Product Model Numbers, Pictures, Descriptions and Specifications
- Table 150. De Beers Recent Developments
- Table 151. Chow Sang Sang Company Information
- Table 152. Chow Sang Sang Description and Major Businesses
- Table 153. Chow Sang Sang Gems and Jewelry Sales (K Units), Revenue (US$ Million), Price (USD/Unit) and Gross Margin (2019-2024)
- Table 154. Chow Sang Sang Gems and Jewelry Product Model Numbers, Pictures, Descriptions and Specifications
- Table 155. Luk Fook Company Information
- Table 156. Luk Fook Description and Major Businesses
- Table 157. Luk Fook Gems and Jewelry Sales (K Units), Revenue (US$ Million), Price (USD/Unit) and Gross Margin (2019-2024)
- Table 158. Luk Fook Gems and Jewelry Product Model Numbers, Pictures, Descriptions and Specifications
- Table 159. Luk Fook Recent Developments
- Table 160. Pandora Company Information
- Table 161. Pandora Description and Major Businesses
- Table 162. Pandora Gems and Jewelry Sales (K Units), Revenue (US$ Million), Price (USD/Unit) and Gross Margin (2019-2024)
- Table 163. Pandora Gems and Jewelry Product Model Numbers, Pictures, Descriptions and Specifications
- Table 164. Pandora Recent Developments
- Table 165. Titan Company Information
- Table 166. Titan Description and Major Businesses
- Table 167. Titan Gems and Jewelry Sales (K Units), Revenue (US$ Million), Price (USD/Unit) and Gross Margin (2019-2024)
- Table 168. Titan Gems and Jewelry Product Model Numbers, Pictures, Descriptions and Specifications
- Table 169. Titan Recent Developments
- Table 170. Stuller Company Information
- Table 171. Stuller Description and Major Businesses
- Table 172. Stuller Gems and Jewelry Sales (K Units), Revenue (US$ Million), Price (USD/Unit) and Gross Margin (2019-2024)
- Table 173. Stuller Gems and Jewelry Product Model Numbers, Pictures, Descriptions and Specifications
- Table 174. Gitanjali Gems Company Information
- Table 175. Gitanjali Gems Description and Major Businesses
- Table 176. Gitanjali Gems Gems and Jewelry Sales (K Units), Revenue (US$ Million), Price (USD/Unit) and Gross Margin (2019-2024)
- Table 177. Gitanjali Gems Gems and Jewelry Product Model Numbers, Pictures, Descriptions and Specifications
- Table 178. Mingr Company Information
- Table 179. Mingr Description and Major Businesses
- Table 180. Mingr Gems and Jewelry Sales (K Units), Revenue (US$ Million), Price (USD/Unit) and Gross Margin (2019-2024)
- Table 181. Mingr Gems and Jewelry Product Model Numbers, Pictures, Descriptions and Specifications
- Table 182. Mingr Recent Developments
- Table 183. Graff Diamond Company Information
- Table 184. Graff Diamond Description and Major Businesses
- Table 185. Graff Diamond Gems and Jewelry Sales (K Units), Revenue (US$ Million), Price (USD/Unit) and Gross Margin (2019-2024)
- Table 186. Graff Diamond Gems and Jewelry Product Model Numbers, Pictures, Descriptions and Specifications
- Table 187. Caibai Jewelry Company Information
- Table 188. Caibai Jewelry Description and Major Businesses
- Table 189. Caibai Jewelry Gems and Jewelry Sales (K Units), Revenue (US$ Million), Price (USD/Unit) and Gross Margin (2019-2024)
- Table 190. Caibai Jewelry Gems and Jewelry Product Model Numbers, Pictures, Descriptions and Specifications
- Table 191. Damas International Company Information
- Table 192. Damas International Description and Major Businesses
- Table 193. Damas International Gems and Jewelry Sales (K Units), Revenue (US$ Million), Price (USD/Unit) and Gross Margin (2019-2024)
- Table 194. Damas International Gems and Jewelry Product Model Numbers, Pictures, Descriptions and Specifications
- Table 195. Cuihua Gold Company Information
- Table 196. Cuihua Gold Description and Major Businesses
- Table 197. Cuihua Gold Gems and Jewelry Sales (K Units), Revenue (US$ Million), Price (USD/Unit) and Gross Margin (2019-2024)
- Table 198. Cuihua Gold Gems and Jewelry Product Model Numbers, Pictures, Descriptions and Specifications
- Table 199. Cuihua Gold Recent Developments
- Table 200. Tse Sui Luen Company Information
- Table 201. Tse Sui Luen Description and Major Businesses
- Table 202. Tse Sui Luen Gems and Jewelry Sales (K Units), Revenue (US$ Million), Price (USD/Unit) and Gross Margin (2019-2024)
- Table 203. Tse Sui Luen Gems and Jewelry Product Model Numbers, Pictures, Descriptions and Specifications
- Table 204. CHJ Company Information
- Table 205. CHJ Description and Major Businesses
- Table 206. CHJ Gems and Jewelry Sales (K Units), Revenue (US$ Million), Price (USD/Unit) and Gross Margin (2019-2024)
- Table 207. CHJ Gems and Jewelry Product Model Numbers, Pictures, Descriptions and Specifications
- Table 208. Asian Star Company Company Information
- Table 209. Asian Star Company Description and Major Businesses
- Table 210. Asian Star Company Gems and Jewelry Sales (K Units), Revenue (US$ Million), Price (USD/Unit) and Gross Margin (2019-2024)
- Table 211. Asian Star Company Gems and Jewelry Product Model Numbers, Pictures, Descriptions and Specifications
- Table 212. TBZ Shrikant Zaveri Company Information
- Table 213. TBZ Shrikant Zaveri Description and Major Businesses
- Table 214. TBZ Shrikant Zaveri Gems and Jewelry Sales (K Units), Revenue (US$ Million), Price (USD/Unit) and Gross Margin (2019-2024)
- Table 215. TBZ Shrikant Zaveri Gems and Jewelry Product Model Numbers, Pictures, Descriptions and Specifications
- Table 216. Thangamayil Company Information
- Table 217. Thangamayil Description and Major Businesses
- Table 218. Thangamayil Gems and Jewelry Sales (K Units), Revenue (US$ Million), Price (USD/Unit) and Gross Margin (2019-2024)
- Table 219. Thangamayil Gems and Jewelry Product Model Numbers, Pictures, Descriptions and Specifications
- Table 220. Top Gold-Producing Companies
- Table 221. Platinum Major Suppliers
- Table 222. Rough Diamond Major Suppliers
- Table 223. Gems and Jewelry Distributors List
- Table 224. Gems and Jewelry Market Trends
- Table 225. Gems and Jewelry Market Drivers
- Table 226. Gems and Jewelry Market Challenges
- Table 227. Gems and Jewelry Market Restraints
- Table 228. Research Programs/Design for This Report
- Table 229. Key Data Information from Secondary Sources
- Table 230. Key Data Information from Primary Sources
List of Figures
- Figure 1. Gems and Jewelry Product Picture
- Figure 2. Global Gems and Jewelry Market Size Growth Rate by Type, 2019 VS 2023 VS 2030 (US$ Million)
- Figure 3. Global Gems and Jewelry Market Share by Type: 2023 & 2030
- Figure 4. Diamond Jewelry Product Picture
- Figure 5. Platinum Jewelry Product Picture
- Figure 6. Global Gems and Jewelry Market Size Growth Rate by Channel, 2019 VS 2023 VS 2030 (US$ Million)
- Figure 7. Global Gems and Jewelry Market Share by Channel: 2023 & 2030
- Figure 8. Offline Sales
- Figure 9. Online Sales
- Figure 10. Gems and Jewelry Report Years Considered
- Figure 11. Global Gems and Jewelry Revenue, (US$ Million), 2019 VS 2024 VS 2030
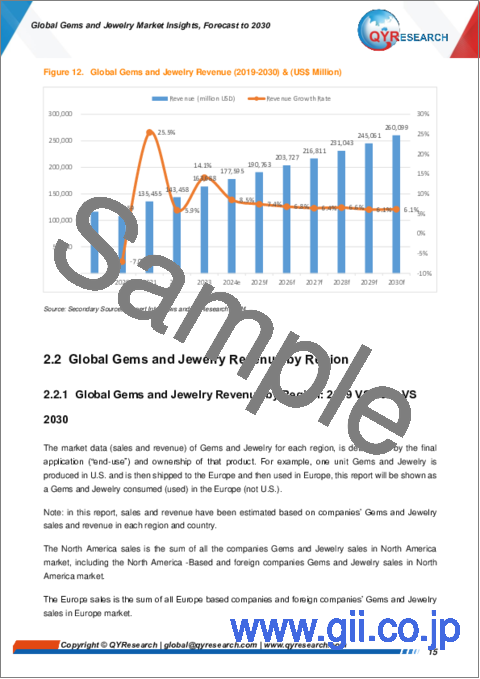
- Figure 12. Global Gems and Jewelry Revenue (2019-2030) & (US$ Million)
- Figure 13. Global Gems and Jewelry Revenue (CAGR) by Region: 2019 VS 2023 VS 2030 (US$ Million)
- Figure 14. Global Gems and Jewelry Revenue Market Share by Region in Percentage: 2023 Versus 2030
- Figure 15. Global Gems and Jewelry Revenue Market Share by Region (2019-2030)
- Figure 16. Global Gems and Jewelry Sales (2019-2030) & (K Units)
- Figure 17. Global Gems and Jewelry Sales (CAGR) by Region: 2019 VS 2023 VS 2030 (K Units)
- Figure 18. Global Gems and Jewelry Sales Market Share by Region (2019-2030)
- Figure 19. US & Canada Gems and Jewelry Sales YoY (2019-2030) & (K Units)
- Figure 20. US & Canada Gems and Jewelry Revenue YoY (2019-2030) & (US$ Million)
- Figure 21. Europe Gems and Jewelry Sales YoY (2019-2030) & (K Units)
- Figure 22. Europe Gems and Jewelry Revenue YoY (2019-2030) & (US$ Million)
- Figure 23. China Gems and Jewelry Sales YoY (2019-2030) & (K Units)
- Figure 24. China Gems and Jewelry Revenue YoY (2019-2030) & (US$ Million)
- Figure 25. Asia (excluding China) Gems and Jewelry Sales YoY (2019-2030) & (K Units)
- Figure 26. Asia (excluding China) Gems and Jewelry Revenue YoY (2019-2030) & (US$ Million)
- Figure 27. Middle East, Africa and Latin America Gems and Jewelry Sales YoY (2019-2030) & (K Units)
- Figure 28. Middle East, Africa and Latin America Gems and Jewelry Revenue YoY (2019-2030) & (US$ Million)
- Figure 29. The Gems and Jewelry Market Share of Top 5 Largest Manufacturers Around the World in 2023
- Figure 30. The Top 5 Largest Manufacturers of Gems and Jewelry in the World: Market Share by Gems and Jewelry Revenue in 2023
- Figure 31. Global Gems and Jewelry Sales Market Share by Type (2019-2030)
- Figure 32. Global Gems and Jewelry Revenue Market Share by Type (2019-2030)
- Figure 33. Global Gems and Jewelry Sales Market Share by Channel (2019-2030)
- Figure 34. Global Gems and Jewelry Revenue Market Share by Channel (2019-2030)
- Figure 35. US & Canada Gems and Jewelry Sales Market Share by Type (2019-2030)
- Figure 36. US & Canada Gems and Jewelry Revenue Market Share by Type (2019-2030)
- Figure 37. US & Canada Gems and Jewelry Sales Market Share by Channel (2019-2030)
- Figure 38. US & Canada Gems and Jewelry Revenue Market Share by Channel (2019-2030)
- Figure 39. US & Canada Gems and Jewelry Revenue Share by Country (2019-2030)
- Figure 40. US & Canada Gems and Jewelry Sales Share by Country (2019-2030)
- Figure 41. US Gems and Jewelry Revenue (2019-2030) & (US$ Million)
- Figure 42. Canada Gems and Jewelry Revenue (2019-2030) & (US$ Million)
- Figure 43. Europe Gems and Jewelry Sales Market Share by Type (2019-2030)
- Figure 44. Europe Gems and Jewelry Revenue Market Share by Type (2019-2030)
- Figure 45. Europe Gems and Jewelry Sales Market Share by Channel (2019-2030)
- Figure 46. Europe Gems and Jewelry Revenue Market Share by Channel (2019-2030)
- Figure 47. Europe Gems and Jewelry Revenue Share by Country (2019-2030)
- Figure 48. Europe Gems and Jewelry Sales Share by Country (2019-2030)
- Figure 49. Germany Gems and Jewelry Revenue (2019-2030) & (US$ Million)
- Figure 50. France Gems and Jewelry Revenue (2019-2030) & (US$ Million)
- Figure 51. U.K. Gems and Jewelry Revenue (2019-2030) & (US$ Million)
- Figure 52. Italy Gems and Jewelry Revenue (2019-2030) & (US$ Million)
- Figure 53. Russia Gems and Jewelry Revenue (2019-2030) & (US$ Million)
- Figure 54. China Gems and Jewelry Sales Market Share by Type (2019-2030)
- Figure 55. China Gems and Jewelry Revenue Market Share by Type (2019-2030)
- Figure 56. China Gems and Jewelry Sales Market Share by Channel (2019-2030)
- Figure 57. China Gems and Jewelry Revenue Market Share by Channel (2019-2030)
- Figure 58. Asia Pacific Gems and Jewelry Sales Market Share by Type (2019-2030)
- Figure 59. Asia Pacific Gems and Jewelry Revenue Market Share by Type (2019-2030)
- Figure 60. Asia Pacific Gems and Jewelry Sales Market Share by Channel (2019-2030)
- Figure 61. Asia Pacific Gems and Jewelry Revenue Market Share by Channel (2019-2030)
- Figure 62. Asia Pacific Gems and Jewelry Revenue Share by Region (2019-2030)
- Figure 63. Asia Pacific Gems and Jewelry Sales Share by Region (2019-2030)
- Figure 64. Japan Gems and Jewelry Revenue (2019-2030) & (US$ Million)
- Figure 65. South Korea Gems and Jewelry Revenue (2019-2030) & (US$ Million)
- Figure 66. Southeast Asia Gems and Jewelry Revenue (2019-2030) & (US$ Million)
- Figure 67. India Gems and Jewelry Revenue (2019-2030) & (US$ Million)
- Figure 68. Middle East, Africa and Latin America Gems and Jewelry Sales Market Share by Type (2019-2030)
- Figure 69. Middle East, Africa and Latin America Gems and Jewelry Revenue Market Share by Type (2019-2030)
- Figure 70. Middle East, Africa and Latin America Gems and Jewelry Sales Market Share by Channel (2019-2030)
- Figure 71. Middle East, Africa and Latin America Gems and Jewelry Revenue Market Share by Channel (2019-2030)
- Figure 72. Middle East, Africa and Latin America Gems and Jewelry Revenue Share by Country (2019-2030)
- Figure 73. Middle East, Africa and Latin America Gems and Jewelry Sales Share by Country (2019-2030)
- Figure 74. Brazil Gems and Jewelry Revenue (2019-2030) & (US$ Million)
- Figure 75. Mexico Gems and Jewelry Revenue (2019-2030) & (US$ Million)
- Figure 76. Turkey Gems and Jewelry Revenue (2019-2030) & (US$ Million)
- Figure 77. GCC Countries Gems and Jewelry Revenue (2019-2030) & (US$ Million)
- Figure 78. Gems and Jewelry Value Chain
- Figure 79. World Gold Production (MT)
- Figure 80. Key Raw Materials Price - LBMA Gold Price (USD/Oz)
- Figure 81. Annual Production of Rough-diamond (Millionof Carals)
- Figure 82. Prices Index for IDEX Diamond
- Figure 83. Gems and Jewelry Production Process
- Figure 84. Bottom-up and Top-down Approaches for This Report
- Figure 85. Data Triangulation
- Figure 86. Key Executives Interviewed
The global Gems and Jewelry market is projected to grow from US$ 177.6 Billion in 2024 to US$260.1 Billion by 2030, at a Compound Annual Growth Rate (CAGR) of 6.6% during the forecast period.
The global key manufacturers of Gems and Jewelry include Chow Tai Fook, Richemont, Signet Jewellers, Swatch Group, Rajesh Exports, Lao Feng Xiang, Kering, Malabar Gold and Diamonds, LVMH, Daniel Swarovski, etc. In 2023, the global top five players had a share approximately 36% in terms of revenue.
Report Includes
This report presents an overview of global market for Gems and Jewelry, sales, revenue and price. Analyses of the global market trends, with historic market revenue/sales data for 2019 - 2023, estimates for 2024, and projections of CAGR through 2030.
This report researches the key producers of Gems and Jewelry, also provides the sales of main regions and countries. Highlights of the upcoming market potential for Gems and Jewelry, and key regions/countries of focus to forecast this market into various segments and sub-segments. Country specific data and market value analysis for the U.S., Canada, Mexico, Brazil, China, Japan, South Korea, Southeast Asia, India, Germany, the U.K., Italy, Middle East, Africa, and Other Countries.
This report focuses on the Gems and Jewelry sales, revenue, market share and industry ranking of main manufacturers, data from 2019 to 2024. Identification of the major stakeholders in the global Gems and Jewelry market, and analysis of their competitive landscape and market positioning based on recent developments and segmental revenues. This report will help stakeholders to understand the competitive landscape and gain more insights and position their businesses and market strategies in a better way.
This report analyzes the segments data by Type, and by Channel, sales, revenue, and price, from 2019 to 2030. Evaluation and forecast the market size for Gems and Jewelry sales, projected growth trends, production technology, application and end-user industry.
Descriptive company profiles of the major global players, including Chow Tai Fook, Richemont, Signet Jewellers, Swatch Group, Rajesh Exports, Lao Feng Xiang, Kering, Malabar Gold and Diamonds, LVMH, Daniel Swarovski, etc.
Market Segmentation
By Company
- Chow Tai Fook
- Richemont
- Signet Jewellers
- Swatch Group
- Rajesh Exports
- Lao Feng Xiang
- Kering
- Malabar Gold and Diamonds
- LVMH
- Daniel Swarovski
- De Beers
- Chow Sang Sang
- Luk Fook
- Pandora
- Titan
- Stuller
- Gitanjali Gems
- Mingr
- Graff Diamond
- Caibai Jewelry
- Damas International
- Cuihua Gold
- Tse Sui Luen
- CHJ
- Asian Star Company
- TBZ Shrikant Zaveri
- Thangamayil
Segment by Type
- Gold Jewelry
- Diamond Jewelry
- Platinum Jewelry
- Others
Segment by Channel
- Offline Sales
- Online Sales
Segment by Region
- US & Canada
- U.S.
- Canada
- China
- Asia Pacific (excluding China)
- Japan
- South Korea
- Southeast Asia
- India
- Rest of the APAC
- Europe
- Germany
- France
- U.K.
- Italy
- Russia
- Middle East, Africa, Latin America
- Brazil
- Mexico
- Turkey
- GCC Countries
Chapter Outline
Chapter 1: Introduces the report scope of the report, executive summary of different market segments (by Type, and by Channel, etc), including the market size of each market segment, future development potential, and so on. It offers a high-level view of the current state of the market and its likely evolution in the short to mid-term, and long term.
Chapter 2: Sales (consumption), revenue of Gems and Jewelry in global, regional level and country level. It provides a quantitative analysis of the market size and development potential of each region and its main countries and introduces the market development, future development prospects, market space, and capacity of each country in the world.
Chapter 3: Detailed analysis of Gems and Jewelry manufacturers competitive landscape, price, sales, revenue, market share and industry ranking, latest development plan, merger, and acquisition information, etc.
Chapter 4: Provides the analysis of various market segments by Type, covering the sales, revenue, average price, and development potential of each market segment, to help readers find the blue ocean market in different market segments.
Chapter 5: Provides the analysis of various market segments by Channel, covering the sales, revenue, average price, and development potential of each market segment, to help readers find the blue ocean market in different downstream markets.
Chapter 6: North America (US & Canada) by Type, by Channel and by country, sales, and revenue for each segment.
Chapter 7: Europe by Type, by Channel and by country, sales, and revenue for each segment.
Chapter 8: China by Type, and by Channel, sales, and revenue for each segment.
Chapter 9: Asia (excluding China) by Type, by Channel and by region, sales, and revenue for each segment.
Chapter 10: Middle East, Africa, and Latin America by Type, by Channel and by country, sales, and revenue for each segment.
Chapter 11: Provides profiles of key manufacturers, introducing the basic situation of the main companies in the market in detail, including product descriptions and specifications, Gems and Jewelry sales, revenue, price, gross margin, and recent development, etc.
Chapter 12: Analysis of industrial chain, sales channel, key raw materials, distributors and customers.
Chapter 13: Introduces the market dynamics, latest developments of the market, the driving factors and restrictive factors of the market, the challenges and risks faced by manufacturers in the industry, and the analysis of relevant policies in the industry.
Chapter 14: The main points and conclusions of the report.
Table of Contents
1 STUDY COVERAGE
- 1.1 Gems and Jewelry Product Introduction
- 1.2 Market by Type
- 1.2.1 Global Gems and Jewelry Market Size Growth Rate by Type, 2019 VS 2023 VS 2030
- 1.2.2 Gold Jewelry
- 1.2.3 Diamond Jewelry
- 1.2.4 Platinum Jewelry
- 1.2.5 Others
- 1.3 Market by Channel
- 1.3.1 Global Gems and Jewelry Market Size Growth Rate by Channel, 2019 VS 2023 VS 2030
- 1.3.2 Offline Sales
- 1.3.3 Online Sales
- 1.4 Assumptions and Limitations
- 1.5 Study Objectives
- 1.6 Years Considered
2 EXECUTIVE SUMMARY
- 2.1 Global Gems and Jewelry Revenue Estimates and Forecasts 2019-2030
- 2.2 Global Gems and Jewelry Revenue by Region
- 2.2.1 Global Gems and Jewelry Revenue by Region: 2019 VS 2023 VS 2030
- 2.2.2 Global Gems and Jewelry Revenue by Region (2019-2024)
- 2.2.3 Global Gems and Jewelry Revenue by Region (2025-2030)
- 2.2.4 Global Gems and Jewelry Revenue Market Share by Region (2019-2030)
- 2.3 Global Gems and Jewelry Sales Estimates and Forecasts 2019-2030
- 2.4 Global Gems and Jewelry Sales by Region
- 2.4.1 Global Gems and Jewelry Sales by Region: 2019 VS 2023 VS 2030
- 2.4.2 Global Gems and Jewelry Sales by Region (2019-2024)
- 2.4.3 Global Gems and Jewelry Sales by Region (2025-2030)
- 2.4.4 Global Gems and Jewelry Sales Market Share by Region (2019-2030)
- 2.5 US & Canada
- 2.6 Europe
- 2.7 China
- 2.8 Asia (excluding China)
- 2.9 Middle East, Africa and Latin America
3 COMPETITION BY MANUFACTURERS
- 3.1 Global Gems and Jewelry Sales by Manufacturers
- 3.1.1 Global Gems and Jewelry Sales by Manufacturers (2019-2024)
- 3.1.2 Global Gems and Jewelry Sales Market Share by Manufacturers (2019-2024)
- 3.1.3 Global Top 5 Largest Manufacturers of Gems and Jewelry in 2023
- 3.2 Global Gems and Jewelry Revenue by Manufacturers
- 3.2.1 Global Gems and Jewelry Revenue by Manufacturers (2019-2024)
- 3.2.2 Global Gems and Jewelry Revenue Market Share by Manufacturers (2019-2024)
- 3.2.3 Global Top 5 Companies by Gems and Jewelry Revenue in 2023
- 3.3 Global Key Players of Gems and Jewelry, Industry Ranking, 2023
- 3.4 Global Gems and Jewelry Sales Price by Manufacturers (2019-2024)
- 3.5 Analysis of Competitive Landscape
- 3.6 Global Key Manufacturers of Gems and Jewelry, Sales Distribution and Headquarters
- 3.7 Mergers & Acquisitions, Expansion Plans
4 MARKET SIZE BY TYPE
- 4.1 Global Gems and Jewelry Sales by Type
- 4.1.1 Global Gems and Jewelry Historical Sales by Type (2019-2024)
- 4.1.2 Global Gems and Jewelry Forecasted Sales by Type (2025-2030)
- 4.1.3 Global Gems and Jewelry Sales Market Share by Type (2019-2030)
- 4.2 Global Gems and Jewelry Revenue by Type
- 4.2.1 Global Gems and Jewelry Historical Revenue by Type (2019-2024)
- 4.2.2 Global Gems and Jewelry Forecasted Revenue by Type (2025-2030)
- 4.2.3 Global Gems and Jewelry Revenue Market Share by Type (2019-2030)
- 4.3 Global Gems and Jewelry Price by Type
- 4.3.1 Global Gems and Jewelry Price by Type (2019-2024)
- 4.3.2 Global Gems and Jewelry Price Forecast by Type (2025-2030)
5 MARKET SIZE BY CHANNEL
- 5.1 Global Gems and Jewelry Sales by Channel
- 5.1.1 Global Gems and Jewelry Historical Sales by Channel (2019-2024)
- 5.1.2 Global Gems and Jewelry Forecasted Sales by Channel (2025-2030)
- 5.1.3 Global Gems and Jewelry Sales Market Share by Channel (2019-2030)
- 5.2 Global Gems and Jewelry Revenue by Channel
- 5.2.1 Global Gems and Jewelry Historical Revenue by Channel (2019-2024)
- 5.2.2 Global Gems and Jewelry Forecasted Revenue by Channel (2025-2030)
- 5.2.3 Global Gems and Jewelry Revenue Market Share by Channel (2019-2030)
- 5.3 Global Gems and Jewelry Price by Channel
- 5.3.1 Global Gems and Jewelry Price by Channel (2019-2024)
- 5.3.2 Global Gems and Jewelry Price Forecast by Channel (2025-2030)
6 US & CANADA
- 6.1 US & Canada Gems and Jewelry Market Size by Type
- 6.1.1 US & Canada Gems and Jewelry Sales by Type (2019-2030)
- 6.1.2 US & Canada Gems and Jewelry Revenue by Type (2019-2030)
- 6.2 US & Canada Gems and Jewelry Market Size by Channel
- 6.2.1 US & Canada Gems and Jewelry Sales by Channel (2019-2030)
- 6.2.2 US & Canada Gems and Jewelry Revenue by Channel (2019-2030)
- 6.3 US & Canada Gems and Jewelry Market Size by Country
- 6.3.1 US & Canada Gems and Jewelry Revenue by Country (2019-2030)
- 6.3.2 US & Canada Gems and Jewelry Sales by Country (2019-2030)
- 6.3.3 US
- 6.3.4 Canada
7 EUROPE
- 7.1 Europe Gems and Jewelry Market Size by Type
- 7.1.1 Europe Gems and Jewelry Sales by Type (2019-2030)
- 7.1.2 Europe Gems and Jewelry Revenue by Type (2019-2030)
- 7.2 Europe Gems and Jewelry Market Size by Channel
- 7.2.1 Europe Gems and Jewelry Sales by Channel (2019-2030)
- 7.2.2 Europe Gems and Jewelry Revenue by Channel (2019-2030)
- 7.3 Europe Gems and Jewelry Market Size by Country
- 7.3.1 Europe Gems and Jewelry Revenue by Country (2019-2030)
- 7.3.2 Europe Gems and Jewelry Sales by Country (2019-2030)
- 7.3.3 Germany
- 7.3.4 France
- 7.3.5 U.K.
- 7.3.6 Italy
- 7.3.7 Russia
8 CHINA
- 8.1 China Gems and Jewelry Market Size by Type
- 8.1.1 China Gems and Jewelry Sales by Type (2019-2030)
- 8.1.2 China Gems and Jewelry Revenue by Type (2019-2030)
- 8.2 China Gems and Jewelry Market Size by Channel
- 8.2.1 China Gems and Jewelry Sales by Channel (2019-2030)
- 8.2.2 China Gems and Jewelry Revenue by Channel (2019-2030)
9 ASIA PACIFIC (EXCLUDING CHINA)
- 9.1 Asia Pacific Gems and Jewelry Market Size by Type
- 9.1.1 Asia Pacific Gems and Jewelry Sales by Type (2019-2030)
- 9.1.2 Asia Pacific Gems and Jewelry Revenue by Type (2019-2030)
- 9.2 Asia Pacific Gems and Jewelry Market Size by Channel
- 9.2.1 Asia Pacific Gems and Jewelry Sales by Channel (2019-2030)
- 9.2.2 Asia Pacific Gems and Jewelry Revenue by Channel (2019-2030)
- 9.3 Asia Pacific Gems and Jewelry Market Size by Region
- 9.3.1 Asia Pacific Gems and Jewelry Revenue by Region (2019-2030)
- 9.3.2 Asia Pacific Gems and Jewelry Sales by Region (2019-2030)
- 9.3.3 Japan
- 9.3.4 South Korea
- 9.3.5 Southeast Asia
- 9.3.6 India
10 MIDDLE EAST, AFRICA AND LATIN AMERICA
- 10.1 Middle East, Africa and Latin America Gems and Jewelry Market Size by Type
- 10.1.1 Middle East, Africa and Latin America Gems and Jewelry Sales by Type (2019-2030)
- 10.1.2 Middle East, Africa and Latin America Gems and Jewelry Revenue by Type (2019-2030)
- 10.2 Middle East, Africa and Latin America Gems and Jewelry Market Size by Channel
- 10.2.1 Middle East, Africa and Latin America Gems and Jewelry Sales by Channel (2019-2030)
- 10.2.2 Middle East, Africa and Latin America Gems and Jewelry Revenue by Channel (2019-2030)
- 10.3 Middle East, Africa and Latin America Gems and Jewelry Market Size by Country
- 10.3.1 Middle East, Africa and Latin America Gems and Jewelry Revenue by Country (2019-2030)
- 10.3.2 Middle East, Africa and Latin America Gems and Jewelry Sales by Country (2019-2030)
- 10.3.3 Brazil
- 10.3.4 Mexico
- 10.3.5 Turkey
- 10.3.6 GCC Countries
11 CORPORATE PROFILE
- 11.1 Chow Tai Fook
- 11.1.1 Chow Tai Fook Company Information
- 11.1.2 Chow Tai Fook Overview
- 11.1.3 Chow Tai Fook Gems and Jewelry Sales, Price, Revenue and Gross Margin (2019-2024)
- 11.1.4 Chow Tai Fook Gems and Jewelry Product Model Numbers, Pictures, Descriptions and Specifications
- 11.1.5 Chow Tai Fook Recent Developments
- 11.2 Richemont
- 11.2.1 Richemont Company Information
- 11.2.2 Richemont Overview
- 11.2.3 Richemont Gems and Jewelry Sales, Price, Revenue and Gross Margin (2019-2024)
- 11.2.4 Richemont Gems and Jewelry Product Model Numbers, Pictures, Descriptions and Specifications
- 11.2.5 Richemont Recent Developments
- 11.3 Signet Jewellers
- 11.3.1 Signet Jewellers Company Information
- 11.3.2 Signet Jewellers Overview
- 11.3.3 Signet Jewellers Gems and Jewelry Sales, Price, Revenue and Gross Margin (2019-2024)
- 11.3.4 Signet Jewellers Gems and Jewelry Product Model Numbers, Pictures, Descriptions and Specifications
- 11.3.5 Signet Jewellers Recent Developments
- 11.4 Swatch Group
- 11.4.1 Swatch Group Company Information
- 11.4.2 Swatch Group Overview
- 11.4.3 Swatch Group Gems and Jewelry Sales, Price, Revenue and Gross Margin (2019-2024)
- 11.4.4 Swatch Group Gems and Jewelry Product Model Numbers, Pictures, Descriptions and Specifications
- 11.5 Rajesh Exports
- 11.5.1 Rajesh Exports Company Information
- 11.5.2 Rajesh Exports Overview
- 11.5.3 Rajesh Exports Gems and Jewelry Sales, Price, Revenue and Gross Margin (2019-2024)
- 11.5.4 Rajesh Exports Gems and Jewelry Product Model Numbers, Pictures, Descriptions and Specifications
- 11.6 Lao Feng Xiang
- 11.6.1 Lao Feng Xiang Company Information
- 11.6.2 Lao Feng Xiang Overview
- 11.6.3 Lao Feng Xiang Gems and Jewelry Sales, Price, Revenue and Gross Margin (2019-2024)
- 11.6.4 Lao Feng Xiang Gems and Jewelry Product Model Numbers, Pictures, Descriptions and Specifications
- 11.7 Kering
- 11.7.1 Kering Company Information
- 11.7.2 Kering Overview
- 11.7.3 Kering Gems and Jewelry Sales, Price, Revenue and Gross Margin (2019-2024)
- 11.7.4 Kering Gems and Jewelry Product Model Numbers, Pictures, Descriptions and Specifications
- 11.8 Malabar Gold and Diamonds
- 11.8.1 Malabar Gold and Diamonds Company Information
- 11.8.2 Malabar Gold and Diamonds Overview
- 11.8.3 Malabar Gold and Diamonds Gems and Jewelry Sales, Price, Revenue and Gross Margin (2019-2024)
- 11.8.4 Malabar Gold and Diamonds Gems and Jewelry Product Model Numbers, Pictures, Descriptions and Specifications
- 11.8.5 Malabar Gold and Diamonds Recent Developments
- 11.9 LVMH
- 11.9.1 LVMH Company Information
- 11.9.2 LVMH Overview
- 11.9.3 LVMH Gems and Jewelry Sales, Price, Revenue and Gross Margin (2019-2024)
- 11.9.4 LVMH Gems and Jewelry Product Model Numbers, Pictures, Descriptions and Specifications
- 11.9.5 LVMH Recent Developments
- 11.10 Daniel Swarovski
- 11.10.1 Daniel Swarovski Company Information
- 11.10.2 Daniel Swarovski Overview
- 11.10.3 Daniel Swarovski Gems and Jewelry Sales, Price, Revenue and Gross Margin (2019-2024)
- 11.10.4 Daniel Swarovski Gems and Jewelry Product Model Numbers, Pictures, Descriptions and Specifications
- 11.11 De Beers
- 11.11.1 De Beers Company Information
- 11.11.2 De Beers Overview
- 11.11.3 De Beers Gems and Jewelry Sales, Price, Revenue and Gross Margin (2019-2024)
- 11.11.4 De Beers Gems and Jewelry Product Model Numbers, Pictures, Descriptions and Specifications
- 11.11.5 De Beers Recent Developments
- 11.12 Chow Sang Sang
- 11.12.1 Chow Sang Sang Company Information
- 11.12.2 Chow Sang Sang Overview
- 11.12.3 Chow Sang Sang Gems and Jewelry Sales, Price, Revenue and Gross Margin (2019-2024)
- 11.12.4 Chow Sang Sang Gems and Jewelry Product Model Numbers, Pictures, Descriptions and Specifications
- 11.13 Luk Fook
- 11.13.1 Luk Fook Company Information
- 11.13.2 Luk Fook Overview
- 11.13.3 Luk Fook Gems and Jewelry Sales, Price, Revenue and Gross Margin (2019-2024)
- 11.13.4 Luk Fook Gems and Jewelry Product Model Numbers, Pictures, Descriptions and Specifications
- 11.13.5 Luk Fook Recent Developments
- 11.14 Pandora
- 11.14.1 Pandora Company Information
- 11.14.2 Pandora Overview
- 11.14.3 Pandora Gems and Jewelry Sales, Price, Revenue and Gross Margin (2019-2024)
- 11.14.4 Pandora Gems and Jewelry Product Model Numbers, Pictures, Descriptions and Specifications
- 11.14.5 Pandora Recent Developments
- 11.15 Titan
- 11.15.1 Titan Company Information
- 11.15.2 Titan Overview
- 11.15.3 Titan Gems and Jewelry Sales, Price, Revenue and Gross Margin (2019-2024)
- 11.15.4 Titan Gems and Jewelry Product Model Numbers, Pictures, Descriptions and Specifications
- 11.15.5 Titan Recent Developments
- 11.16 Stuller
- 11.16.1 Stuller Company Information
- 11.16.2 Stuller Overview
- 11.16.3 Stuller Gems and Jewelry Sales, Price, Revenue and Gross Margin (2019-2024)
- 11.16.4 Stuller Gems and Jewelry Product Model Numbers, Pictures, Descriptions and Specifications
- 11.17 Gitanjali Gems
- 11.17.1 Gitanjali Gems Company Information
- 11.17.2 Gitanjali Gems Overview
- 11.17.3 Gitanjali Gems Gems and Jewelry Sales, Price, Revenue and Gross Margin (2019-2024)
- 11.17.4 Gitanjali Gems Gems and Jewelry Product Model Numbers, Pictures, Descriptions and Specifications
- 11.18 Mingr
- 11.18.1 Mingr Company Information
- 11.18.2 Mingr Overview
- 11.18.3 Mingr Gems and Jewelry Sales, Price, Revenue and Gross Margin (2019-2024)
- 11.18.4 Mingr Gems and Jewelry Product Model Numbers, Pictures, Descriptions and Specifications
- 11.18.5 Mingr Recent Developments
- 11.19 Graff Diamond
- 11.19.1 Graff Diamond Company Information
- 11.19.2 Graff Diamond Overview
- 11.19.3 Graff Diamond Gems and Jewelry Sales, Price, Revenue and Gross Margin (2019-2024)
- 11.19.4 Graff Diamond Gems and Jewelry Product Model Numbers, Pictures, Descriptions and Specifications
- 11.20 Caibai Jewelry
- 11.20.1 Caibai Jewelry Company Information
- 11.20.2 Caibai Jewelry Overview
- 11.20.3 Caibai Jewelry Gems and Jewelry Sales, Price, Revenue and Gross Margin (2019-2024)
- 11.20.4 Caibai Jewelry Gems and Jewelry Product Model Numbers, Pictures, Descriptions and Specifications
- 11.21 Damas International
- 11.21.1 Damas International Company Information
- 11.21.2 Damas International Overview
- 11.21.3 Damas International Gems and Jewelry Sales, Price, Revenue and Gross Margin (2019-2024)
- 11.21.4 Damas International Gems and Jewelry Product Model Numbers, Pictures, Descriptions and Specifications
- 11.22 Cuihua Gold
- 11.22.1 Cuihua Gold Company Information
- 11.22.2 Cuihua Gold Overview
- 11.22.3 Cuihua Gold Gems and Jewelry Sales, Price, Revenue and Gross Margin (2019-2024)
- 11.22.4 Cuihua Gold Gems and Jewelry Product Model Numbers, Pictures, Descriptions and Specifications
- 11.22.5 Cuihua Gold Recent Developments
- 11.23 Tse Sui Luen
- 11.23.1 Tse Sui Luen Company Information
- 11.23.2 Tse Sui Luen Overview
- 11.23.3 Tse Sui Luen Gems and Jewelry Sales, Price, Revenue and Gross Margin (2019-2024)
- 11.23.4 Tse Sui Luen Gems and Jewelry Product Model Numbers, Pictures, Descriptions and Specifications
- 11.24 CHJ
- 11.24.1 CHJ Company Information
- 11.24.2 CHJ Overview
- 11.24.3 CHJ Gems and Jewelry Sales, Price, Revenue and Gross Margin (2019-2024)
- 11.24.4 CHJ Gems and Jewelry Product Model Numbers, Pictures, Descriptions and Specifications
- 11.25 Asian Star Company
- 11.25.1 Asian Star Company Company Information
- 11.25.2 Asian Star Company Overview
- 11.25.3 Asian Star Company Gems and Jewelry Sales, Price, Revenue and Gross Margin (2019-2024)
- 11.25.4 Asian Star Company Gems and Jewelry Product Model Numbers, Pictures, Descriptions and Specifications
- 11.26 TBZ Shrikant Zaveri
- 11.26.1 TBZ Shrikant Zaveri Company Information
- 11.26.2 TBZ Shrikant Zaveri Overview
- 11.26.3 TBZ Shrikant Zaveri Gems and Jewelry Sales, Price, Revenue and Gross Margin (2019-2024)
- 11.26.4 TBZ Shrikant Zaveri Gems and Jewelry Product Model Numbers, Pictures, Descriptions and Specifications
- 11.27 Thangamayil
- 11.27.1 Thangamayil Company Information
- 11.27.2 Thangamayil Overview
- 11.27.3 Thangamayil Gems and Jewelry Sales, Price, Revenue and Gross Margin (2019-2024)
- 11.27.4 Thangamayil Gems and Jewelry Product Model Numbers, Pictures, Descriptions and Specifications
12 INDUSTRY CHAIN AND SALES CHANNELS ANALYSIS
- 12.1 Gems and Jewelry Industry Chain Analysis
- 12.2 Gems and Jewelry Key Raw Materials
- 12.2.1 Gold
- 12.2.2 Platinum
- 12.2.3 Diamond
- 12.3 Gems and Jewelry Production Mode & Process
- 12.4 Gems and Jewelry Distributors
13 GEMS AND JEWELRY MARKET DYNAMICS
- 13.1.1 Gems and Jewelry Industry Trends
- 13.1.2 Gems and Jewelry Market Drivers
- 13.1.3 Gems and Jewelry Market Challenges
- 13.1.4 Gems and Jewelry Market Restraints
14 KEY FINDINGS IN THE GLOBAL GEMS AND JEWELRY STUDY
15 APPENDIX
- 15.1 Research Methodology
- 15.1.1 Methodology/Research Approach
- 15.1.2 Data Source
- 15.2 Author Details
- 15.3 Disclaimer

