|
|
市場調査レポート
商品コード
1370671
パンミックスの世界市場の考察、予測(~2029年)Global Bread Mixes Market Insights, Forecast to 2029 |
||||||
|
|
|||||||
カスタマイズ可能
適宜更新あり
|
|||||||


| パンミックスの世界市場の考察、予測(~2029年) |
|
出版日: 2023年10月30日
発行: QYResearch
ページ情報: 英文 173 Pages
納期: 2~3営業日
|

- 全表示
- 概要
- 図表
- 目次
世界のパンミックスの市場規模は、2022年の28億4,493万米ドルから2029年までに38億3,833万米ドルに達し、予測期間(2023年~2029年)にCAGRで4.59%の成長が予測されています。
当レポートでは、世界のパンミックス市場について調査分析し、市場規模の実績と予測、地域とセグメントの分析、企業プロファイルなどを提供しています。
目次
第1章 研究内容
- パンミックス製品のイントロダクション
- 市場:タイプ別
- 世界のパンミックスの市場規模成長率:タイプ別(2018年・2022年・2029年)
- 白いパンミックス
- 職人のパンミックス
- 全粒粉パンミックス
- もちパンミックス
- 雑穀パンミックス
- その他
- 市場:用途別
- 世界のパンミックスの市場規模成長率:用途別(2018年・2022年・2029年)
- パン屋
- ケータリング
- 家庭
- 食品加工
- その他
- 前提条件と制限
- 調査目的
- 考慮された年数
第2章 エグゼクティブサマリー
- 世界のパンミックスの収益の推計と予測(2018年~2029年)
- 世界のパンミックスの収益:地域別
- 世界のパンミックスの収益:地域別(2018年・2022年・2029年)
- 世界のパンミックスの収益:地域別(2018年~2023年)
- 世界のパンミックスの収益:地域別(2024年~2029年)
- 世界のパンミックスの収益の市場シェア:地域別(2018年~2029年)
- 世界のパンミックスの売上の推計と予測(2018年~2029年)
- 世界のパンミックスの売上:地域別
- 世界のパンミックスの売上:地域別(2018年・2022年・2029年)
- 世界のパンミックスの売上:地域別(2018年~2023年)
- 世界のパンミックスの売上:地域別(2024年~2029年)
- 世界のパンミックスの売上の市場シェア:地域別(2018年~2029年)
- 米国・カナダ
- 欧州
- 中国
- アジア(中国を除く)
- 中東・アフリカ・ラテンアメリカ
第3章 競合:メーカー別
- 世界のパンミックスの売上:メーカー別
- 世界のパンミックスの売上:メーカー別(2018年~2023年)
- 世界のパンミックスの売上の市場シェア:メーカー別(2018年~2023年)
- 世界のパンミックスの10大・5大メーカー(2022年)
- 世界のパンミックスの収益:メーカー別
- 世界のパンミックスの収益:メーカー別(2018年~2023年)
- 世界のパンミックスの収益の市場シェア:メーカー別(2018年~2023年)
- 世界のパンミックスの収益の上位10、上位5社(2022年)
- 世界のパンミックスの主要企業、産業ランキング(2021年・2022年)
- 世界のパンミックスの販売価格:メーカー別(2018年~2023年)
- 競合情勢の分析
- メーカーの市場集中度(CR5、HHI)
- 世界のパンミックスの市場シェア:企業タイプ別(Tier 1・Tier 2・Tier 3)
- 世界のパンミックスの主要メーカー、製造拠点の分布と本社
- 世界のパンミックスの主要メーカー、業界参入日
第4章 市場規模:タイプ別
- 世界のパンミックスの売上:タイプ別
- 世界のパンミックスの売上の実績:タイプ別(2018年~2023年)
- 世界のパンミックスの売上の予測:タイプ別(2024年~2029年)
- 世界のパンミックスの売上の市場シェア:タイプ別(2018年~2029年)
- 世界のパンミックスの収益:タイプ別
- 世界のパンミックスの収益の実績:タイプ別(2018年~2023年)
- 世界のパンミックスの収益の予測:タイプ別(2024年~2029年)
- 世界のパンミックスの収益の市場シェア:タイプ別(2018年~2029年)
- 世界のパンミックスの価格:タイプ別
- 世界のパンミックスの価格:タイプ別(2018年~2023年)
- 世界のパンミックスの価格の予測:タイプ別(2024年~2029年)
第5章 市場規模:用途別
- 世界のパンミックスの売上:用途別
- 世界のパンミックスの売上の実績:用途別(2018年~2023年)
- 世界のパンミックスの売上の予測:用途別(2024年~2029年)
- 世界のパンミックスの売上の市場シェア:用途別(2018年~2029年)
- 世界のパンミックスの売上:用途別
- 世界のパンミックスの収益の実績:用途別(2018年~2023年)
- 世界のパンミックスの収益の予測:用途別(2024年~2029年)
- 世界のパンミックスの収益の市場シェア:用途別(2018年~2029年)
- 世界のパンミックスの価格:用途別
- 世界のパンミックスの価格:用途別(2018年~2023年)
- 世界のパンミックスの価格の予測:用途別(2024年~2029年)
第6章 米国・カナダ
- 米国・カナダのパンミックスの市場規模:タイプ別
- 米国・カナダのパンミックスの売上:タイプ別(2018年~2029年)
- 米国・カナダのパンミックスの収益:タイプ別(2018年~2029年)
- 米国・カナダのパンミックスの市場規模:用途別
- 米国・カナダのパンミックスの売上:用途別(2018年~2029年)
- 米国・カナダのパンミックスの収益:用途別(2018年~2029年)
- 米国・カナダのパンミックスの市場規模:国別
- 米国・カナダのパンミックスの収益:国別(2018年・2022年・2029年)
- 米国・カナダのパンミックスの収益:国別(2018年~2029年)
- 米国・カナダのパンミックスの売上:国別(2018年~2029年)
- 米国
- カナダ
第7章 欧州
- 欧州のパンミックスの市場規模:タイプ別
- 欧州のパンミックスの売上:タイプ別(2018年~2029年)
- 欧州のパンミックスの収益:タイプ別(2018年~2029年)
- 欧州のパンミックスの市場規模:用途別
- 欧州のパンミックスの売上:用途別(2018年~2029年)
- 欧州のパンミックスの収益:用途別(2018年~2029年)
- 欧州のパンミックスの市場規模:国別
- 欧州のパンミックスの収益:国別(2018年・2022年・2029年)
- 欧州のパンミックスの収益:国別(2018年~2029年)
- 欧州のパンミックスの売上:国別(2018年~2029年)
- ドイツ
- フランス
- 英国
- イタリア
- ロシア
第8章 中国
- 中国のパンミックスの市場規模:タイプ別
- 中国のパンミックスの売上:タイプ別(2018年~2029年)
- 中国のパンミックスの収益:タイプ別(2018年~2029年)
- 中国のパンミックスの市場規模:用途別
- 中国のパンミックスの売上:用途別(2018年~2029年)
- 中国のパンミックスの収益:用途別(2018年~2029年)
第9章 アジア(中国を除く)
- アジアのパンミックスの市場規模:タイプ別
- アジアのパンミックスの売上:タイプ別(2018年~2029年)
- アジアのパンミックスの収益:タイプ別(2018年~2029年)
- アジアのパンミックスの市場規模:用途別
- アジアのパンミックスの売上:用途別(2018年~2029年)
- アジアのパンミックスの収益:用途別(2018年~2029年)
- アジアのパンミックスの市場規模:地域別
- アジアのパンミックスの収益:地域別(2018年・2022年・2029年)
- アジアのパンミックスの収益:地域別(2018年~2029年)
- アジアのパンミックスの売上:地域別(2018年~2029年)
- 日本
- 韓国
- 中国台湾
- 東南アジア
- インド
- オーストラリア
第10章 中東・アフリカ・ラテンアメリカ
- 中東・アフリカ・ラテンアメリカのパンミックスの市場規模:タイプ別
- 中東・アフリカ・ラテンアメリカのパンミックスの売上:タイプ別(2018年~2029年)
- 中東・アフリカ・ラテンアメリカのパンミックスの収益:タイプ別(2018年~2029年)
- 中東・アフリカ・ラテンアメリカのパンミックスの市場規模:用途別
- 中東・アフリカ・ラテンアメリカのパンミックスの売上:用途別(2018年~2029年)
- 中東・アフリカ・ラテンアメリカのパンミックスの収益:用途別(2018年~2029年)
- 中東・アフリカ・ラテンアメリカのパンミックスの市場規模:国別
- 中東・アフリカ・ラテンアメリカのパンミックスの収益:国別(2018年・2022年・2029年)
- 中東・アフリカ・ラテンアメリカのパンミックスの収益:国別(2018年~2029年)
- 中東・アフリカ・ラテンアメリカのパンミックスの売上:国別(2018年~2029年)
- ブラジル
- メキシコ
- トルコ
- GCC諸国
第11章 企業プロファイル
- Bakels
- Puratos
- Zeelandia
- AB Mauri
- CSM
- IREKS
- Bakemark
- Krusteaz
- General Mills
- Dawn Foods
- Backaldrin
- AngelYeast
第12章 産業チェーンと販売チャネルの分析
- パンミックスの産業チェーン分析
- パンミックスの主な原材料
- 主な原材料
- 原材料の主要サプライヤー
- パンミックスの生産方式とプロセス
- パンミックスの販売とマーケティング
- パンミックスの販売チャネル
- パンミックスの販売業者
- パンミックスの顧客
第13章 パンミックスの市場力学
- パンミックス産業の動向
- パンミックス市場の促進要因
- パンミックス市場の課題
- パンミックス市場の抑制要因
第14章 世界のパンミックス研究における主な発見
第15章 付録
List of Tables
- Table 1. Global Bread Mixes Market Size Growth Rate by Type, 2018 VS 2022 VS 2029 (US$ Million)
- Table 2. Global Bread Mixes Market Size Growth Rate by Application, 2018 VS 2022 VS 2029 (US$ Million)
- Table 3. Global Bread Mixes Revenue Grow Rate (CAGR) by Region: 2018 VS 2022 VS 2029 (US$ Million)
- Table 4. Global Bread Mixes Revenue by Region (2018-2023) & (US$ Million)
- Table 5. Global Bread Mixes Revenue by Region (2024-2029) & (US$ Million)
- Table 6. Global Bread Mixes Revenue Market Share by Region (2018-2023)
- Table 7. Global Bread Mixes Revenue Market Share by Region (2024-2029)
- Table 8. Global Bread Mixes Sales Grow Rate (CAGR) by Region: 2018 VS 2022 VS 2029 (K MT)
- Table 9. Global Bread Mixes Sales by Region (2018-2023) & (K MT)
- Table 10. Global Bread Mixes Sales by Region (2024-2029) & (K MT)
- Table 11. Global Bread Mixes Sales Market Share by Region (2018-2023)
- Table 12. Global Bread Mixes Sales Market Share by Region (2024-2029)
- Table 13. Global Bread Mixes Sales by Manufacturers (2018-2023) & (K MT)
- Table 14. Global Bread Mixes Sales Share by Manufacturers (2018-2023)
- Table 15. Global Bread Mixes Revenue by Manufacturers (2018-2023) & (US$ Million)
- Table 16. Global Bread Mixes Revenue Market Share by Manufacturers (2018-2023)
- Table 17. Global Key Players of Bread Mixes, Industry Ranking, 2021 VS 2022 VS 2023 (Million USD)
- Table 18. Bread Mixes Price by Manufacturers (2018-2023) & (USD/MT)
- Table 19. Global Bread Mixes Manufacturers Market Concentration Ratio (CR5 and HHI)
- Table 20. Global Bread Mixes by Company Type (Tier 1, Tier 2, and Tier 3) & (based on the Revenue in Bread Mixes as of 2022)
- Table 21. Global Key Manufacturers of Bread Mixes, Manufacturing Base Distribution and Headquarters
- Table 22. Global Key Manufacturers of Bread Mixes, Date of Enter into This Industry
- Table 23. Global Bread Mixes Sales by Type (2018-2023) & (K MT)
- Table 24. Global Bread Mixes Sales by Type (2024-2029) & (K MT)
- Table 25. Global Bread Mixes Sales Share by Type (2018-2023)
- Table 26. Global Bread Mixes Sales Share by Type (2024-2029)
- Table 27. Global Bread Mixes Revenue by Type (2018-2023) & (US$ Million)
- Table 28. Global Bread Mixes Revenue by Type (2024-2029) & (US$ Million)
- Table 29. Global Bread Mixes Revenue Share by Type (2018-2023)
- Table 30. Global Bread Mixes Revenue Share by Type (2024-2029)
- Table 31. Bread Mixes Price by Type (2018-2023) & (USD/MT)
- Table 32. Global Bread Mixes Price Forecast by Type (2024-2029) & (USD/MT)
- Table 33. Global Bread Mixes Sales by Application (2018-2023) & (K MT)
- Table 34. Global Bread Mixes Sales by Application (2024-2029) & (K MT)
- Table 35. Global Bread Mixes Sales Share by Application (2018-2023)
- Table 36. Global Bread Mixes Sales Share by Application (2024-2029)
- Table 37. Global Bread Mixes Revenue by Application (2018-2023) & (US$ Million)
- Table 38. Global Bread Mixes Revenue by Application (2024-2029) & (US$ Million)
- Table 39. Global Bread Mixes Revenue Share by Application (2018-2023)
- Table 40. Global Bread Mixes Revenue Share by Application (2024-2029)
- Table 41. Bread Mixes Price by Application (2018-2023) & (USD/MT)
- Table 42. Global Bread Mixes Price Forecast by Application (2024-2029) & (USD/MT)
- Table 43. US & Canada Bread Mixes Sales by Type (2018-2023) & (K MT)
- Table 44. US & Canada Bread Mixes Sales by Type (2024-2029) & (K MT)
- Table 45. US & Canada Bread Mixes Revenue by Type (2018-2023) & (US$ Million)
- Table 46. US & Canada Bread Mixes Revenue by Type (2024-2029) & (US$ Million)
- Table 47. US & Canada Bread Mixes Sales by Application (2018-2023) & (K MT)
- Table 48. US & Canada Bread Mixes Sales by Application (2024-2029) & (K MT)
- Table 49. US & Canada Bread Mixes Revenue by Application (2018-2023) & (US$ Million)
- Table 50. US & Canada Bread Mixes Revenue by Application (2024-2029) & (US$ Million)
- Table 51. US & Canada Bread Mixes Revenue Grow Rate (CAGR) by Country: 2018 VS 2022 VS 2029 (US$ Million)
- Table 52. US & Canada Bread Mixes Revenue by Country (2018-2023) & (US$ Million)
- Table 53. US & Canada Bread Mixes Revenue by Country (2024-2029) & (US$ Million)
- Table 54. US & Canada Bread Mixes Sales by Country (2018-2023) & (K MT)
- Table 55. US & Canada Bread Mixes Sales by Country (2024-2029) & (K MT)
- Table 56. Europe Bread Mixes Sales by Type (2018-2023) & (K MT)
- Table 57. Europe Bread Mixes Sales by Type (2024-2029) & (K MT)
- Table 58. Europe Bread Mixes Revenue by Type (2018-2023) & (US$ Million)
- Table 59. Europe Bread Mixes Revenue by Type (2024-2029) & (US$ Million)
- Table 60. Europe Bread Mixes Sales by Application (2018-2023) & (K MT)
- Table 61. Europe Bread Mixes Sales by Application (2024-2029) & (K MT)
- Table 62. Europe Bread Mixes Revenue by Application (2018-2023) & (US$ Million)
- Table 63. Europe Bread Mixes Revenue by Application (2024-2029) & (US$ Million)
- Table 64. Europe Bread Mixes Revenue Grow Rate (CAGR) by Country: 2018 VS 2022 VS 2029 (US$ Million)
- Table 65. Europe Bread Mixes Revenue by Country (2018-2023) & (US$ Million)
- Table 66. Europe Bread Mixes Revenue by Country (2024-2029) & (US$ Million)
- Table 67. Europe Bread Mixes Sales by Country (2018-2023) & (K MT)
- Table 68. Europe Bread Mixes Sales by Country (2024-2029) & (K MT)
- Table 69. China Bread Mixes Sales by Type (2018-2023) & (K MT)
- Table 70. China Bread Mixes Sales by Type (2024-2029) & (K MT)
- Table 71. China Bread Mixes Revenue by Type (2018-2023) & (US$ Million)
- Table 72. China Bread Mixes Revenue by Type (2024-2029) & (US$ Million)
- Table 73. China Bread Mixes Sales by Application (2018-2023) & (K MT)
- Table 74. China Bread Mixes Sales by Application (2024-2029) & (K MT)
- Table 75. China Bread Mixes Revenue by Application (2018-2023) & (US$ Million)
- Table 76. China Bread Mixes Revenue by Application (2024-2029) & (US$ Million)
- Table 77. Asia Bread Mixes Sales by Type (2018-2023) & (K MT)
- Table 78. Asia Bread Mixes Sales by Type (2024-2029) & (K MT)
- Table 79. Asia Bread Mixes Revenue by Type (2018-2023) & (US$ Million)
- Table 80. Asia Bread Mixes Revenue by Type (2024-2029) & (US$ Million)
- Table 81. Asia Bread Mixes Sales by Application (2018-2023) & (K MT)
- Table 82. Asia Bread Mixes Sales by Application (2024-2029) & (K MT)
- Table 83. Asia Bread Mixes Revenue by Application (2018-2023) & (US$ Million)
- Table 84. Asia Bread Mixes Revenue by Application (2024-2029) & (US$ Million)
- Table 85. Asia Bread Mixes Revenue Grow Rate (CAGR) by Region: 2018 VS 2022 VS 2029 (US$ Million)
- Table 86. Asia Bread Mixes Revenue by Region (2018-2023) & (US$ Million)
- Table 87. Asia Bread Mixes Revenue by Region (2024-2029) & (US$ Million)
- Table 88. Asia Bread Mixes Sales by Region (2018-2023) & (K MT)
- Table 89. Asia Bread Mixes Sales by Region (2024-2029) & (K MT)
- Table 90. Middle East, Africa and Latin America Bread Mixes Sales by Type (2018-2023) & (K MT)
- Table 91. Middle East, Africa and Latin America Bread Mixes Sales by Type (2024-2029) & (K MT)
- Table 92. Middle East, Africa and Latin America Bread Mixes Revenue by Type (2018-2023) & (US$ Million)
- Table 93. Middle East, Africa and Latin America Bread Mixes Revenue by Type (2024-2029) & (US$ Million)
- Table 94. Middle East, Africa and Latin America Bread Mixes Sales by Application (2018-2023) & (K MT)
- Table 95. Middle East, Africa and Latin America Bread Mixes Sales by Application (2024-2029) & (K MT)
- Table 96. Middle East, Africa and Latin America Bread Mixes Revenue by Application (2018-2023) & (US$ Million)
- Table 97. Middle East, Africa and Latin America Bread Mixes Revenue by Application (2024-2029) & (US$ Million)
- Table 98. Middle East, Africa and Latin America Bread Mixes Revenue Grow Rate (CAGR) by Country: 2018 VS 2022 VS 2029 (US$ Million)
- Table 99. Middle East, Africa and Latin America Bread Mixes Revenue by Country (2018-2023) & (US$ Million)
- Table 100. Middle East, Africa and Latin America Bread Mixes Revenue by Country (2024-2029) & (US$ Million)
- Table 101. Middle East, Africa and Latin America Bread Mixes Sales by Country (2018-2023) & (K MT)
- Table 102. Middle East, Africa and Latin America Bread Mixes Sales by Country (2024-2029) & (K MT)
- Table 103. Bakels Company Information
- Table 104. Bakels Description and Major Businesses
- Table 105. Bakels Bread Mixes Sales (K MT), Revenue (US$ Million), Price (USD/MT) and Gross Margin (2018-2023)
- Table 106. Bakels Bread Mixes Product Model Numbers, Pictures, Descriptions and Specifications
- Table 107. Bakels Recent Developments
- Table 108. Puratos Company Information
- Table 109. Puratos Description and Major Businesses
- Table 110. Puratos Bread Mixes Sales (K MT), Revenue (US$ Million), Price (USD/MT) and Gross Margin (2018-2023)
- Table 111. Puratos Bread Mixes Product Model Numbers, Pictures, Descriptions and Specifications
- Table 112. Zeelandia Company Information
- Table 113. Zeelandia Description and Major Businesses
- Table 114. Zeelandia Bread Mixes Sales (K MT), Revenue (US$ Million), Price (USD/MT) and Gross Margin (2018-2023)
- Table 115. Zeelandia Bread Mixes Product Model Numbers, Pictures, Descriptions and Specifications
- Table 116. AB Mauri Company Information
- Table 117. AB Mauri Description and Major Businesses
- Table 118. AB Mauri Bread Mixes Sales (K MT), Revenue (US$ Million), Price (USD/MT) and Gross Margin (2018-2023)
- Table 119. AB Mauri Bread Mixes Product Model Numbers, Pictures, Descriptions and Specifications
- Table 120. CSM Company Information
- Table 121. CSM Description and Major Businesses
- Table 122. CSM Bread Mixes Sales (K MT), Revenue (US$ Million), Price (USD/MT) and Gross Margin (2018-2023)
- Table 123. IREKS Company Information
- Table 124. IREKS Description and Major Businesses
- Table 125. IREKS Bread Mixes Sales (K MT), Revenue (US$ Million), Price (USD/MT) and Gross Margin (2018-2023)
- Table 126. IREKS Bread Mixes Product Model Numbers, Pictures, Descriptions and Specifications
- Table 127. Bakemark Company Information
- Table 128. Bakemark Description and Major Businesses
- Table 129. Bakemark Bread Mixes Sales (K MT), Revenue (US$ Million), Price (USD/MT) and Gross Margin (2018-2023)
- Table 130. Bakemark Bread Mixes Product Model Numbers, Pictures, Descriptions and Specifications
- Table 131. Bakemark Recent Developments
- Table 132. Krusteaz Company Information
- Table 133. Krusteaz Description and Major Businesses
- Table 134. Krusteaz Bread Mixes Sales (K MT), Revenue (US$ Million), Price (USD/MT) and Gross Margin (2018-2023)
- Table 135. General Mills Company Information
- Table 136. General Mills Description and Major Businesses
- Table 137. General Mills Bread Mixes Sales (K MT), Revenue (US$ Million), Price (USD/MT) and Gross Margin (2018-2023)
- Table 138. Dawn Foods Company Information
- Table 139. Dawn Foods Description and Major Businesses
- Table 140. Dawn Foods Bread Mixes Sales (K MT), Revenue (US$ Million), Price (USD/MT) and Gross Margin (2018-2023)
- Table 141. Dawn Foods Bread Mixes Product Model Numbers, Pictures, Descriptions and Specifications
- Table 142. Dawn Foods Recent Developments
- Table 143. Backaldrin Company Information
- Table 144. Backaldrin Description and Major Businesses
- Table 145. Backaldrin Bread Mixes Sales (K MT), Revenue (US$ Million), Price (USD/MT) and Gross Margin (2018-2023)
- Table 146. Backaldrin Bread Mixes Product Model Numbers, Pictures, Descriptions and Specifications
- Table 147. AngelYeast Company Information
- Table 148. AngelYeast Description and Major Businesses
- Table 149. AngelYeast Bread Mixes Sales (K MT), Revenue (US$ Million), Price (USD/MT) and Gross Margin (2018-2023)
- Table 150. Key Raw Materials Lists
- Table 151. Raw Materials Key Suppliers Lists
- Table 152. Bread Mixes Distributors List
- Table 153. Bread Mixes Customers List
- Table 154. Bread Mixes Market Trends
- Table 155. Bread Mixes Market Drivers
- Table 156. Bread Mixes Market Challenges
- Table 157. Bread Mixes Market Restraints
- Table 158. Research Programs/Design for This Report
- Table 159. Key Data Information from Secondary Sources
- Table 160. Key Data Information from Primary Sources
- Table 161. QYR Business Unit and Senior & Team Lead Analysts
List of Figures
- Figure 1. Bread Mixes Product Picture
- Figure 2. Global Bread Mixes Market Size Growth Rate by Type, 2018 VS 2022 VS 2029 (US$ Million)
- Figure 3. Global Bread Mixes Market Share by Type: 2022 & 2029
- Figure 4. White Bread Mixes Product Picture
- Figure 5. Artisan Bread Mixes Product Picture
- Figure 6. Whole Wheat Bread Mixes Product Picture
- Figure 7. Mochi Bread Mixes Mix Product Picture
- Figure 8. Mixed Grain Bread Mixes Product Picture
- Figure 9. Donut Product Picture
- Figure 10. Global Bread Mixes Market Size Growth Rate by Application, 2018 VS 2022 VS 2029 (US$ Million)
- Figure 11. Global Bread Mixes Market Share by Application: 2022 & 2029
- Figure 12. Bakery Shop
- Figure 13. Household
- Figure 14. Food processing
- Figure 15. Bread Mixes Report Years Considered
- Figure 16. Global Bread Mixes Revenue, (US$ Million), 2018 VS 2023 VS 2029
- Figure 17. Global Bread Mixes Revenue 2018-2029 (US$ Million)
- Figure 18. Global Bread Mixes Revenue (CAGR) by Region: 2018 VS 2022 VS 2029 (US$ Million)
- Figure 19. Global Bread Mixes Revenue Market Share by Region in Percentage: 2022 Versus 2029
- Figure 20. Global Bread Mixes Revenue Market Share by Region (2018-2029)
- Figure 21. Global Bread Mixes Sales 2018-2029 (K MT)
- Figure 22. Global Bread Mixes Sales (CAGR) by Region: 2018 VS 2022 VS 2029 (K MT)
- Figure 23. Global Bread Mixes Sales Market Share by Region (2018-2029)
- Figure 24. US & Canada Bread Mixes Sales YoY (2018-2029) & (K MT)
- Figure 25. US & Canada Bread Mixes Revenue YoY (2018-2029) & (US$ Million)
- Figure 26. Europe Bread Mixes Sales YoY (2018-2029) & (K MT)
- Figure 27. Europe Bread Mixes Revenue YoY (2018-2029) & (US$ Million)
- Figure 28. China Bread Mixes Sales YoY (2018-2029) & (K MT)
- Figure 29. China Bread Mixes Revenue YoY (2018-2029) & (US$ Million)
- Figure 30. Asia (excluding China) Bread Mixes Sales YoY (2018-2029) & (K MT)
- Figure 31. Asia (excluding China) Bread Mixes Revenue YoY (2018-2029) & (US$ Million)
- Figure 32. Middle East, Africa and Latin America Bread Mixes Sales YoY (2018-2029) & (K MT)
- Figure 33. Middle East, Africa and Latin America Bread Mixes Revenue YoY (2018-2029) & (US$ Million)
- Figure 34. The Bread Mixes Market Share of Top 10 and Top 5 Largest Manufacturers Around the World in 2022
- Figure 35. The Top 5 and 10 Largest Manufacturers of Bread Mixes in the World: Market Share by Bread Mixes Revenue in 2022
- Figure 36. Global Bread Mixes Sales Market Share by Type (2018-2029)
- Figure 37. Global Bread Mixes Revenue Market Share by Type (2018-2029)
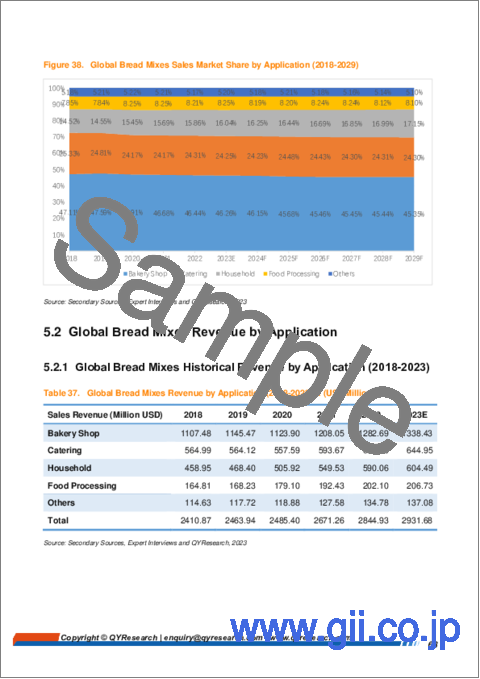
- Figure 38. Global Bread Mixes Sales Market Share by Application (2018-2029)
- Figure 39. Global Bread Mixes Revenue Market Share by Application (2018-2029)
- Figure 40. US & Canada Bread Mixes Sales Market Share by Type (2018-2029)
- Figure 41. US & Canada Bread Mixes Revenue Market Share by Type (2018-2029)
- Figure 42. US & Canada Bread Mixes Sales Market Share by Application (2018-2029)
- Figure 43. US & Canada Bread Mixes Revenue Market Share by Application (2018-2029)
- Figure 44. US & Canada Bread Mixes Revenue Share by Country (2018-2029)
- Figure 45. US & Canada Bread Mixes Sales Share by Country (2018-2029)
- Figure 46. US Bread Mixes Revenue (2018-2029) & (US$ Million)
- Figure 47. Canada Bread Mixes Revenue (2018-2029) & (US$ Million)
- Figure 48. Europe Bread Mixes Sales Market Share by Type (2018-2029)
- Figure 49. Europe Bread Mixes Revenue Market Share by Type (2018-2029)
- Figure 50. Europe Bread Mixes Sales Market Share by Application (2018-2029)
- Figure 51. Europe Bread Mixes Revenue Market Share by Application (2018-2029)
- Figure 52. Europe Bread Mixes Revenue Share by Country (2018-2029)
- Figure 53. Europe Bread Mixes Sales Share by Country (2018-2029)
- Figure 54. Germany Bread Mixes Revenue (2018-2029) & (US$ Million)
- Figure 55. France Bread Mixes Revenue (2018-2029) & (US$ Million)
- Figure 56. U.K. Bread Mixes Revenue (2018-2029) & (US$ Million)
- Figure 57. Italy Bread Mixes Revenue (2018-2029) & (US$ Million)
- Figure 58. Russia Bread Mixes Revenue (2018-2029) & (US$ Million)
- Figure 59. China Bread Mixes Sales Market Share by Type (2018-2029)
- Figure 60. China Bread Mixes Revenue Market Share by Type (2018-2029)
- Figure 61. China Bread Mixes Sales Market Share by Application (2018-2029)
- Figure 62. China Bread Mixes Revenue Market Share by Application (2018-2029)
- Figure 63. Asia Bread Mixes Sales Market Share by Type (2018-2029)
- Figure 64. Asia Bread Mixes Revenue Market Share by Type (2018-2029)
- Figure 65. Asia Bread Mixes Sales Market Share by Application (2018-2029)
- Figure 66. Asia Bread Mixes Revenue Market Share by Application (2018-2029)
- Figure 67. Asia Bread Mixes Revenue Share by Region (2018-2029)
- Figure 68. Asia Bread Mixes Sales Share by Region (2018-2029)
- Figure 69. Japan Bread Mixes Revenue (2018-2029) & (US$ Million)
- Figure 70. South Korea Bread Mixes Revenue (2018-2029) & (US$ Million)
- Figure 71. China Taiwan Bread Mixes Revenue (2018-2029) & (US$ Million)
- Figure 72. Southeast Asia Bread Mixes Revenue (2018-2029) & (US$ Million)
- Figure 73. India Bread Mixes Revenue (2018-2029) & (US$ Million)
- Figure 74. Australia Bread Mixes Revenue (2018-2029) & (US$ Million)
- Figure 75. Middle East, Africa and Latin America Bread Mixes Sales Market Share by Type (2018-2029)
- Figure 76. Middle East, Africa and Latin America Bread Mixes Revenue Market Share by Type (2018-2029)
- Figure 77. Middle East, Africa and Latin America Bread Mixes Sales Market Share by Application (2018-2029)
- Figure 78. Middle East, Africa and Latin America Bread Mixes Revenue Market Share by Application (2018-2029)
- Figure 79. Middle East, Africa and Latin America Bread Mixes Revenue Share by Country (2018-2029)
- Figure 80. Middle East, Africa and Latin America Bread Mixes Sales Share by Country (2018-2029)
- Figure 81. Brazil Bread Mixes Revenue (2018-2029) & (US$ Million)
- Figure 82. Mexico Bread Mixes Revenue (2018-2029) & (US$ Million)
- Figure 83. Turkey Bread Mixes Revenue (2018-2029) & (US$ Million)
- Figure 84. GCC Countries Bread Mixes Revenue (2018-2029) & (US$ Million)
- Figure 85. CSM Bread Mixes Product
- Figure 86. Krusteaz Bread Mixes Product
- Figure 87. General Mills Pillsbury Multi Grain Bread Mix Product
- Figure 88. AngelYeast Bread Mixes Product
- Figure 89. Bread Mixes Value Chain
- Figure 90. Channels of Distribution (Direct Vs Distribution)
- Figure 91. Distributors Profiles
- Figure 92. Bottom-up and Top-down Approaches for This Report
- Figure 93. Data Triangulation
- Figure 94. Key Executives Interviewed
The Bread Mixes market was valued at US$ 2844.93 million in 2022 and is projected to reach US$ 3838.33 million by 2029, at a CAGR of 4.59% during the forecast period (2023-2029).
The global key manufacturers of Bread Mixes include: Bakels, AB Mauri, Puratos, Zeelandia and AngelYeast, etc. In 2022, the global top five players had a share approximately 29.82% in terms of revenue.
Report Includes:
This report presents an overview of global market for Bread Mixes, sales, revenue and price. Analyses of the global market trends, with historic market revenue/sales data for 2018 - 2022, estimates for 2023, and projections of CAGR through 2029.
This report researches the key producers of Bread Mixes, also provides the sales of main regions and countries. Highlights of the upcoming market potential for Bread Mixes, and key regions/countries of focus to forecast this market into various segments and sub-segments. Country specific data and market value analysis for the U.S., Canada, Mexico, Brazil, China, Japan, South Korea, Southeast Asia, India, Germany, the U.K., Italy, Middle East, Africa, and Other Countries.
This report focuses on the Bread Mixes sales, revenue, market share and industry ranking of main manufacturers, data from 2018 to 2023. Identification of the major stakeholders in the global Bread Mixes market, and analysis of their competitive landscape and market positioning based on recent developments and segmental revenues. This report will help stakeholders to understand the competitive landscape and gain more insights and position their businesses and market strategies in a better way.
This report analyzes the segments data by Type, and by Application, sales, revenue, and price, from 2018 to 2029. Evaluation and forecast the market size for Bread Mixes sales, projected growth trends, production technology, application and end-user industry.
Descriptive company profiles of the major global players, including Baker & Baker, Bakemark, Zeelandia, Nippon Flour Mills, Puratos, IREKS, Bakels, Nisshin Seifun, and General Mills, etc.
By Company
- Bakels
- Puratos
- Zeelandia
- AB Mauri
- CSM
- IREKS
- Bakemark
- Krusteaz
- General Mills
- Dawn Foods
- Backaldrin
- AngelYeast
Segment by Type
- White Bread Mixes
- Artisan Bread Mixes
- Whole Wheat Bread Mixes
- Mochi Bread Mixes Mix
- Mixed Grain Bread Mixes
- Others
Segment by Application
- Bakery Shop
- Catering
- Household
- Food Processing
- Others
Segment by Region
- US & Canada
- U.S.
- Canada
- China
- Asia (excluding China)
- Japan
- South Korea
- China Taiwan
- Southeast Asia
- India
- Australia
- Europe
- Germany
- France
- U.K.
- Italy
- Russia
- Middle East, Africa, Latin America
- Brazil
- Mexico
- Turkey
- GCC Countries
Chapter Outline
Chapter 1: Introduces the report scope of the report, executive summary of different market segments (by Type, and by Application, etc), including the market size of each market segment, future development potential, and so on. It offers a high-level view of the current state of the market and its likely evolution in the short to mid-term, and long term.
Chapter 2: Sales (consumption), revenue of Bread Mixes in global, regional level and country level. It provides a quantitative analysis of the market size and development potential of each region and its main countries and introduces the market development, future development prospects, market space, and capacity of each country in the world.
Chapter 3: Detailed analysis of Bread Mixes manufacturers competitive landscape, price, sales, revenue, market share and industry ranking, latest development plan, merger, and acquisition information, etc.
Chapter 4: Provides the analysis of various market segments by Type, covering the sales, revenue, average price, and development potential of each market segment, to help readers find the blue ocean market in different market segments.
Chapter 5: Provides the analysis of various market segments by Application, covering the sales, revenue, average price, and development potential of each market segment, to help readers find the blue ocean market in different downstream markets.
Chapter 6: North America (US & Canada) by Type, by Application and by country, sales, and revenue for each segment.
Chapter 7: Europe by Type, by Application and by country, sales, and revenue for each segment.
Chapter 8: China by Type, and by Application, sales, and revenue for each segment.
Chapter 9: Asia (excluding China) by Type, by Application and by region, sales, and revenue for each segment.
Chapter 10: Middle East, Africa, and Latin America by Type, by Application and by country, sales, and revenue for each segment.
Chapter 11: Provides profiles of key manufacturers, introducing the basic situation of the main companies in the market in detail, including product descriptions and specifications, Bread Mixes sales, revenue, price, gross margin, and recent development, etc.
Chapter 12: Analysis of industrial chain, sales channel, key raw materials, distributors and customers.
Chapter 13: Introduces the market dynamics, latest developments of the market, the driving factors and restrictive factors of the market, the challenges and risks faced by manufacturers in the industry, and the analysis of relevant policies in the industry.
Chapter 14: The main points and conclusions of the report.
Table of Contents
1 STUDY COVERAGE
- 1.1 Bread Mixes Product Introduction
- 1.2 Market by Type
- 1.2.1 Global Bread Mixes Market Size Growth Rate by Type, 2018 VS 2022 VS 2029
- 1.2.2 White Bread Mixes
- 1.2.3 Artisan Bread Mixes
- 1.2.4 Whole Wheat Bread Mixes
- 1.2.5 Mochi Bread Mixes
- 1.2.6 Mixed Grain Bread Mixes
- 1.2.7 Others
- 1.3 Market by Application
- 1.3.1 Global Bread Mixes Market Size Growth Rate by Application, 2018 VS 2022 VS 2029
- 1.3.2 Bakery Shop
- 1.3.3 Catering
- 1.3.4 Household
- 1.3.5 Food Processing
- 1.3.6 Others
- 1.4 Assumptions and Limitations
- 1.5 Study Objectives
- 1.6 Years Considered
2 EXECUTIVE SUMMARY
- 2.1 Global Bread Mixes Revenue Estimates and Forecasts 2018-2029
- 2.2 Global Bread Mixes Revenue by Region
- 2.2.1 Global Bread Mixes Revenue by Region: 2018 VS 2022 VS 2029
- 2.2.2 Global Bread Mixes Revenue by Region (2018-2023)
- 2.2.3 Global Bread Mixes Revenue by Region (2024-2029)
- 2.2.4 Global Bread Mixes Revenue Market Share by Region (2018-2029)
- 2.3 Global Bread Mixes Sales Estimates and Forecasts 2018-2029
- 2.4 Global Bread Mixes Sales by Region
- 2.4.1 Global Bread Mixes Sales by Region: 2018 VS 2022 VS 2029
- 2.4.2 Global Bread Mixes Sales by Region (2018-2023)
- 2.4.3 Global Bread Mixes Sales by Region (2024-2029)
- 2.4.4 Global Bread Mixes Sales Market Share by Region (2018-2029)
- 2.5 US & Canada
- 2.6 Europe
- 2.7 China
- 2.8 Asia (excluding China)
- 2.9 Middle East, Africa and Latin America
3 COMPETITION BY MANUFACTURERS
- 3.1 Global Bread Mixes Sales by Manufacturers
- 3.1.1 Global Bread Mixes Sales by Manufacturers (2018-2023)
- 3.1.2 Global Bread Mixes Sales Market Share by Manufacturers (2018-2023)
- 3.1.3 Global Top 10 and Top 5 Largest Manufacturers of Bread Mixes in 2022
- 3.2 Global Bread Mixes Revenue by Manufacturers
- 3.2.1 Global Bread Mixes Revenue by Manufacturers (2018-2023)
- 3.2.2 Global Bread Mixes Revenue Market Share by Manufacturers (2018-2023)
- 3.2.3 Global Top 10 and Top 5 Companies by Bread Mixes Revenue in 2022
- 3.3 Global Key Players of Bread Mixes, Industry Ranking, 2021 VS 2022
- 3.4 Global Bread Mixes Sales Price by Manufacturers (2018-2023)
- 3.5 Analysis of Competitive Landscape
- 3.5.1 Manufacturers Market Concentration Ratio (CR5 and HHI)
- 3.5.2 Global Bread Mixes Market Share by Company Type (Tier 1, Tier 2, and Tier 3)
- 3.6 Global Key Manufacturers of Bread Mixes, Manufacturing Base Distribution and Headquarters
- 3.7 Global Key Manufacturers of Bread Mixes, Date of Enter into This Industry
4 MARKET SIZE BY TYPE
- 4.1 Global Bread Mixes Sales by Type
- 4.1.1 Global Bread Mixes Historical Sales by Type (2018-2023)
- 4.1.2 Global Bread Mixes Forecasted Sales by Type (2024-2029)
- 4.1.3 Global Bread Mixes Sales Market Share by Type (2018-2029)
- 4.2 Global Bread Mixes Revenue by Type
- 4.2.1 Global Bread Mixes Historical Revenue by Type (2018-2023)
- 4.2.2 Global Bread Mixes Forecasted Revenue by Type (2024-2029)
- 4.2.3 Global Bread Mixes Revenue Market Share by Type (2018-2029)
- 4.3 Global Bread Mixes Price by Type
- 4.3.1 Global Bread Mixes Price by Type (2018-2023)
- 4.3.2 Global Bread Mixes Price Forecast by Type (2024-2029)
5 MARKET SIZE BY APPLICATION
- 5.1 Global Bread Mixes Sales by Application
- 5.1.1 Global Bread Mixes Historical Sales by Application (2018-2023)
- 5.1.2 Global Bread Mixes Forecasted Sales by Application (2024-2029)
- 5.1.3 Global Bread Mixes Sales Market Share by Application (2018-2029)
- 5.2 Global Bread Mixes Revenue by Application
- 5.2.1 Global Bread Mixes Historical Revenue by Application (2018-2023)
- 5.2.2 Global Bread Mixes Forecasted Revenue by Application (2024-2029)
- 5.2.3 Global Bread Mixes Revenue Market Share by Application (2018-2029)
- 5.3 Global Bread Mixes Price by Application
- 5.3.1 Global Bread Mixes Price by Application (2018-2023)
- 5.3.2 Global Bread Mixes Price Forecast by Application (2024-2029)
6 US & CANADA
- 6.1 US & Canada Bread Mixes Market Size by Type
- 6.1.1 US & Canada Bread Mixes Sales by Type (2018-2029)
- 6.1.2 US & Canada Bread Mixes Revenue by Type (2018-2029)
- 6.2 US & Canada Bread Mixes Market Size by Application
- 6.2.1 US & Canada Bread Mixes Sales by Application (2018-2029)
- 6.2.2 US & Canada Bread Mixes Revenue by Application (2018-2029)
- 6.3 US & Canada Bread Mixes Market Size by Country
- 6.3.1 US & Canada Bread Mixes Revenue by Country: 2018 VS 2022 VS 2029
- 6.3.2 US & Canada Bread Mixes Revenue by Country (2018-2029)
- 6.3.3 US & Canada Bread Mixes Sales by Country (2018-2029)
- 6.3.4 US
- 6.3.5 Canada
7 EUROPE
- 7.1 Europe Bread Mixes Market Size by Type
- 7.1.1 Europe Bread Mixes Sales by Type (2018-2029)
- 7.1.2 Europe Bread Mixes Revenue by Type (2018-2029)
- 7.2 Europe Bread Mixes Market Size by Application
- 7.2.1 Europe Bread Mixes Sales by Application (2018-2029)
- 7.2.2 Europe Bread Mixes Revenue by Application (2018-2029)
- 7.3 Europe Bread Mixes Market Size by Country
- 7.3.1 Europe Bread Mixes Revenue by Country: 2018 VS 2022 VS 2029
- 7.3.2 Europe Bread Mixes Revenue by Country (2018-2029)
- 7.3.3 Europe Bread Mixes Sales by Country (2018-2029)
- 7.3.4 Germany
- 7.3.5 France
- 7.3.6 U.K.
- 7.3.7 Italy
- 7.3.8 Russia
8 CHINA
- 8.1 China Bread Mixes Market Size by Type
- 8.1.1 China Bread Mixes Sales by Type (2018-2029)
- 8.1.2 China Bread Mixes Revenue by Type (2018-2029)
- 8.2 China Bread Mixes Market Size by Application
- 8.2.1 China Bread Mixes Sales by Application (2018-2029)
- 8.2.2 China Bread Mixes Revenue by Application (2018-2029)
9 ASIA (EXCLUDING CHINA)
- 9.1 Asia Bread Mixes Market Size by Type
- 9.1.1 Asia Bread Mixes Sales by Type (2018-2029)
- 9.1.2 Asia Bread Mixes Revenue by Type (2018-2029)
- 9.2 Asia Bread Mixes Market Size by Application
- 9.2.1 Asia Bread Mixes Sales by Application (2018-2029)
- 9.2.2 Asia Bread Mixes Revenue by Application (2018-2029)
- 9.3 Asia Bread Mixes Market Size by Region
- 9.3.1 Asia Bread Mixes Revenue by Region: 2018 VS 2022 VS 2029
- 9.3.2 Asia Bread Mixes Revenue by Region (2018-2029)
- 9.3.3 Asia Bread Mixes Sales by Region (2018-2029)
- 9.3.4 Japan
- 9.3.5 South Korea
- 9.3.6 China Taiwan
- 9.3.7 Southeast Asia
- 9.3.8 India
- 9.3.9 Australia
10 MIDDLE EAST, AFRICA AND LATIN AMERICA
- 10.1 Middle East, Africa and Latin America Bread Mixes Market Size by Type
- 10.1.1 Middle East, Africa and Latin America Bread Mixes Sales by Type (2018-2029)
- 10.1.2 Middle East, Africa and Latin America Bread Mixes Revenue by Type (2018-2029)
- 10.2 Middle East, Africa and Latin America Bread Mixes Market Size by Application
- 10.2.1 Middle East, Africa and Latin America Bread Mixes Sales by Application (2018-2029)
- 10.2.2 Middle East, Africa and Latin America Bread Mixes Revenue by Application (2018-2029)
- 10.3 Middle East, Africa and Latin America Bread Mixes Market Size by Country
- 10.3.1 Middle East, Africa and Latin America Bread Mixes Revenue by Country: 2018 VS 2022 VS 2029
- 10.3.2 Middle East, Africa and Latin America Bread Mixes Revenue by Country (2018-2029)
- 10.3.3 Middle East, Africa and Latin America Bread Mixes Sales by Country (2018-2029)
- 10.3.4 Brazil
- 10.3.5 Mexico
- 10.3.6 Turkey
- 10.3.7 GCC Countries
11 CORPORATE PROFILE
- 11.1 Bakels
- 11.1.1 Bakels Company Information
- 11.1.2 Bakels Overview
- 11.1.3 Bakels Bread Mixes Sales, Price, Revenue and Gross Margin (2018-2023)
- 11.1.4 Bakels Bread Mixes Product Model Numbers, Pictures, Descriptions and Specifications
- 11.1.5 Bakels Recent Developments
- 11.2 Puratos
- 11.2.1 Puratos Company Information
- 11.2.2 Puratos Overview
- 11.2.3 Puratos Bread Mixes Sales, Price, Revenue and Gross Margin (2018-2023)
- 11.2.4 Puratos Bread Mixes Product Model Numbers, Pictures, Descriptions and Specifications
- 11.3 Zeelandia
- 11.3.1 Zeelandia Company Information
- 11.3.2 Zeelandia Overview
- 11.3.3 Zeelandia Bread Mixes Sales, Price, Revenue and Gross Margin (2018-2023)
- 11.3.4 Zeelandia Bread Mixes Product Model Numbers, Pictures, Descriptions and Specifications
- 11.4 AB Mauri
- 11.4.1 AB Mauri Company Information
- 11.4.2 AB Mauri Overview
- 11.4.3 AB Mauri Bread Mixes Sales, Price, Revenue and Gross Margin (2018-2023)
- 11.4.4 AB Mauri Bread Mixes Product Model Numbers, Pictures, Descriptions and Specifications
- 11.5 CSM
- 11.5.1 CSM Company Information
- 11.5.2 CSM Overview
- 11.5.3 CSM Bread Mixes Sales, Price, Revenue and Gross Margin (2018-2023)
- 11.5.4 CSM Bread Mixes Product Model Numbers, Pictures, Descriptions and Specifications
- 11.6 IREKS
- 11.6.1 IREKS Company Information
- 11.6.2 IREKS Overview
- 11.6.3 IREKS Bread Mixes Sales, Price, Revenue and Gross Margin (2018-2023)
- 11.6.4 IREKS Bread Mixes Product Model Numbers, Pictures, Descriptions and Specifications
- 11.7 Bakemark
- 11.7.1 Bakemark Company Information
- 11.7.2 Bakemark Overview
- 11.7.3 Bakemark Bread Mixes Sales, Price, Revenue and Gross Margin (2018-2023)
- 11.7.4 Bakemark Bread Mixes Product Model Numbers, Pictures, Descriptions and Specifications
- 11.7.5 Bakemark Recent Developments
- 11.8 Krusteaz
- 11.8.1 Krusteaz Company Information
- 11.8.2 Krusteaz Overview
- 11.8.3 Krusteaz Bread Mixes Sales, Price, Revenue and Gross Margin (2018-2023)
- 11.8.4 Krusteaz Bread Mixes Product Model Numbers, Pictures, Descriptions and Specifications
- 11.9 General Mills
- 11.9.1 General Mills Company Information
- 11.9.2 General Mills Overview
- 11.9.3 General Mills Bread Mixes Sales, Price, Revenue and Gross Margin (2018-2023)
- 11.9.4 General Mills Bread Mixes Product Model Numbers, Pictures, Descriptions and Specifications
- 11.10 Dawn Foods
- 11.10.1 Dawn Foods Company Information
- 11.10.2 Dawn Foods Overview
- 11.10.3 Dawn Foods Bread Mixes Sales, Price, Revenue and Gross Margin (2018-2023)
- 11.10.4 Dawn Foods Bread Mixes Product Model Numbers, Pictures, Descriptions and Specifications
- 11.10.5 Dawn Foods Recent Developments
- 11.11 Backaldrin
- 11.11.1 Backaldrin Company Information
- 11.11.2 Backaldrin Overview
- 11.11.3 Backaldrin Bread Mixes Sales, Price, Revenue and Gross Margin (2018-2023)
- 11.11.4 Backaldrin Bread Mixes Product Model Numbers, Pictures, Descriptions and Specifications
- 11.12 AngelYeast
- 11.12.1 AngelYeast Company Information
- 11.12.2 AngelYeast Overview
- 11.12.3 AngelYeast Bread Mixes Sales, Price, Revenue and Gross Margin (2018-2023)
- 11.12.4 AngelYeast Bread Mixes Product Model Numbers, Pictures, Descriptions and Specifications
12 INDUSTRY CHAIN AND SALES CHANNELS ANALYSIS
- 12.1 Bread Mixes Industry Chain Analysis
- 12.2 Bread Mixes Key Raw Materials
- 12.2.1 Key Raw Materials
- 12.2.2 Raw Materials Key Suppliers
- 12.3 Bread Mixes Production Mode & Process
- 12.4 Bread Mixes Sales and Marketing
- 12.4.1 Bread Mixes Sales Channels
- 12.4.2 Bread Mixes Distributors
- 12.5 Bread Mixes Customers
13 BREAD MIXES MARKET DYNAMICS
- 13.1.1 Bread Mixes Industry Trends
- 13.1.2 Bread Mixes Market Drivers
- 13.1.3 Bread Mixes Market Challenges
- 13.1.4 Bread Mixes Market Restraints
14 KEY FINDINGS IN THE GLOBAL BREAD MIXES STUDY
15 APPENDIX
- 15.1 Research Methodology
- 15.1.1 Methodology/Research Approach
- 15.1.2 Data Source
- 15.2 Author Details
- 15.3 Disclaimer
