|
|
市場調査レポート
商品コード
1358944
スポーツホスピタリティの世界市場:2029年までの予測Global Sports Hospitality Market Insights, Forecast to 2029 |
||||||
|
|
|||||||
カスタマイズ可能
適宜更新あり
|
|||||||


| スポーツホスピタリティの世界市場:2029年までの予測 |
|
出版日: 2023年10月10日
発行: QYResearch
ページ情報: 英文 152 Pages
納期: 2~3営業日
|

- 全表示
- 概要
- 図表
- 目次
世界のスポーツホスピタリティの市場規模は、2023年の53億2,374万米ドルから2029年には116億9,480万米ドルに成長し、予測期間中の年間平均成長率(CAGR)は14.02%と予測されています。
北米のスポーツホスピタリティの市場規模は、2023年の10億9,226万米ドルから2029年には27億338万米ドルに達すると予測され、2024年から2029年の予測期間中のCAGRは16.30%と見込まれています。
アジア太平洋スポーツホスピタリティの市場規模は、2023年の12億8,635万米ドルから2029年には29億522万米ドルに達すると予測され、2024年から2029年の予測期間中のCAGRは14.54%と見込まれています。
欧州のスポーツホスピタリティの市場規模は、2023年の25億2,977万米ドルから2029年には50億6,491万米ドルに達すると予測され、2024年から2029年の予測期間中のCAGRは12.27%と見込まれています。
スポーツホスピタリティの世界の主要企業には、STH Group、ATPI Ltd、KNT SPORT、CSM Sports and Entertainment、SPORTFIVE、Byrom plc、Delaware North、Dorna Sports、Gullivers Sports Travelなどがあります。2022年、世界の上位5社の売上高シェアは約9.08%でした。
当レポートでは、世界のスポーツホスピタリティ市場について調査し、市場の概要とともに、企業別、タイプ別、用途別、地域別の動向、および市場に参入する企業のプロファイルなどを提供しています。
目次
第1章 レポートの概要
- 調査範囲
- タイプ別市場分析
- 用途別市場
- 前提と制限
- 調査目的
- 対象年
第2章 世界の成長動向
- 世界のスポーツホスピタリティ市場の見通し(2018年~2029年)
- 世界のスポーツホスピタリティの成長動向、地域別
- スポーツホスピタリティ市場力学
第3章 主要参入企業による競合情勢
第4章 スポーツホスピタリティの内訳データ、タイプ別
- 世界のスポーツホスピタリティの市場規模実績(2018年~2023年)、タイプ別
- 世界のスポーツホスピタリティの市場規模予測(2024年~2029年)、タイプ別
第5章 スポーツホスピタリティの内訳データ、用途別
- 世界のスポーツホスピタリティの市場規模実績(2018年~2023年)、用途別
- 世界のスポーツホスピタリティの市場規模予測(2024年~2029年)、用途別
第6章 北米
第7章 欧州
第8章 中国
第9章 アジア(中国を除く)
第10章 中東・アフリカ
第11章 ラテンアメリカ
第12章 主要参入企業のプロファイル
- STH Group
- ATPI Ltd
- KNT SPORT
- CSM Sports and Entertainment
- Byrom plc
- SPORTFIVE
- Delaware North
- Dorna Sports
- Gullivers Sports Travel
- Compass Group
- Shankai Sports
- Fanatic Sports
- Emerald Sports
- Corinthian Sports
- RK Sports Hospitality
- Eventmasters
- Destination Sport Group
- Gala Events
- DAIMANI
第13章 アナリストの視点/結論
第14章 付録
List of Tables
- Table 1. Global Sports Hospitality Market Size Growth Rate by Type (US$ Million): 2018 VS 2022 VS 2029
- Table 2. Global Sports Hospitality Market Size Growth by Application (US$ Million): 2018 VS 2022 VS 2029
- Table 3. Global Sports Hospitality Market Size Growth Rate (CAGR) by Region (US$ Million): 2018 VS 2022 VS 2029
- Table 4. Global Sports Hospitality Market Size by Region (2018-2023) & (US$ Million)
- Table 5. Global Sports Hospitality Market Share by Region (2018-2023)
- Table 6. Global Sports Hospitality Forecasted Market Size by Region (2024-2029) & (US$ Million)
- Table 7. Global Sports Hospitality Market Share by Region (2024-2029)
- Table 8. Sports Hospitality Market Trends
- Table 9. Sports Hospitality Market Drivers
- Table 10. Sports Hospitality Market Challenges
- Table 11. Sports Hospitality Market Restraints
- Table 12. Global Sports Hospitality Revenue by Players (2018-2023) & (US$ Million)
- Table 13. Global Sports Hospitality Market Share by Players (2018-2023)
- Table 14. Global Top Sports Hospitality Players by Company Type (Tier 1, Tier 2, and Tier 3) & (based on the Revenue in Sports Hospitality as of 2021)
- Table 15. Global Sports Hospitality Industry Ranking 2021 VS 2022
- Table 16. Global 5 Largest Players Market Share by Sports Hospitality Revenue (CR5) & (2018-2023)
- Table 17. Global Key Players of Sports Hospitality, Headquarters and Area Served
- Table 18. Global Key Players of Sports Hospitality, Date of Establishment
- Table 19. Mergers & Acquisitions, Expansion Plans
- Table 20. Global Sports Hospitality Market Size by Type (2018-2023) & (US$ Million)
- Table 21. Global Sports Hospitality Revenue Market Share by Type (2018-2023)
- Table 22. Global Sports Hospitality Forecasted Market Size by Type (2024-2029) & (US$ Million)
- Table 23. Global Sports Hospitality Revenue Market Share by Type (2024-2029)
- Table 24. Global Sports Hospitality Market Size by Application (2018-2023) & (US$ Million)
- Table 25. Global Sports Hospitality Revenue Market Share by Application (2018-2023)
- Table 26. Global Sports Hospitality Forecasted Market Size by Application (2024-2029) & (US$ Million)
- Table 27. Global Sports Hospitality Revenue Market Share by Application (2024-2029)
- Table 28. North America Sports Hospitality Market Size by Type (2018-2023) & (US$ Million)
- Table 29. North America Sports Hospitality Market Size by Type (2024-2029) & (US$ Million)
- Table 30. North America Sports Hospitality Market Size by Application (2018-2023) & (US$ Million)
- Table 31. North America Sports Hospitality Market Size by Application (2024-2029) & (US$ Million)
- Table 32. North America Sports Hospitality Growth Rate (CAGR) by Country (US$ Million): 2018 VS 2022 VS 2029
- Table 33. North America Sports Hospitality Market Size by Country (2018-2023) & (US$ Million)
- Table 34. North America Sports Hospitality Market Size by Country (2024-2029) & (US$ Million)
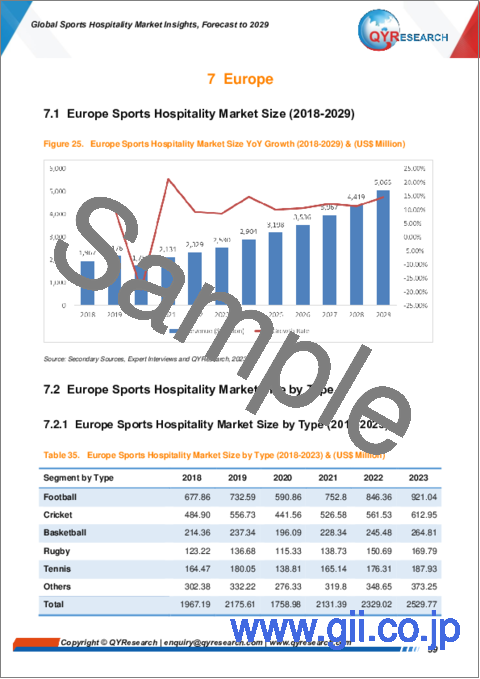
- Table 35. Europe Sports Hospitality Market Size by Type (2018-2023) & (US$ Million)
- Table 36. Europe Sports Hospitality Market Size by Type (2024-2029) & (US$ Million)
- Table 37. Europe Sports Hospitality Market Size by Application (2018-2023) & (US$ Million)
- Table 38. Europe Sports Hospitality Market Size by Application (2024-2029) & (US$ Million)
- Table 39. Europe Sports Hospitality Growth Rate (CAGR) by Country (US$ Million): 2018 VS 2022 VS 2029
- Table 40. Europe Sports Hospitality Market Size by Country (2018-2023) & (US$ Million)
- Table 41. Europe Sports Hospitality Market Size by Country (2024-2029) & (US$ Million)
- Table 42. China Sports Hospitality Market Size by Type (2018-2023) & (US$ Million)
- Table 43. China Sports Hospitality Market Size by Type (2024-2029) & (US$ Million)
- Table 44. China Sports Hospitality Market Size by Application (2018-2023) & (US$ Million)
- Table 45. China Sports Hospitality Market Size by Application (2024-2029) & (US$ Million)
- Table 46. Asia Sports Hospitality Market Size by Type (2018-2023) & (US$ Million)
- Table 47. Asia Sports Hospitality Market Size by Type (2024-2029) & (US$ Million)
- Table 48. Asia Sports Hospitality Market Size by Application (2018-2023) & (US$ Million)
- Table 49. Asia Sports Hospitality Market Size by Application (2024-2029) & (US$ Million)
- Table 50. Asia Sports Hospitality Growth Rate (CAGR) by Region (US$ Million): 2018 VS 2022 VS 2029
- Table 51. Asia Sports Hospitality Market Size by Region (2018-2023) & (US$ Million)
- Table 52. Asia Sports Hospitality Market Size by Region (2024-2029) & (US$ Million)
- Table 53. Middle East and Africa Sports Hospitality Market Size by Type (2018-2023) & (US$ Million)
- Table 54. Middle East and Africa Sports Hospitality Market Size by Type (2024-2029) & (US$ Million)
- Table 55. Middle East and Africa Sports Hospitality Market Size by Application (2018-2023) & (US$ Million)
- Table 56. Middle East and Africa Sports Hospitality Market Size by Application (2024-2029) & (US$ Million)
- Table 57. Middle East and Africa Sports Hospitality Growth Rate (CAGR) by Country (US$ Million): 2018 VS 2022 VS 2029
- Table 58. Middle East and Africa Sports Hospitality Market Size by Country (2018-2023) & (US$ Million)
- Table 59. Middle East and Africa Sports Hospitality Market Size by Country (2024-2029) & (US$ Million)
- Table 60. Latin America Sports Hospitality Market Size by Type (2018-2023) & (US$ Million)
- Table 61. Latin America Sports Hospitality Market Size by Type (2024-2029) & (US$ Million)
- Table 62. Latin America Sports Hospitality Market Size by Application (2018-2023) & (US$ Million)
- Table 63. Latin America Sports Hospitality Market Size by Application (2024-2029) & (US$ Million)
- Table 64. Latin America Sports Hospitality Growth Rate (CAGR) by Country (US$ Million): 2018 VS 2022 VS 2029
- Table 65. Latin America Sports Hospitality Market Size by Country (2018-2023) & (US$ Million)
- Table 66. Latin America Sports Hospitality Market Size by Country (2024-2029) & (US$ Million)
- Table 67. STH Group Company Details
- Table 68. STH Group Business Overview
- Table 69. STH Group Sports Hospitality Product
- Table 70. STH Group Revenue in Sports Hospitality Business (2018-2023) & (US$ Million)
- Table 71. ATPI Ltd Company Details
- Table 72. ATPI Ltd Business Overview
- Table 73. ATPI Ltd Sports Hospitality Product
- Table 74. ATPI Ltd Revenue in Sports Hospitality Business (2018-2023) & (US$ Million)
- Table 75. KNT SPORT Company Details
- Table 76. KNT SPORT Business Overview
- Table 77. KNT SPORT Sports Hospitality Product
- Table 78. KNT SPORT Revenue in Sports Hospitality Business (2018-2023) & (US$ Million)
- Table 79. CSM Sports and Entertainment Company Details
- Table 80. CSM Sports and Entertainment Business Overview
- Table 81. CSM Sports and Entertainment Sports Hospitality Product
- Table 82. CSM Sports and Entertainment Revenue in Sports Hospitality Business (2018-2023) & (US$ Million)
- Table 83. Byrom plc Company Details
- Table 84. Byrom plc Business Overview
- Table 85. Byrom plc Sports Hospitality Product
- Table 86. Byrom plc Revenue in Sports Hospitality Business (2018-2023) & (US$ Million)
- Table 87. SPORTFIVE Company Details
- Table 88. SPORTFIVE Business Overview
- Table 89. SPORTFIVE Sports Hospitality Product
- Table 90. SPORTFIVE Revenue in Sports Hospitality Business (2018-2023) & (US$ Million)
- Table 91. Delaware North Company Details
- Table 92. Delaware North Business Overview
- Table 93. Delaware North Sports Hospitality Product
- Table 94. Delaware North Revenue in Sports Hospitality Business (2018-2023) & (US$ Million)
- Table 95. Dorna Sports Company Details
- Table 96. Dorna Sports Business Overview
- Table 97. Dorna Sports Sports Hospitality Product
- Table 98. Dorna Sports Revenue in Sports Hospitality Business (2018-2023) & (US$ Million)
- Table 99. Gullivers Sports Travel Company Details
- Table 100. Gullivers Sports Travel Business Overview
- Table 101. Gullivers Sports Travel Sports Hospitality Product
- Table 102. Gullivers Sports Travel Revenue in Sports Hospitality Business (2018-2023) & (US$ Million)
- Table 103. Compass Group Company Details
- Table 104. Compass Group Business Overview
- Table 105. Compass Group Sports Hospitality Product
- Table 106. Compass Group Revenue in Sports Hospitality Business (2018-2023) & (US$ Million)
- Table 107. Shankai Sports Company Details
- Table 108. Shankai Sports Business Overview
- Table 109. Shankai Sports Sports Hospitality Product
- Table 110. Shankai Sports Revenue in Sports Hospitality Business (2018-2023) & (US$ Million)
- Table 111. Fanatic Sports Company Details
- Table 112. Fanatic Sports Business Overview
- Table 113. Fanatic Sports Sports Hospitality Product
- Table 114. Fanatic Sports Revenue in Sports Hospitality Business (2018-2023) & (US$ Million)
- Table 115. Emerald Sports Company Details
- Table 116. Emerald Sports Business Overview
- Table 117. Emerald Sports Sports Hospitality Product
- Table 118. Emerald Sports Revenue in Sports Hospitality Business (2018-2023) & (US$ Million)
- Table 119. Corinthian Sports Company Details
- Table 120. Corinthian Sports Business Overview
- Table 121. Corinthian Sports Sports Hospitality Product
- Table 122. Corinthian Sports Revenue in Sports Hospitality Business (2018-2023) & (US$ Million)
- Table 123. RK Sports Hospitality Company Details
- Table 124. RK Sports Hospitality Business Overview
- Table 125. RK Sports Hospitality Sports Hospitality Product
- Table 126. RK Sports Hospitality Revenue in Sports Hospitality Business (2018-2023) & (US$ Million)
- Table 127. Eventmasters Company Details
- Table 128. Eventmasters Business Overview
- Table 129. Eventmasters Sports Hospitality Product
- Table 130. Eventmasters Revenue in Sports Hospitality Business (2018-2023) & (US$ Million)
- Table 131. Destination Sport Group Company Details
- Table 132. Destination Sport Group Business Overview
- Table 133. Destination Sport Group Sports Hospitality Product
- Table 134. Destination Sport Group Revenue in Sports Hospitality Business (2018-2023) & (US$ Million)
- Table 135. Gala Events Company Details
- Table 136. Gala Events Business Overview
- Table 137. Gala Events Sports Hospitality Product
- Table 138. Gala Events Revenue in Sports Hospitality Business (2018-2023) & (US$ Million)
- Table 139. DAIMANI Company Details
- Table 140. DAIMANI Business Overview
- Table 141. DAIMANI Sports Hospitality Product
- Table 142. DAIMANI Revenue in Sports Hospitality Business (2018-2023) & (US$ Million)
- Table 143. Research Programs/Design for This Report
- Table 144. Key Data Information from Secondary Sources
- Table 145. Key Data Information from Primary Sources
- Table 146. QYR Business Unit and Senior & Team Lead Analysts
List of Figures
- Figure 1. Global Sports Hospitality Market Size Growth Rate by Type, 2018 VS 2022 VS 2029 (US$ Million)
- Figure 2. Global Sports Hospitality Market Share by Type: 2022 VS 2029
- Figure 3. Football Features
- Figure 4. Cricket Features
- Figure 5. Basketball Features
- Figure 6. Rugby Features
- Figure 7. Tennis Features
- Figure 8. Others Features
- Figure 9. Global Sports Hospitality Market Size Growth Rate by Application, 2018 VS 2022 VS 2029 (US$ Million)
- Figure 10. Global Sports Hospitality Market Share by Application: 2022 VS 2029
- Figure 11. Individual Case Studies
- Figure 12. Group Case Studies
- Figure 13. Sports Hospitality Report Years Considered
- Figure 14. Global Sports Hospitality Market Size (US$ Million), Year-over-Year: 2018-2029
- Figure 15. Global Sports Hospitality Market Size, (US$ Million), 2018 VS 2022 VS 2029
- Figure 16. Global Sports Hospitality Market Share by Region: 2022 VS 2029
- Figure 17. Global Top Sports Hospitality Players by Company Type (Tier 1, Tier 2, and Tier 3) & (based on the Revenue in Sports Hospitality as of 2022)
- Figure 18. The Top 10 and 5 Players Market Share by Sports Hospitality Revenue in 2022
- Figure 19. North America Sports Hospitality Market Size YoY Growth (2018-2029) & (US$ Million)
- Figure 20. North America Sports Hospitality Market Share by Type (2018-2029)
- Figure 21. North America Sports Hospitality Market Share by Application (2018-2029)
- Figure 22. North America Sports Hospitality Market Share by Country (2018-2029)
- Figure 23. United States Sports Hospitality Market Size YoY Growth (2018-2029) & (US$ Million)
- Figure 24. Canada Sports Hospitality Market Size YoY Growth (2018-2029) & (US$ Million)
- Figure 25. Europe Sports Hospitality Market Size YoY Growth (2018-2029) & (US$ Million)
- Figure 26. Europe Sports Hospitality Market Share by Type (2018-2029)
- Figure 27. Europe Sports Hospitality Market Share by Application (2018-2029)
- Figure 28. Europe Sports Hospitality Market Share by Country (2018-2029)
- Figure 29. Germany Sports Hospitality Market Size YoY Growth (2018-2029) & (US$ Million)
- Figure 30. France Sports Hospitality Market Size YoY Growth (2018-2029) & (US$ Million)
- Figure 31. U.K. Sports Hospitality Market Size YoY Growth (2018-2029) & (US$ Million)
- Figure 32. Italy Sports Hospitality Market Size YoY Growth (2018-2029) & (US$ Million)
- Figure 33. Russia Sports Hospitality Market Size YoY Growth (2018-2029) & (US$ Million)
- Figure 34. China Sports Hospitality Market Size YoY Growth (2018-2029) & (US$ Million)
- Figure 35. China Sports Hospitality Market Share by Type (2018-2029)
- Figure 36. China Sports Hospitality Market Share by Application (2018-2029)
- Figure 37. Asia Sports Hospitality Market Size YoY Growth (2018-2029) & (US$ Million)
- Figure 38. Asia Sports Hospitality Market Share by Type (2018-2029)
- Figure 39. Asia Sports Hospitality Market Share by Application (2018-2029)
- Figure 40. Asia Sports Hospitality Market Share by Region (2018-2029)
- Figure 41. Japan Sports Hospitality Market Size YoY Growth (2018-2029) & (US$ Million)
- Figure 42. South Korea Sports Hospitality Market Size YoY Growth (2018-2029) & (US$ Million)
- Figure 43. Australia Sports Hospitality Market Size YoY Growth (2018-2029) & (US$ Million)
- Figure 44. Southeast Asia Sports Hospitality Market Size YoY Growth (2018-2029) & (US$ Million)
- Figure 45. India Sports Hospitality Market Size YoY Growth (2018-2029) & (US$ Million)
- Figure 46. Middle East and Africa Sports Hospitality Market Size YoY Growth (2018-2029) & (US$ Million)
- Figure 47. Middle East and Africa Sports Hospitality Market Share by Type (2018-2029)
- Figure 48. Middle East and Africa Sports Hospitality Market Share by Application (2018-2029)
- Figure 49. Middle East and Africa Sports Hospitality Market Share by Country (2018-2029)
- Figure 50. Saudi Arabia Sports Hospitality Market Size YoY Growth (2018-2029) & (US$ Million)
- Figure 51. UAE Sports Hospitality Market Size YoY Growth (2018-2029) & (US$ Million)
- Figure 52. Qatar Sports Hospitality Market Size YoY Growth (2018-2029) & (US$ Million)
- Figure 53. Latin America Sports Hospitality Market Size YoY Growth (2018-2029) & (US$ Million)
- Figure 54. Latin America Sports Hospitality Market Share by Type (2018-2029)
- Figure 55. Latin America Sports Hospitality Market Share by Application (2018-2029)
- Figure 56. Latin America Sports Hospitality Market Share by Country (2018-2029)
- Figure 57. Brazil Sports Hospitality Market Size YoY Growth (2018-2029) & (US$ Million)
- Figure 58. Mexico Sports Hospitality Market Size YoY Growth (2018-2029) & (US$ Million)
- Figure 59. Argentina Sports Hospitality Market Size YoY Growth (2018-2029) & (US$ Million)
- Figure 60. STH Group Revenue Growth Rate in Sports Hospitality Business (2018-2023)
- Figure 61. ATPI Ltd Revenue Growth Rate in Sports Hospitality Business (2018-2023)
- Figure 62. KNT SPORT Revenue Growth Rate in Sports Hospitality Business (2018-2023)
- Figure 63. CSM Sports and Entertainment Revenue Growth Rate in Sports Hospitality Business (2018-2023)
- Figure 64. Byrom plc Revenue Growth Rate in Sports Hospitality Business (2018-2023)
- Figure 65. SPORTFIVE Revenue Growth Rate in Sports Hospitality Business (2018-2023)
- Figure 66. Delaware North Revenue Growth Rate in Sports Hospitality Business (2018-2023)
- Figure 67. Dorna Sports Revenue Growth Rate in Sports Hospitality Business (2018-2023)
- Figure 68. Gullivers Sports Travel Revenue Growth Rate in Sports Hospitality Business (2018-2023)
- Figure 69. Compass Group Revenue Growth Rate in Sports Hospitality Business (2018-2023)
- Figure 70. Shankai Sports Revenue Growth Rate in Sports Hospitality Business (2018-2023)
- Figure 71. Fanatic Sports Revenue Growth Rate in Sports Hospitality Business (2018-2023)
- Figure 72. Emerald Sports Revenue Growth Rate in Sports Hospitality Business (2018-2023)
- Figure 73. Corinthian Sports Revenue Growth Rate in Sports Hospitality Business (2018-2023)
- Figure 74. RK Sports Hospitality Revenue Growth Rate in Sports Hospitality Business (2018-2023)
- Figure 75. Eventmasters Revenue Growth Rate in Sports Hospitality Business (2018-2023)
- Figure 76. Destination Sport Group Revenue Growth Rate in Sports Hospitality Business (2018-2023)
- Figure 77. Gala Events Revenue Growth Rate in Sports Hospitality Business (2018-2023)
- Figure 78. DAIMANI Revenue Growth Rate in Sports Hospitality Business (2018-2023)
- Figure 79. Bottom-up and Top-down Approaches for This Report
- Figure 80. Data Triangulation
- Figure 81. Key Executives Interviewed
Market Analysis and Insights
The global Sports Hospitality market is projected to grow from US$ 5323.74 million in 2023 to US$ 11694.80 million by 2029, at a Compound Annual Growth Rate (CAGR) of 14.02% during the forecast period.
The North America market for Sports Hospitality is estimated to increase from $ 1092.26 million in 2023 to reach $ 2703.38 million by 2029, at a CAGR of 16.30% during the forecast period of 2024 through 2029.
The Asia Pacific market for Sports Hospitality is estimated to increase from $ 1286.35 million in 2023 to reach $ 2905.22 million by 2029, at a CAGR of 14.54% during the forecast period of 2024 through 2029.
The Europe market for Sports Hospitality is estimated to increase from $ 2529.77 million in 2023 to reach 5064.91$ million by 2029, at a CAGR of 12.27% during the forecast period of 2024 through 2029.
The global key companies of Sports Hospitality include: STH Group, ATPI Ltd, KNT SPORT, CSM Sports and Entertainment, SPORTFIVE, Byrom plc, Delaware North, Dorna Sports, and Gullivers Sports Travel, etc. In 2022, the global top five players had a share approximately 9.08% in terms of revenue
Report Includes:
This report presents an overview of global market for Sports Hospitality market size. Analyses of the global market trends, with historic market revenue data for 2018 - 2022, estimates for 2023, and projections of CAGR through 2029.
This report researches the key producers of Sports Hospitality, also provides the revenue of main regions and countries. Highlights of the upcoming market potential for Sports Hospitality, and key regions/countries of focus to forecast this market into various segments and sub-segments. Country specific data and market value analysis for the U.S., Canada, Mexico, Brazil, China, Japan, South Korea, Southeast Asia, India, Germany, the U.K., Italy, Middle East, Africa, and Other Countries.
This report focuses on the Sports Hospitality revenue, market share and industry ranking of main companies, data from 2018 to 2023. Identification of the major stakeholders in the global Sports Hospitality market, and analysis of their competitive landscape and market positioning based on recent developments and segmental revenues. This report will help stakeholders to understand the competitive landscape and gain more insights and position their businesses and market strategies in a better way.
This report analyzes the segments data by Type and by Application, revenue, and growth rate, from 2018 to 2029. Evaluation and forecast the market size for Sports Hospitality revenue, projected growth trends, production technology, application and end-user industry.
Descriptive company profiles of the major global players, including STH Group, ATPI Ltd, KNT SPORT, CSM Sports and Entertainment, SPORTFIVE, Byrom plc, Delaware North, Dorna Sports, and Gullivers Sports Travel, etc.
By Company
- STH Group
- ATPI Ltd
- KNT SPORT
- CSM Sports and Entertainment
- SPORTFIVE
- Byrom plc
- Delaware North
- Dorna Sports
- Gullivers Sports Travel
- Compass Group
- Shankai Sports
- Fanatic Sports
- Emerald Sports
- Corinthian Sports
- RK Sports Hospitality
- Eventmasters
- Destination Sport Group
- Gala Events
- DAIMANI
Segment by Type
- Football
- Cricket
- Basketball
- Rugby
- Tennis
- Others
Segment by Application
- Individual
- Group
By Region
- North America
- United States
- Canada
- Asia-Pacific
- China
- Japan
- South Korea
- Southeast Asia
- India
- Australia
- Rest of Asia
- Europe
- Germany
- France
- U.K.
- Italy
- Russia
- Rest of Europe
- Latin America
- Mexico
- Brazil
- Argentina
- Rest of Latin America
- Middle East & Africa
- Qutar
- Saudi Arabia
- UAE
- Rest of MEA
Chapter Outline
- Chapter 1: Introduces the report scope of the report, executive summary of different market segments (product type, application, etc), including the market size of each market segment, future development potential, and so on. It offers a high-level view of the current state of the market and its likely evolution in the short to mid-term, and long term.
- Chapter 2: Revenue of Sports Hospitality in global and regional level. It provides a quantitative analysis of the market size and development potential of each region and its main countries and introduces the market development, future development prospects, market space, and capacity of each country in the world. This section also introduces the market dynamics, latest developments of the market, the driving factors and restrictive factors of the market, the challenges and risks faced by companies in the industry, and the analysis of relevant policies in the industry.
- Chapter 3: Detailed analysis of Sports Hospitality companies' competitive landscape, revenue, market share and industry ranking, latest development plan, merger, and acquisition information, etc.
- Chapter 4: Provides the analysis of various market segments by Type, covering the revenue, and development potential of each market segment, to help readers find the blue ocean market in different market segments.
- Chapter 5: Provides the analysis of various market segments by Application, covering the revenue, and development potential of each market segment, to help readers find the blue ocean market in different downstream markets.
- Chapter 6: North America (US & Canada) by Type, by Application and by country, revenue for each segment.
- Chapter 7: Europe by Type, by Application and by country, revenue for each segment.
- Chapter 8: China by Type, and by Application, revenue for each segment.
- Chapter 9: Asia (excluding China) by Type, by Application and by region, revenue for each segment.
- Chapter 10: Middle East and Africa by Type, by Application and by country, revenue for each segment.
- Chapter 11: Latin America by Type, by Application and by country, revenue for each segment.
- Chapter 12: Provides profiles of key companies, introducing the basic situation of the main companies in the market in detail, including product descriptions and specifications, Sports Hospitality revenue, gross margin, and recent development, etc.
- Chapter 13: Analyst's Viewpoints/Conclusions
Table of Contents
1 Report Overview
- 1.1 Study Scope
- 1.2 Market Analysis by Type
- 1.2.1 Global Sports Hospitality Market Size Growth Rate by Type: 2018 VS 2022 VS 2029
- 1.2.2 Football
- 1.2.3 Cricket
- 1.2.4 Basketball
- 1.2.5 Rugby
- 1.2.6 Tennis
- 1.2.7 Others
- 1.3 Market by Application
- 1.3.1 Global Sports Hospitality Market Share by Application: 2018 VS 2022 VS 2029
- 1.3.2 Individual
- 1.3.3 Group
- 1.4 Assumptions and Limitations
- 1.5 Study Objectives
- 1.6 Years Considered
2 Global Growth Trends
- 2.1 Global Sports Hospitality Market Perspective (2018-2029)
- 2.2 Global Sports Hospitality Growth Trends by Region
- 2.2.1 Global Sports Hospitality Market Size by Region: 2018 VS 2022 VS 2029
- 2.2.2 Sports Hospitality Historic Market Size by Region (2018-2023)
- 2.2.3 Sports Hospitality Forecasted Market Size by Region (2024-2029)
- 2.3 Sports Hospitality Market Dynamics
- 2.3.1 Sports Hospitality Industry Trends
- 2.3.2 Sports Hospitality Market Drivers
- 2.3.3 Sports Hospitality Market Challenges
- 2.3.4 Sports Hospitality Market Restraints
3 Competition Landscape by Key Players
- 3.1 Global Revenue Sports Hospitality by Players
- 3.1.1 Global Sports Hospitality Revenue by Players (2018-2023)
- 3.1.2 Global Sports Hospitality Revenue Market Share by Players (2018-2023)
- 3.2 Global Sports Hospitality Market Share by Company Type (Tier 1, Tier 2, and Tier 3)
- 3.3 Global Key Players of Sports Hospitality, Ranking by Revenue, 2021 VS 2022 VS 2023
- 3.4 Global Sports Hospitality Market Concentration Ratio
- 3.4.1 Global Sports Hospitality Market Concentration Ratio (CR5)
- 3.4.2 Global Top 10 and Top 5 Companies by Sports Hospitality Revenue in 2022
- 3.5 Global Key Players of Sports Hospitality Head office and Area Served
- 3.6 Global Key Players of Sports Hospitality, Date of Establishment
- 3.7 Mergers & Acquisitions, Expansion Plans
4 Sports Hospitality Breakdown Data by Type
- 4.1 Global Sports Hospitality Historic Market Size by Type (2018-2023)
- 4.2 Global Sports Hospitality Forecasted Market Size by Type (2024-2029)
5 Sports Hospitality Breakdown Data by Application
- 5.1 Global Sports Hospitality Historic Market Size by Application (2018-2023)
- 5.2 Global Sports Hospitality Forecasted Market Size by Application (2024-2029)
6 North America
- 6.1 North America Sports Hospitality Market Size (2018-2029)
- 6.2 North America Sports Hospitality Market Size by Type
- 6.2.1 North America Sports Hospitality Market Size by Type (2018-2023)
- 6.2.2 North America Sports Hospitality Market Size by Type (2024-2029)
- 6.2.3 North America Sports Hospitality Market Share by Type (2018-2029)
- 6.3 North America Sports Hospitality Market Size by Application
- 6.3.1 North America Sports Hospitality Market Size by Application (2018-2023)
- 6.3.2 North America Sports Hospitality Market Size by Application (2024-2029)
- 6.3.3 North America Sports Hospitality Market Share by Application (2018-2029)
- 6.4 North America Sports Hospitality Market Size by Country
- 6.4.1 North America Sports Hospitality Market Size by Country: 2018 VS 2022 VS 2029
- 6.4.2 North America Sports Hospitality Market Size by Country (2018-2023)
- 6.4.3 North America Sports Hospitality Market Share by Country (2024-2029)
- 6.4.4 United States
- 6.4.5 Canada
7 Europe
- 7.1 Europe Sports Hospitality Market Size (2018-2029)
- 7.2 Europe Sports Hospitality Market Size by Type
- 7.2.1 Europe Sports Hospitality Market Size by Type (2018-2023)
- 7.2.2 Europe Sports Hospitality Market Size by Type (2024-2029)
- 7.2.3 Europe Sports Hospitality Market Share by Type (2018-2029)
- 7.3 Europe Sports Hospitality Market Size by Application
- 7.3.1 Europe Sports Hospitality Market Size by Application (2018-2023)
- 7.3.2 Europe Sports Hospitality Market Size by Application (2024-2029)
- 7.3.3 Europe Sports Hospitality Market Share by Application (2018-2029)
- 7.4 Europe Sports Hospitality Market Size by Country
- 7.4.1 Europe Sports Hospitality Market Size by Country: 2018 VS 2022 VS 2029
- 7.4.2 Europe Sports Hospitality Market Size by Country (2018-2023)
- 7.4.3 Europe Sports Hospitality Market Size by Country (2024-2029)
- 7.4.4 Germany
- 7.4.5 France
- 7.4.6 U.K.
- 7.4.7 Italy
- 7.4.8 Russia
8 China
- 8.1 China Sports Hospitality Market Size (2018-2029)
- 8.2 China Sports Hospitality Market Size by Type
- 8.2.1 China Sports Hospitality Market Size by Type (2018-2023)
- 8.2.2 China Sports Hospitality Market Size by Type (2024-2029)
- 8.2.3 China Sports Hospitality Market Share by Type (2018-2029)
- 8.3 China Sports Hospitality Market Size by Application
- 8.3.1 China Sports Hospitality Market Size by Application (2018-2023)
- 8.3.2 China Sports Hospitality Market Size by Application (2024-2029)
- 8.3.3 China Sports Hospitality Market Share by Application (2018-2029)
9 Asia (excluding China)
- 9.1 Asia Sports Hospitality Market Size (2018-2029)
- 9.2 Asia Sports Hospitality Market Size by Type
- 9.2.1 Asia Sports Hospitality Market Size by Type (2018-2023)
- 9.2.2 Asia Sports Hospitality Market Size by Type (2024-2029)
- 9.2.3 Asia Sports Hospitality Market Share by Type (2018-2029)
- 9.3 Asia Sports Hospitality Market Size by Application
- 9.3.1 Asia Sports Hospitality Market Size by Application (2018-2023)
- 9.3.2 Asia Sports Hospitality Market Size by Application (2024-2029)
- 9.3.3 Asia Sports Hospitality Market Share by Application (2018-2029)
- 9.4 Asia Sports Hospitality Market Size by Region
- 9.4.1 Asia Sports Hospitality Market Size by Region: 2018 VS 2022 VS 2029
- 9.4.2 Asia Sports Hospitality Market Size by Region (2018-2023)
- 9.4.3 Asia Sports Hospitality Market Size by Region (2024-2029)
- 9.4.4 Japan
- 9.4.5 South Korea
- 9.4.6 Australia
- 9.4.7 Southeast Asia
- 9.4.8 India
10 Middle East and Africa
- 10.1 Middle East and Africa Sports Hospitality Market Size (2018-2029)
- 10.2 Middle East and Africa Sports Hospitality Market Size by Type
- 10.2.1 Middle East and Africa Sports Hospitality Market Size by Type (2018-2023)
- 10.2.2 Middle East and Africa Sports Hospitality Market Size by Type (2024-2029)
- 10.2.3 Middle East and Africa Sports Hospitality Market Share by Type (2018-2029)
- 10.3 Middle East and Africa Sports Hospitality Market Size by Application
- 10.3.1 Middle East and Africa Sports Hospitality Market Size by Application (2018-2023)
- 10.3.2 Middle East and Africa Sports Hospitality Market Size by Application (2024-2029)
- 10.3.3 Middle East and Africa Sports Hospitality Market Share by Application (2018-2029)
- 10.4 Middle East and Africa Sports Hospitality Market Size by Country
- 10.4.1 Middle East and Africa Sports Hospitality Market Size by Country: 2018 VS 2022 VS 2029
- 10.4.2 Middle East and Africa Sports Hospitality Market Size by Country (2018-2023)
- 10.4.3 Middle East and Africa Sports Hospitality Market Size by Country (2024-2029)
- 10.4.4 Saudi Arabia
- 10.4.5 UAE
- 10.4.6 Qatar
11 Latin America
- 11.1 Latin America Sports Hospitality Market Size (2018-2029)
- 11.2 Latin America Sports Hospitality Market Size by Type
- 11.2.1 Latin America Sports Hospitality Market Size by Type (2018-2023)
- 11.2.2 Latin America Sports Hospitality Market Size by Type (2024-2029)
- 11.2.3 Latin America Sports Hospitality Market Share by Type (2018-2029)
- 11.3 Latin America Sports Hospitality Market Size by Application
- 11.3.1 Latin America Sports Hospitality Market Size by Application (2018-2023)
- 11.3.2 Latin America Sports Hospitality Market Size by Application (2024-2029)
- 11.3.3 Latin America Sports Hospitality Market Share by Application (2018-2029)
- 11.4 Latin America Sports Hospitality Market Size by Country
- 11.4.1 Latin America Sports Hospitality Market Size by Country: 2018 VS 2022 VS 2029
- 11.4.2 Latin America Sports Hospitality Market Size by Country (2018-2023)
- 11.4.3 Latin America Sports Hospitality Market Size by Country (2024-2029)
- 11.4.4 Brazil
- 11.4.5 Mexico
- 11.4.6 Argentina
12 Key Players Profiles
- 12.1 STH Group
- 12.1.1 STH Group Company Details
- 12.1.2 STH Group Business Overview
- 12.1.3 STH Group Sports Hospitality Introduction
- 12.1.4 STH Group Revenue in Sports Hospitality Business (2018-2023)
- 12.2 ATPI Ltd
- 12.2.1 ATPI Ltd Company Details
- 12.2.2 ATPI Ltd Business Overview
- 12.2.3 ATPI Ltd Sports Hospitality Introduction
- 12.2.4 ATPI Ltd Revenue in Sports Hospitality Business (2018-2023)
- 12.3 KNT SPORT
- 12.3.1 KNT SPORT Company Details
- 12.3.2 KNT SPORT Business Overview
- 12.3.3 KNT SPORT Sports Hospitality Introduction
- 12.3.4 KNT SPORT Revenue in Sports Hospitality Business (2018-2023)
- 12.4 CSM Sports and Entertainment
- 12.4.1 CSM Sports and Entertainment Company Details
- 12.4.2 CSM Sports and Entertainment Business Overview
- 12.4.3 CSM Sports and Entertainment Sports Hospitality Introduction
- 12.4.4 CSM Sports and Entertainment Revenue in Sports Hospitality Business (2018-2023)
- 12.5 Byrom plc
- 12.5.1 Byrom plc Company Details
- 12.5.2 Byrom plc Business Overview
- 12.5.3 Byrom plc Sports Hospitality Introduction
- 12.5.4 Byrom plc Revenue in Sports Hospitality Business (2018-2023)
- 12.6 SPORTFIVE
- 12.6.1 SPORTFIVE Company Details
- 12.6.2 SPORTFIVE Business Overview
- 12.6.3 SPORTFIVE Sports Hospitality Introduction
- 12.6.4 SPORTFIVE Revenue in Sports Hospitality Business (2018-2023)
- 12.7 Delaware North
- 12.7.1 Delaware North Company Details
- 12.7.2 Delaware North Business Overview
- 12.7.3 Delaware North Sports Hospitality Introduction
- 12.7.4 Delaware North Revenue in Sports Hospitality Business (2018-2023)
- 12.8 Dorna Sports
- 12.8.1 Dorna Sports Company Details
- 12.8.2 Dorna Sports Business Overview
- 12.8.3 Dorna Sports Sports Hospitality Introduction
- 12.8.4 Dorna Sports Revenue in Sports Hospitality Business (2018-2023)
- 12.9 Gullivers Sports Travel
- 12.9.1 Gullivers Sports Travel Company Details
- 12.9.2 Gullivers Sports Travel Business Overview
- 12.9.3 Gullivers Sports Travel Sports Hospitality Introduction
- 12.9.4 Gullivers Sports Travel Revenue in Sports Hospitality Business (2018-2023)
- 12.10 Compass Group
- 12.10.1 Compass Group Company Details
- 12.10.2 Compass Group Business Overview
- 12.10.3 Compass Group Sports Hospitality Introduction
- 12.10.4 Compass Group Revenue in Sports Hospitality Business (2018-2023)
- 12.11 Shankai Sports
- 12.11.1 Shankai Sports Company Details
- 12.11.2 Shankai Sports Business Overview
- 12.11.3 Shankai Sports Sports Hospitality Introduction
- 12.11.4 Shankai Sports Revenue in Sports Hospitality Business (2018-2023)
- 12.12 Fanatic Sports
- 12.12.1 Fanatic Sports Company Details
- 12.12.2 Fanatic Sports Business Overview
- 12.12.3 Fanatic Sports Sports Hospitality Introduction
- 12.12.4 Fanatic Sports Revenue in Sports Hospitality Business (2018-2023)
- 12.13 Emerald Sports
- 12.13.1 Emerald Sports Company Details
- 12.13.2 Emerald Sports Business Overview
- 12.13.3 Emerald Sports Sports Hospitality Introduction
- 12.13.4 Emerald Sports Revenue in Sports Hospitality Business (2018-2023)
- 12.14 Corinthian Sports
- 12.14.1 Corinthian Sports Company Details
- 12.14.2 Corinthian Sports Business Overview
- 12.14.3 Corinthian Sports Sports Hospitality Introduction
- 12.14.4 Corinthian Sports Revenue in Sports Hospitality Business (2018-2023)
- 12.15 RK Sports Hospitality
- 12.15.1 RK Sports Hospitality Company Details
- 12.15.2 RK Sports Hospitality Business Overview
- 12.15.3 RK Sports Hospitality Sports Hospitality Introduction
- 12.15.4 RK Sports Hospitality Revenue in Sports Hospitality Business (2018-2023)
- 12.16 Eventmasters
- 12.16.1 Eventmasters Company Details
- 12.16.2 Eventmasters Business Overview
- 12.16.3 Eventmasters Sports Hospitality Introduction
- 12.16.4 Eventmasters Revenue in Sports Hospitality Business (2018-2023)
- 12.17 Destination Sport Group
- 12.17.1 Destination Sport Group Company Details
- 12.17.2 Destination Sport Group Business Overview
- 12.17.3 Destination Sport Group Sports Hospitality Introduction
- 12.17.4 Destination Sport Group Revenue in Sports Hospitality Business (2018-2023)
- 12.18 Gala Events
- 12.18.1 Gala Events Company Details
- 12.18.2 Gala Events Business Overview
- 12.18.3 Gala Events Sports Hospitality Introduction
- 12.18.4 Gala Events Revenue in Sports Hospitality Business (2018-2023)
- 12.19 DAIMANI
- 12.19.1 DAIMANI Company Details
- 12.19.2 DAIMANI Business Overview
- 12.19.3 DAIMANI Sports Hospitality Introduction
- 12.19.4 DAIMANI Revenue in Sports Hospitality Business (2018-2023)
13 Analyst's Viewpoints/Conclusions
14 Appendix
- 14.1 Research Methodology
- 14.1.1 Methodology/Research Approach
- 14.1.2 Data Source
- 14.2 Author Details
- 14.3 Disclaimer
