|
|
市場調査レポート
商品コード
1325257
EV向けバスバーの世界市場と日本市場、実績と予測(2023年~2029年)Global and Japan Busbar for EV Market Report, History and Forecast 2023-2029 |
||||||
|
|
|||||||
カスタマイズ可能
適宜更新あり
|
|||||||


| EV向けバスバーの世界市場と日本市場、実績と予測(2023年~2029年) |
|
出版日: 2023年08月09日
発行: QYResearch
ページ情報: 英文 138 Pages
納期: 2~3営業日
|

- 全表示
- 概要
- 図表
- 目次
世界のEV向けバスバーの市場規模は、2022年の11億63万米ドルから2029年までに44億5,618万米ドルに達し、調査期間(2023年~2029年)にCAGRで20.82%の成長が予測されています。
日本の市場規模は、2022年の1,763万米ドルから2029年までに2億4,600万米ドルに達し、予測期間中(2023年~2029年)にCAGRで40.00%の成長が予測されています。
当レポートでは、世界と日本のEV向けバスバー市場について調査分析し、市場規模と予測、地域とセグメントの分析、企業プロファイルなどを提供しています。
目次
第1章 調査範囲
- EV向けバスバー製品のイントロダクション
- 世界のEV向けバスバーの見通し(2018年・2022年・2029年)
- 世界のEV向けバスバーの販売額(2018年~2029年)
- 世界のEV向けバスバーの販売量(2018年~2029年)
- 日本のEV向けバスバーの見通し(2018年・2022年・2029年)
- 日本のEV向けバスバーの販売額(2018年~2029年)
- 日本のEV向けバスバーの販売量(2018年~2029年)
- EV向けバスバーの市場規模、日本 vs. 世界(2018年・2022年・2029年)
- 日本のEV向けバスバーの世界市場シェア(2018年・2022年・2029年)
- EV向けバスバーの市場規模の成長率、日本 vs. 世界(2018年・2022年・2029年)
- EV向けバスバーの市場力学
- EV向けバスバーの業界動向
- EV向けバスバー市場の促進要因
- EV向けバスバー市場の課題
- 前提条件と制限
- 調査目的
- 考慮された年数
第2章 EV向けバスバータイプ別
- EV向けバスバー市場:タイプ別
- 銅バスバー
- アルミニウムバスバー
- 世界のEV向けバスバーの市場規模:タイプ別
- 世界のEV向けバスバーの販売額:タイプ別(2018年・2022年・2029年)
- 世界のEV向けバスバーの販売量:タイプ別(2018年・2022年・2029年)
- 世界のEV向けバスバーの平均販売価格(ASP):タイプ別(2018年・2022年・2029年)
- 日本のEV向けバスバーの市場規模:タイプ別
- 日本のEV向けバスバーの販売額:タイプ別(2018年・2022年・2029年)
- 日本のEV向けバスバーの販売量:タイプ別(2018年・2022年・2029年)
- 日本のEV向けバスバーの平均販売価格(ASP):タイプ別(2018年・2022年・2029年)
第3章 EV向けバスバー:用途別
- EV向けバスバー市場:用途別
- BEV
- PHEV
- 世界のEV向けバスバーの市場規模:用途別
- 世界のEV向けバスバーの販売額:用途別(2018年・2022年・2029年)
- 世界のEV向けバスバーの販売量:用途別(2018年・2022年・2029年)
- 世界のEV向けバスバーの平均販売価格(ASP):用途別(2018年・2022年・2029年)
- 日本のEV向けバスバーの市場規模:用途別
- 日本のEV向けバスバーの販売額:用途別(2018年・2022年・2029年)
- 日本のEV向けバスバーの販売量:用途別(2018年・2022年・2029年)
- 日本のEV向けバスバーの平均販売価格(ASP):用途別(2018年・2022年・2029年)
第4章 世界のEV向けバスバーの競合情勢:企業別
- 世界のEV向けバスバーの市場規模:企業別
- 世界のEV向けバスバーの主要メーカー、収益ランキング(2022年)
- 世界のEV向けバスバーの収益:メーカー別(2019年~2022年)
- 世界のEV向けバスバーの売上:メーカー別(2019年~2022年)
- 世界のEV向けバスバーの価格:メーカー別(2019年~2022年)
- 世界のEV用バスバーの集中度(CR)
- EV向けバスバーの市場集中度(CR)(2019年~2022年)
- 世界のEV向けバスバーの5大メーカー(2022年)
- 世界のEV向けバスバーの10大メーカー(2022年)
- 世界のEV向けバスバーの市場シェア:企業タイプ別(Tier 1、Tier 2、Tier 3)
- 世界のEV向けバスバーの主要メーカー、製造拠点の分布、本社
- 世界のEV向けバスバーの主要メーカー、提供製品
- 世界のEV向けバスバーの主要メーカー、業界参入日
- メーカーの合併・買収、拡張計画
- 日本のEV向けバスバーの市場規模:企業別
- 日本のEV向けバスバーの主要企業、売上ランキング(2022年)
- 日本のEV向けバスバーの収益:企業別(2019年~2022年)
- 日本のEV向けバスバーの売上:メーカー別(2019年~2022年)
第5章 世界のEV向けバスバーの市場規模:地域別
- 世界のEV向けバスバーの市場規模:地域別(2018年・2022年・2029年)
- 世界のEV向けバスバーの市場規模:地域別(2018年~2029年)
- 世界のEV向けバスバーの販売量:地域別(2018年~2023年)
- 世界のEV向けバスバーの販売量の予測:地域別(2023年~2029年)
- 世界のEV向けバスバーの市場規模:地域別(2018年~2029年)
- 世界のEV向けバスバーの販売額:地域別(2018年~2023年)
- 世界のEV向けバスバーの販売額:地域別(2023年~2029年)
第6章 南北アメリカ
- 南北アメリカのEV向けバスバーの市場規模の前年比成長(2018年~2029年)
- 南北アメリカのEV向けバスバーの販売量:タイプ別(2018年・2022年・2029年)
- 南北アメリカのEV向けバスバーの販売量:用途別(2018年・2022年・2029年)
- 南北アメリカのEV向けバスバー市場の事実と数字:国別(2018年・2022年・2029年)
- 南北アメリカのEV向けバスバーの販売額:国別(2018年・2022年・2029年)
- 南北アメリカのEV向けバスバーの販売量:国別(2018年・2022年・2029年)
- 米国
- カナダ
- メキシコ
- ブラジル
第7章 欧州・中東・アフリカ
- 欧州・中東・アフリカのEV向けバスバーの市場規模の前年比成長(2018年~2029年)
- 欧州・中東・アフリカのEV向けバスバーの販売量:タイプ別(2018年・2022年・2029年)
- 欧州・中東・アフリカのEV向けバスバーの販売量:用途別(2018年・2022年・2029年)
- 欧州・中東・アフリカのEV向けバスバー市場の事実と数字:国別(2018年・2022年・2029年)
- 欧州・中東・アフリカのEV向けバスバーの販売額:国別(2018年・2022年・2029年)
- 欧州・中東・アフリカのEV向けバスバーの販売量:国別(2018年・2022年・2029年)
- 欧州
- 中東
- アフリカ
第8章 中国
- 中国のEV向けバスバーの市場規模の前年比成長(2018年~2029年)
- 中国のEV向けバスバーの販売量:タイプ別(2018年・2022年・2029年)
- 中国のEV向けバスバーの販売量:用途別(2018年・2022年・2029年)
第9章 アジア太平洋
- アジア太平洋のEV向けバスバーの市場規模の前年比成長(2018年~2029年)
- アジア太平洋のEV向けバスバーの販売量:タイプ別(2018年・2022年・2029年)
- アジア太平洋のEV向けバスバーの販売量:用途別(2018年・2022年・2029年)
- アジア太平洋のEV向けバスバー市場の事実と数字:国別(2018年・2022年・2029年)
- アジア太平洋のEV向けバスバーの販売額:国別(2018年・2022年・2029年)
- アジア太平洋のEV向けバスバーの販売量:国別(2018年・2022年・2029年)
- 日本
- 韓国
- インド
- 東南アジア
第10章 企業プロファイル
- Intercable Automotive Solutions (Aptiv)
- Everwin Technology
- BSB Technology Development
- Methode Electronics
- Rogers Corporation
- Auto-Kabel
- Suncall
- Iwis e-tec
- Mersen
- RHI ELectric
- Connor Manufacturing Services
- Jenkent Electric Technology
- Interplex
- Crefact
第11章 産業チェーンと販売チャネルの分析
- EV向けバスバーの産業チェーン分析
- EV向けバスバーの主な原材料
- 主な原材料
- 原材料の主要サプライヤー
- EV向けの製造コスト構造分析
- EV向けバスバーの販売とマーケティング
- EV向けバスバーの販売チャネル
- EV向けバスバーの販売業者
- EV向けバスバーの顧客
第12章 調査結果と結論
第13章 付録
List of Tables
- Table 1. Busbar for EV CAGR in Value, Japan VS Global, 2018 VS 2022 VS 2029
- Table 2. Busbar for EV Market Trends
- Table 3. Busbar for EV Market Drivers
- Table 4. Busbar for EV Market Challenges
- Table 5. Major Players of Copper Busbars
- Table 6. Major Players of Aluminium Busbars
- Table 7. Global Busbar for EV Sales Growth Rate (CAGR) by Type: 2018 VS 2022 VS 2029 (US$ Million)
- Table 8. Japan Busbar for EV Sales Growth Rate (CAGR) by Type: 2018 VS 2022 VS 2029 (US$ Million)
- Table 9. Global Busbar for EV Sales Growth Rate (CAGR) by Application: 2018 VS 2022 VS 2029 (US$ Million)
- Table 10. Japan Busbar for EV Sales Growth Rate (CAGR) by Application: 2018 VS 2022 VS 2029 (US$ Million)
- Table 11. Global Key Manufacturers of Busbar for EV, Ranked by Revenue (2022) & (US$ Million)
- Table 12. Global Busbar for EV Revenue by Manufacturer, (US$ Million) & (2019-2022)
- Table 13. Global Busbar for EV Revenue Share by Manufacturer, 2019-2022
- Table 14. Global Busbar for EV Sales by Manufacturer, (M Units), 2019-2022
- Table 15. Global Busbar for EV Sales Share by Manufacturer, 2019-2022
- Table 16. Global Busbar for EV Price by Manufacturer (2019-2022) & (US$/Unit)
- Table 17. Global Busbar for EV Manufacturers Market Concentration Ratio (CR5)
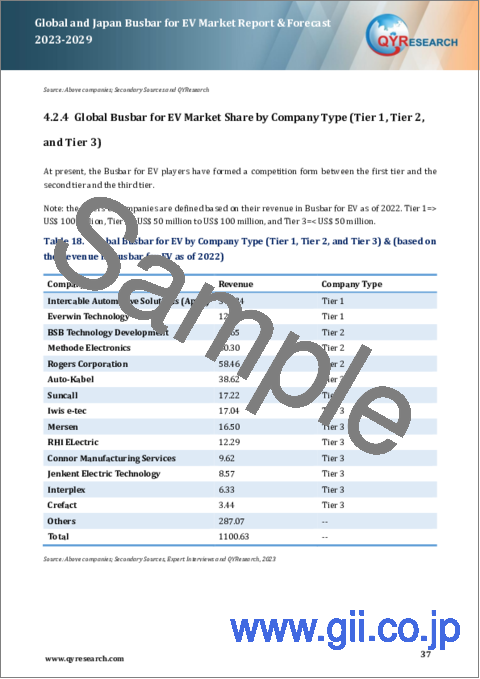
- Table 18. Global Busbar for EV by Company Type (Tier 1, Tier 2, and Tier 3) & (based on the Revenue in Busbar for EV as of 2022)
- Table 19. Global Key Manufacturers of Busbar for EV, Manufacturing Base Distribution and Headquarters
- Table 20. Global Key Manufacturers of Busbar for EV, Product Offered
- Table 21. Global Key Manufacturers of Busbar for EV, Date of Enter into This Industry
- Table 22. Manufacturers Mergers & Acquisitions, Expansion Plans
- Table 23. Key Players of Busbar for EV in Japan, Ranked by Revenue (2022) & (US$ million)
- Table 24. Japan Busbar for EV Revenue by Players, (US$ Million) & (2019-2022)
- Table 25. Japan Busbar for EV Revenue Share by Players, (2019-2022)
- Table 26. Japan Busbar for EV Sales by Players, (M Units) & (2019-2022)
- Table 27. Japan Busbar for EV Sales Share by Players, (2019-2022)
- Table 28. Global Busbar for EV Market Size Growth Rate (CAGR) by Region (US$ Million): 2018 VS 2022 VS 2029
- Table 29. Global Busbar for EV Sales in Volume by Region (2018-2023) & (M Units)
- Table 30. Global Busbar for EV Sales in Volume Forecast by Region (2023-2029) & (M Units)
- Table 31. Global Busbar for EV Sales in Value by Region (2018-2023) & (US$ Million)
- Table 32. Global Busbar for EV Sales in Value Forecast by Region (2023-2029) & (US$ Million)
- Table 33. Americas Busbar for EV Market Size Growth Rate (CAGR) by Country (US$ Million): 2018 VS 2022 VS 2029
- Table 34. Americas Busbar for EV Sales in Value by Country (2018-2023) & (US$ Million)
- Table 35. Americas Busbar for EV Sales in Value by Country (2024-2029) & (US$ Million)
- Table 36. Americas Busbar for EV Sales in Volume by Country (2018-2023) & (M Units)
- Table 37. Americas Busbar for EV Sales in Volume by Country (2024-2029) & (M Units)
- Table 38. EMEA Busbar for EV Market Size Growth Rate (CAGR) by Country (US$ Million): 2018 VS 2022 VS 2029
- Table 39. EMEA Busbar for EV Sales in Value by Country (2018-2023) & (US$ Million)
- Table 40. EMEA Busbar for EV Sales in Value by Country (2024-2029) & (US$ Million)
- Table 41. EMEA Busbar for EV Sales in Volume by Country (2018-2023) & (M Units)
- Table 42. EMEA Busbar for EV Sales in Volume by Country (2024-2029) & (M Units)
- Table 43. APAC Busbar for EV Market Size Growth Rate (CAGR) by Country (US$ Million): 2018 VS 2022 VS 2029
- Table 44. APAC Busbar for EV Sales in Value by Country (2018-2023) & (US$ Million)
- Table 45. APAC Busbar for EV Sales in Value by Country (2024-2029) & (US$ Million)
- Table 46. APAC Busbar for EV Sales in Volume by Country (2018-2023) & (M Units)
- Table 47. APAC Busbar for EV Sales in Volume by Country (2024-2029) & (M Units)
- Table 48. Intercable Automotive Solutions (Aptiv) Company Information
- Table 49. Intercable Automotive Solutions (Aptiv) Description and Business Overview
- Table 50. Intercable Automotive Solutions (Aptiv) Busbar for EV Sales (M Units), Revenue (US$ Million), Price (US$/Unit) and Gross Margin (2019-2022)
- Table 51. Intercable Automotive Solutions (Aptiv) Busbar for EV Product
- Table 52. Everwin Technology Company Information
- Table 53. Everwin Technology Description and Business Overview
- Table 54. Everwin Technology Busbar for EV Sales (M Units), Revenue (US$ Million), Price (US$/Unit) and Gross Margin (2019-2022)
- Table 55. Everwin Technology Busbar for EV Product
- Table 56. BSB Technology Development Company Information
- Table 57. BSB Technology Development Description and Business Overview
- Table 58. BSB Technology Development Busbar for EV Sales (M Units), Revenue (US$ Million), Price (US$/Unit) and Gross Margin (2019-2022)
- Table 59. BSB Technology Development Busbar for EV Product
- Table 60. Methode Electronics Company Information
- Table 61. Methode Electronics Description and Business Overview
- Table 62. Methode Electronics Busbar for EV Sales (M Units), Revenue (US$ Million), Price (US$/Unit) and Gross Margin (2019-2022)
- Table 63. Methode Electronics Busbar for EV Product
- Table 64. Rogers Corporation Company Information
- Table 65. Rogers Corporation Description and Business Overview
- Table 66. Rogers Corporation Busbar for EV Sales (M Units), Revenue (US$ Million), Price (US$/Unit) and Gross Margin (2019-2022)
- Table 67. Rogers Corporation Busbar for EV Product
- Table 68. Auto-Kabel Company Information
- Table 69. Auto-Kabel Description and Business Overview
- Table 70. Auto-Kabel Busbar for EV Sales (M Units), Revenue (US$ Million), Price (US$/Unit) and Gross Margin (2019-2022)
- Table 71. Auto-Kabel Busbar for EV Product
- Table 72. Suncall Company Information
- Table 73. Suncall Description and Business Overview
- Table 74. Suncall Busbar for EV Sales (M Units), Revenue (US$ Million), Price (US$/Unit) and Gross Margin (2019-2022)
- Table 75. Suncall Busbar for EV Product
- Table 76. Iwis e-tec Company Information
- Table 77. Iwis e-tec Description and Business Overview
- Table 78. Iwis e-tec Busbar for EV Sales (M Units), Revenue (US$ Million), Price (US$/Unit) and Gross Margin (2019-2022)
- Table 79. Iwis e-tec Busbar for EV Product
- Table 80. Mersen Company Information
- Table 81. Mersen Description and Business Overview
- Table 82. Mersen Busbar for EV Sales (M Units), Revenue (US$ Million), Price (US$/Unit) and Gross Margin (2019-2022)
- Table 83. Mersen Busbar for EV Product
- Table 84. RHI ELectric Company Information
- Table 85. RHI ELectric Description and Business Overview
- Table 86. RHI ELectric Busbar for EV Sales (M Units), Revenue (US$ Million), Price (US$/Unit) and Gross Margin (2019-2022)
- Table 87. RHI ELectric Busbar for EV Product
- Table 88. Connor Manufacturing Services Company Information
- Table 89. Connor Manufacturing Services Description and Business Overview
- Table 90. Connor Manufacturing Services Busbar for EV Sales (M Units), Revenue (US$ Million), Price (US$/Unit) and Gross Margin (2019-2022)
- Table 91. Connor Manufacturing Services Busbar for EV Product
- Table 92. Jenkent Electric Technology Company Information
- Table 93. Jenkent Electric Technology Description and Business Overview
- Table 94. Jenkent Electric Technology Busbar for EV Sales (M Units), Revenue (US$ Million), Price (US$/Unit) and Gross Margin (2019-2022)
- Table 95. Jenkent Electric Technology Busbar for EV Product
- Table 96. Interplex Company Information
- Table 97. Interplex Description and Business Overview
- Table 98. Interplex Busbar for EV Sales (M Units), Revenue (US$ Million), Price (US$/Unit) and Gross Margin (2019-2022)
- Table 99. Interplex Busbar for EV Product
- Table 100. Crefact Company Information
- Table 101. Crefact Description and Business Overview
- Table 102. Crefact Busbar for EV Sales (M Units), Revenue (US$ Million), Price (US$/Unit) and Gross Margin (2019-2022)
- Table 103. Crefact Busbar for EV Product
- Table 104. Key Raw Materials Lists
- Table 105. Raw Materials Key Suppliers Lists
- Table 106. Busbar for EV Distributors List
- Table 107. Busbar for EV Customers List
- Table 108. Research Programs/Design for This Report
- Table 109. Key Data Information from Secondary Sources
- Table 110. Key Data Information from Primary Sources
- Table 111. QYR Business Unit and Senior & Team Lead Analysts
List of Figures
- Figure 1. Busbar for EV Product Picture
- Figure 2. Global Busbar for EV Revenue, (US$ Million), 2018 VS 2022 VS 2029
- Figure 3. Global Busbar for EV Market Size 2018-2029 (US$ Million)
- Figure 4. Global Busbar for EV Sales 2018-2029 (M Units)
- Figure 5. Japan Busbar for EV Revenue, (US$ Million), 2018 VS 2022 VS 2029
- Figure 6. Japan Busbar for EV Market Size 2018-2029 (US$ Million)
- Figure 7. Japan Busbar for EV Sales 2018-2029 (M Units)
- Figure 8. Japan Busbar for EV Market Share in Global, in Value (US$ Million) 2018-2029
- Figure 9. Japan Busbar for EV Market Share in Global, in Volume (M Units) 2018-2029
- Figure 10. Busbar for EV Report Years Considered
- Figure 11. Product Picture of Copper Busbars
- Figure 12. Product Picture of Aluminium Busbars
- Figure 13. Global Busbar for EV Market Share by Type in 2022 & 2029
- Figure 14. Global Busbar for EV Sales in Value by Type (2018-2029) & (US$ Million)
- Figure 15. Global Busbar for EV Sales Market Share in Value by Type (2018-2029)
- Figure 16. Global Busbar for EV Sales by Type (2018-2029) & (M Units)
- Figure 17. Global Busbar for EV Sales Market Share in Volume by Type (2018-2029)
- Figure 18. Global Busbar for EV Price by Type (2018-2029) & (US$/Unit)
- Figure 19. Japan Busbar for EV Market Share by Type in 2022 & 2029
- Figure 20. Japan Busbar for EV Sales in Value by Type (2018-2029) & (US$ Million)
- Figure 21. Japan Busbar for EV Sales Market Share in Value by Type (2018-2029)
- Figure 22. Japan Busbar for EV Sales by Type (2018-2029) & (M Units)
- Figure 23. Japan Busbar for EV Sales Market Share in Volume by Type (2018-2029)
- Figure 24. Japan Busbar for EV Price by Type (2018-2029) & (US$/Unit)
- Figure 25. Product Picture of BEV
- Figure 26. Product Picture of PHEV
- Figure 27. Global Busbar for EV Market Share by Application in 2022 & 2029
- Figure 28. Global Busbar for EV Sales in Value by Application (2018-2029) & (US$ Million)
- Figure 29. Global Busbar for EV Sales Market Share in Value by Application (2018-2029)
- Figure 30. Global Busbar for EV Sales by Application (2018-2029) & (M Units)
- Figure 31. Global Busbar for EV Sales Market Share in Volume by Application (2018-2029)
- Figure 32. Global Busbar for EV Price by Application (2018-2029) & (US$/Unit)
- Figure 33. Japan Busbar for EV Market Share by Application in 2022 & 2029
- Figure 34. Japan Busbar for EV Sales in Value by Application (2018-2029) & (US$ Million)
- Figure 35. Japan Busbar for EV Sales Market Share in Value by Application (2018-2029)
- Figure 36. Japan Busbar for EV Sales by Application (2018-2029) & (M Units)
- Figure 37. Japan Busbar for EV Sales Market Share in Volume by Application (2018-2029)
- Figure 38. Japan Busbar for EV Price by Application (2018-2029) & (US$/Unit)
- Figure 39. The Top 5 Largest Manufacturers of Busbar for EV in the World: Market Share by Busbar for EV Revenue in 2022
- Figure 40. The 10 Largest Manufacturers of Busbar for EV in the World: Market Share by Busbar for EV Revenue in 2022
- Figure 41. Global Busbar for EV Market Size Market Share by Region: 2018 VS 2022
- Figure 42. Global Busbar for EV Sales in Volume Market Share by Region (2018-2029)
- Figure 43. Global Busbar for EV Sales in Value Market Share by Region (2018-2029)
- Figure 44. Americas Busbar for EV Sales in Volume Growth Rate 2018-2029 (M Units)
- Figure 45. Americas Busbar for EV Sales in Value Growth Rate 2018-2029 (US$ Million)
- Figure 46. Americas Busbar for EV Sales by Type (2018-2029) & (M Units)
- Figure 47. Americas Busbar for EV Sales Market Share in Volume by Type (2018-2029)
- Figure 48. Americas Busbar for EV Sales by Application (2018-2029) & (M Units)
- Figure 49. Americas Busbar for EV Sales Market Share in Volume by Application (2018-2029)
- Figure 50. United States Busbar for EV Sales in Value Growth Rate (2018-2029) & (US$ Million)
- Figure 51. Canada Busbar for EV Sales in Value Growth Rate (2018-2029) & (US$ Million)
- Figure 52. Mexico Busbar for EV Sales in Value Growth Rate (2018-2029) & (US$ Million)
- Figure 53. Brazil Busbar for EV Sales in Value Growth Rate (2018-2029) & (US$ Million)
- Figure 54. EMEA Busbar for EV Sales in Volume Growth Rate 2018-2029 (M Units)
- Figure 55. EMEA Busbar for EV Sales in Value Growth Rate 2018-2029 (US$ Million)
- Figure 56. EMEA Busbar for EV Sales by Type (2018-2029) & (M Units)
- Figure 57. EMEA Busbar for EV Sales Market Share in Volume by Type (2018-2029)
- Figure 58. EMEA Busbar for EV Sales by Application (2018-2029) & (M Units)
- Figure 59. EMEA Busbar for EV Sales Market Share in Volume by Application (2018-2029)
- Figure 60. Europe Busbar for EV Sales in Value Growth Rate (2018-2029) & (US$ Million)
- Figure 61. Middle East Busbar for EV Sales in Value Growth Rate (2018-2029) & (US$ Million)
- Figure 62. Africa Busbar for EV Sales in Value Growth Rate (2018-2029) & (US$ Million)
- Figure 63. China Busbar for EV Sales in Volume Growth Rate 2018-2029 (M Units)
- Figure 64. China Busbar for EV Sales in Value Growth Rate 2018-2029 (US$ Million)
- Figure 65. China Busbar for EV Sales by Type (2018-2029) & (M Units)
- Figure 66. China Busbar for EV Sales Market Share in Volume by Type (2018-2029)
- Figure 67. China Busbar for EV Sales by Application (2018-2029) & (M Units)
- Figure 68. China Busbar for EV Sales Market Share in Volume by Application (2018-2029)
- Figure 69. APAC Busbar for EV Sales in Volume Growth Rate 2018-2029 (M Units)
- Figure 70. APAC Busbar for EV Sales in Value Growth Rate 2018-2029 (US$ Million)
- Figure 71. APAC Busbar for EV Sales by Type (2018-2029) & (M Units)
- Figure 72. APAC Busbar for EV Sales Market Share in Volume by Type (2018-2029)
- Figure 73. APAC Busbar for EV Sales by Application (2018-2029) & (M Units)
- Figure 74. APAC Busbar for EV Sales Market Share in Volume by Application (2018-2029)
- Figure 75. Japan Busbar for EV Sales in Value Growth Rate (2018-2029) & (US$ Million)
- Figure 76. South Korea Busbar for EV Sales in Value Growth Rate (2018-2029) & (US$ Million)
- Figure 77. India Busbar for EV Sales in Value Growth Rate (2018-2029) & (US$ Million)
- Figure 78. Southeast Asia Busbar for EV Sales in Value Growth Rate (2018-2029) & (US$ Million)
- Figure 79. Busbar for EV Value Chain
- Figure 80. Manufacturing Cost Structure Analysis of Electric Vehicle Busbars in 2022
- Figure 81. Channels of Distribution
- Figure 82. Distributors Profiles
- Figure 83. Bottom-up and Top-down Approaches for This Report
- Figure 84. Data Triangulation
- Figure 85. Key Executives Interviewed
Market Analysis and Insights:
This report focuses on global and Japan Busbar for EV market, also covers the segmentation data of other regions in regional level and county level.
The global Busbar for EV revenue was US$ 1,100.63 million in 2022 and is forecast to a readjusted size of US$ 4,456.18 million by 2029 with a CAGR of 20.82% during the review period (2023-2029).
In Japan the Busbar for EV revenue is expected to grow from US$ 17.63 million in 2022 to US$ 246.00 million by 2029, at a CAGR of 40.00% during the forecast period (2023-2029).
The global key players of Busbar for EV include: Intercable Automotive Solutions (Aptiv), Everwin Technology, BSB Technology Development, Methode Electronics, Rogers Corporation, Auto-Kabel, Suncall, Iwis e-tec, and Mersen, etc. The global five biggest players hold a share of 62.14% in 2022.
Scope and Market Size:
Busbar for EV market is segmented in regional and country level, by players, by Type, and by Application. Companies, stakeholders, and other participants in the global Busbar for EV market will be able to gain the upper hand as they use the report as a powerful resource. The segmental analysis focuses on sales, revenue and forecast by Type and by Application for the period 2018-2029.
For Japan market, this report focuses on the Busbar for EV market size by players, by Type, and by Application, for the period 2018-2029. The key players include the global and local players which play important roles in Japan.
By Company
- Intercable Automotive Solutions (Aptiv)
- Everwin Technology
- BSB Technology Development
- Methode Electronics
- Rogers Corporation
- Auto-Kabel
- Suncall
- Iwis e-tec
- Mersen
- RHI ELectric
- Connor Manufacturing Services
- Jenkent Electric Technology
- Interplex
- Crefact
Segment by Type
- Copper Busbars
- Aluminium Busbars
Segment by Application
- BEV
- PHEV
By Region
- Americas
- United States
- Canada
- Mexico
- Brazil
- China
- APAC (excluding China)
- Japan
- South Korea
- ASEAN
- India
- EMEA
- Europe
- Middle East
- Africa
Chapter Introduction
- Chapter 1: Introduces Busbar for EV definition, global sales (volume and revenue), Japan market size, Japan percentage in global market. This section also introduces the market dynamics, latest developments of the market, the driving factors and restrictive factors of the market, the challenges and risks faced by companies in the industry, and the analysis of relevant policies in the industry.
- Chapter 2: Provides the analysis of various market segments by Type, covering the volume, price, revenue, and development potential of each market segment, to help readers find the blue ocean market in different market segments.
- Chapter 3: Provides the analysis of various market segments by Application, covering the revenue, price, volume, and development potential of each market segment, to help readers find the blue ocean market in different downstream markets.
- Chapter 4: Detailed analysis of Busbar for EV companies' competitive landscape, revenue, market share and industry ranking, latest development plan, merger, and acquisition information, etc.
- Chapter 5: Revenue and volume of Busbar for EV in global and regional level. It provides a quantitative analysis of the market size and development potential of each region and introduces the market development, future development prospects, market space, and capacity of each country in the world.
- Chapter 6: Americas by Type, by Application and by country, sales, and revenue for each segment.
- Chapter 7: EMEA by Type, by Application and by region, sales, and revenue for each segment.
- Chapter 8: China by Type, and by Application, sales, and revenue for each segment.
- Chapter 9: APAC (excluding China) by Type, by Application and by region, sales, and revenue for each segment.
- Chapter 10: Provides profiles of key companies, introducing the basic situation of the main companies in the market in detail, including product descriptions and specifications, Busbar for EV sales, revenue, gross margin, and recent development, etc.
- Chapter 11: Analysis of industrial chain, sales channel, key raw materials, distributors, and customers.
- Chapter 12: research findings and conclusion
Table of Contents
1 Study Coverage
- 1.1 Busbar for EV Product Introduction
- 1.2 Global Busbar for EV Outlook 2018 VS 2022 VS 2029
- 1.2.1 Global Busbar for EV Sales in US$ Million for the Year 2018-2029
- 1.2.2 Global Busbar for EV Sales in Volume for the Year 2018-2029
- 1.3 Japan Busbar for EV Outlook 2018 VS 2022 VS 2029
- 1.3.1 Japan Busbar for EV Sales in US$ Million for the Year 2018-2029
- 1.3.2 Japan Busbar for EV Sales in Volume for the Year 2018-2029
- 1.4 Busbar for EV Market Size, Japan VS Global, 2018 VS 2022 VS 2029
- 1.4.1 The Market Share of Japan Busbar for EV in Global, 2018 VS 2022 VS 2029
- 1.4.2 The Growth Rate of Busbar for EV Market Size, Japan VS Global, 2018 VS 2022 VS 2029
- 1.5 Busbar for EV Market Dynamics
- 1.5.1 Busbar for EV Industry Trends
- 1.5.2 Busbar for EV Market Drivers
- 1.5.3 Busbar for EV Market Challenges
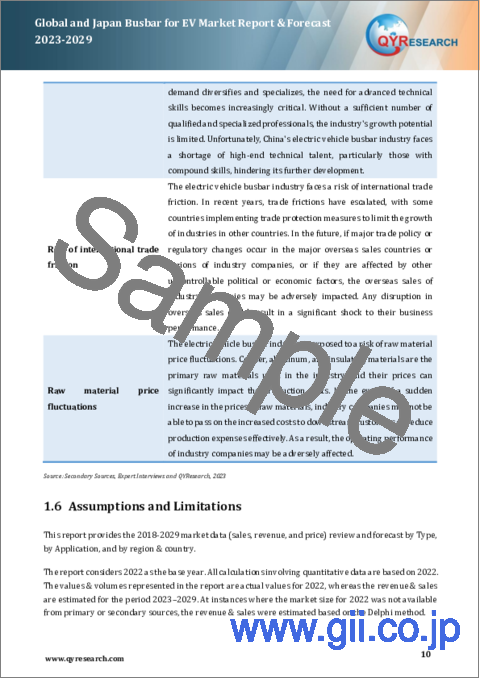
- 1.6 Assumptions and Limitations
- 1.7 Study Objectives
- 1.8 Years Considered
2 Busbar for EV by Type
- 2.1 Busbar for EV Market by Type
- 2.1.1 Copper Busbars
- 2.1.2 Aluminium Busbars
- 2.2 Global Busbar for EV Market Size by Type
- 2.2.1 Global Busbar for EV Sales in Value, by Type (2018, 2022 & 2029)
- 2.2.2 Global Busbar for EV Sales in Volume, by Type (2018, 2022 & 2029)
- 2.2.3 Global Busbar for EV Average Selling Price (ASP) by Type (2018, 2022 & 2029)
- 2.3 Japan Busbar for EV Market Size by Type
- 2.3.1 Japan Busbar for EV Sales in Value, by Type (2018, 2022 & 2029)
- 2.3.2 Japan Busbar for EV Sales in Volume, by Type (2018, 2022 & 2029)
- 2.3.3 Japan Busbar for EV Average Selling Price (ASP) by Type (2018, 2022 & 2029)
3 Busbar for EV by Application
- 3.1 Busbar for EV Market by Application
- 3.1.1 BEV
- 3.1.2 PHEV
- 3.2 Global Busbar for EV Market Size by Application
- 3.2.1 Global Busbar for EV Sales in Value, by Application (2018, 2022 & 2029)
- 3.2.2 Global Busbar for EV Sales in Volume, by Application (2018, 2022 & 2029)
- 3.2.3 Global Busbar for EV Average Selling Price (ASP) by Application (2018, 2022 & 2029)
- 3.3 Japan Busbar for EV Market Size by Application
- 3.3.1 Japan Busbar for EV Sales in Value, by Application (2018, 2022 & 2029)
- 3.3.2 Japan Busbar for EV Sales in Volume, by Application (2018, 2022 & 2029)
- 3.3.3 Japan Busbar for EV Average Selling Price (ASP) by Application (2018, 2022 & 2029)
4 Global Busbar for EV Competitor Landscape by Company
- 4.1 Global Busbar for EV Market Size by Company
- 4.1.1 Global Key Manufacturers of Busbar for EV, Ranked by Revenue (2022)
- 4.1.2 Global Busbar for EV Revenue by Manufacturer (2019-2022)
- 4.1.3 Global Busbar for EV Sales by Manufacturer (2019-2022)
- 4.1.4 Global Busbar for EV Price by Manufacturer (2019-2022)
- 4.2 Global Busbar for EV Concentration Ratio (CR)
- 4.2.1 Busbar for EV Market Concentration Ratio (CR) (2019-2022)
- 4.2.2 Global Top 5 Largest Manufacturers of Busbar for EV in 2022
- 4.2.3 Global Top 10 Largest Manufacturers of Busbar for EV in 2022
- 4.2.4 Global Busbar for EV Market Share by Company Type (Tier 1, Tier 2, and Tier 3)
- 4.3 Global Key Manufacturers of Busbar for EV, Manufacturing Base Distribution and Headquarters
- 4.4 Global Key Manufacturers of Busbar for EV, Product Offered
- 4.5 Global Key Manufacturers of Busbar for EV, Date of Enter into This Industry
- 4.6 Manufacturers Mergers & Acquisitions, Expansion Plans
- 4.7 Japan Busbar for EV Market Size by Company
- 4.7.1 Key Players of Busbar for EV in Japan, Ranked by Revenue (2022)
- 4.7.2 Japan Busbar for EV Revenue by Players (2019-2022)
- 4.7.3 Japan Busbar for EV Sales by Players (2019-2022)
5 Global Busbar for EV Market Size by Region
- 5.1 Global Busbar for EV Market Size by Region: 2018 VS 2022 VS 2029
- 5.2 Global Busbar for EV Market Size in Volume by Region (2018-2029)
- 5.2.1 Global Busbar for EV Sales in Volume by Region: 2018-2023
- 5.2.2 Global Busbar for EV Sales in Volume Forecast by Region (2023-2029)
- 5.3 Global Busbar for EV Market Size in Value by Region (2018-2029)
- 5.3.1 Global Busbar for EV Sales in Value by Region: 2018-2023
- 5.3.2 Global Busbar for EV Sales in Value by Region: 2023-2029
6 Americas
- 6.1 Americas Busbar for EV Market Size YoY Growth 2018-2029
- 6.2 Americas Busbar for EV Sales in Volume, by Type (2018, 2022 & 2029)
- 6.3 Americas Busbar for EV Sales in Volume, by Application (2018, 2022 & 2029)
- 6.4 Americas Busbar for EV Market Facts & Figures by Country (2018, 2022 & 2029)
- 6.4.1 Americas Busbar for EV Sales in Value by Country (2018, 2022 & 2029)
- 6.4.2 Americas Busbar for EV Sales in Volume by Country (2018, 2022 & 2029)
- 6.4.3 United States
- 6.4.4 Canada
- 6.4.5 Mexico
- 6.4.6 Brazil
7 EMEA
- 7.1 EMEA Busbar for EV Market Size YoY Growth 2018-2029
- 7.2 EMEA Busbar for EV Sales in Volume, by Type (2018, 2022 & 2029)
- 7.3 EMEA Busbar for EV Sales in Volume, by Application (2018, 2022 & 2029)
- 7.4 EMEA Busbar for EV Market Facts & Figures by Country (2018, 2022 & 2029)
- 7.4.1 EMEA Busbar for EV Sales in Value by Country (2018, 2022 & 2029)
- 7.4.2 EMEA Busbar for EV Sales in Volume by Country (2018, 2022 & 2029)
- 7.4.3 Europe
- 7.4.4 Middle East
- 7.4.5 Africa
8 China
- 8.1 China Busbar for EV Market Size YoY Growth 2018-2029
- 8.2 China Busbar for EV Sales in Volume, by Type (2018, 2022 & 2029)
- 8.3 China Busbar for EV Sales in Volume, by Application (2018, 2022 & 2029)
9 APAC
- 9.1 APAC Busbar for EV Market Size YoY Growth 2018-2029
- 9.2 APAC Busbar for EV Sales in Volume, by Type (2018, 2022 & 2029)
- 9.3 APAC Busbar for EV Sales in Volume, by Application (2018, 2022 & 2029)
- 9.4 APAC Busbar for EV Market Facts & Figures by Country (2018, 2022 & 2029)
- 9.4.1 APAC Busbar for EV Sales in Value by Country (2018, 2022 & 2029)
- 9.4.2 APAC Busbar for EV Sales in Volume by Country (2018, 2022 & 2029)
- 9.4.3 Japan
- 9.4.4 South Korea
- 9.4.5 India
- 9.4.6 Southeast Asia
10 Company Profiles
- 10.1 Intercable Automotive Solutions (Aptiv)
- 10.1.1 Intercable Automotive Solutions (Aptiv) Company Information
- 10.1.2 Intercable Automotive Solutions (Aptiv) Description and Business Overview
- 10.1.3 Intercable Automotive Solutions (Aptiv) Busbar for EV Sales, Revenue and Gross Margin (2019-2022)
- 10.1.4 Intercable Automotive Solutions (Aptiv) Busbar for EV Products Offered
- 10.2 Everwin Technology
- 10.2.1 Everwin Technology Company Information
- 10.2.2 Everwin Technology Description and Business Overview
- 10.2.3 Everwin Technology Busbar for EV Sales, Revenue and Gross Margin (2019-2022)
- 10.2.4 Everwin Technology Busbar for EV Products Offered
- 10.3 BSB Technology Development
- 10.3.1 BSB Technology Development Company Information
- 10.3.2 BSB Technology Development Description and Business Overview
- 10.3.3 BSB Technology Development Busbar for EV Sales, Revenue and Gross Margin (2019-2022)
- 10.3.4 BSB Technology Development Busbar for EV Products Offered
- 10.4 Methode Electronics
- 10.4.1 Methode Electronics Company Information
- 10.4.2 Methode Electronics Description and Business Overview
- 10.4.3 Methode Electronics Busbar for EV Sales, Revenue and Gross Margin (2019-2022)
- 10.4.4 Methode Electronics Busbar for EV Products Offered
- 10.5 Rogers Corporation
- 10.5.1 Rogers Corporation Company Information
- 10.5.2 Rogers Corporation Description and Business Overview
- 10.5.3 Rogers Corporation Busbar for EV Sales, Revenue and Gross Margin (2019-2022)
- 10.5.4 Rogers Corporation Busbar for EV Products Offered
- 10.6 Auto-Kabel
- 10.6.1 Auto-Kabel Company Information
- 10.6.2 Auto-Kabel Description and Business Overview
- 10.6.3 Auto-Kabel Busbar for EV Sales, Revenue and Gross Margin (2019-2022)
- 10.6.4 Auto-Kabel Busbar for EV Products Offered
- 10.7 Suncall
- 10.7.1 Suncall Company Information
- 10.7.2 Suncall Description and Business Overview
- 10.7.3 Suncall Busbar for EV Sales, Revenue and Gross Margin (2019-2022)
- 10.7.4 Suncall Busbar for EV Products Offered
- 10.8 Iwis e-tec
- 10.8.1 Iwis e-tec Company Information
- 10.8.2 Iwis e-tec Description and Business Overview
- 10.8.3 Iwis e-tec Busbar for EV Sales, Revenue and Gross Margin (2019-2022)
- 10.8.4 Iwis e-tec Busbar for EV Products Offered
- 10.9 Mersen
- 10.9.1 Mersen Company Information
- 10.9.2 Mersen Description and Business Overview
- 10.9.3 Mersen Busbar for EV Sales, Revenue and Gross Margin (2019-2022)
- 10.9.4 Mersen Busbar for EV Products Offered
- 10.10 RHI ELectric
- 10.10.1 RHI ELectric Company Information
- 10.10.2 RHI ELectric Description and Business Overview
- 10.10.3 RHI ELectric Busbar for EV Sales, Revenue and Gross Margin (2019-2022)
- 10.10.4 RHI ELectric Busbar for EV Products Offered
- 10.11 Connor Manufacturing Services
- 10.11.1 Connor Manufacturing Services Company Information
- 10.11.2 Connor Manufacturing Services Description and Business Overview
- 10.11.3 Connor Manufacturing Services Busbar for EV Sales, Revenue and Gross Margin (2019-2022)
- 10.11.4 Connor Manufacturing Services Busbar for EV Products Offered
- 10.12 Jenkent Electric Technology
- 10.12.1 Jenkent Electric Technology Company Information
- 10.12.2 Jenkent Electric Technology Description and Business Overview
- 10.12.3 Jenkent Electric Technology Busbar for EV Sales, Revenue and Gross Margin (2019-2022)
- 10.12.4 Jenkent Electric Technology Busbar for EV Products Offered
- 10.13 Interplex
- 10.13.1 Interplex Company Information
- 10.13.2 Interplex Description and Business Overview
- 10.13.3 Interplex Busbar for EV Sales, Revenue and Gross Margin (2019-2022)
- 10.13.4 Interplex Busbar for EV Products Offered
- 10.14 Crefact
- 10.14.1 Crefact Company Information
- 10.14.2 Crefact Description and Business Overview
- 10.14.3 Crefact Busbar for EV Sales, Revenue and Gross Margin (2019-2022)
- 10.14.4 Crefact Busbar for EV Products Offered
11 Industry Chain and Sales Channels Analysis
- 11.1 Busbar for EV Industry Chain Analysis
- 11.2 Busbar for EV Key Raw Materials
- 11.2.1 Key Raw Materials
- 11.2.2 Raw Materials Key Suppliers
- 11.3 Manufacturing Cost Structure Analysis of Electric Vehicle Busbars
- 11.4 Busbar for EV Sales and Marketing
- 11.4.1 Busbar for EV Sales Channels
- 11.4.2 Busbar for EV Distributors
- 11.5 Busbar for EV Customers
12 Research Findings and Conclusion
13 Appendix
- 13.1 Research Methodology
- 13.1.1 Methodology/Research Approach
- 13.1.2 Data Source
- 13.2 Author Details
- 13.3 Disclaimer
