|
|
市場調査レポート
商品コード
1297995
ライフサイエンスおよび化学計測機器の世界市場:2023年Global Life Science and Chemical Instrumentation Market Research Report 2023 |
||||||
|
|
|||||||
|
● お客様のご希望に応じて、既存データの加工や未掲載情報(例:国別セグメント)の追加などの対応が可能です。 詳細はお問い合わせください。 |
|||||||


| ライフサイエンスおよび化学計測機器の世界市場:2023年 |
|
出版日: 2023年06月28日
発行: QYResearch
ページ情報: 英文 168 Pages
納期: 2~3営業日
|
- 全表示
- 概要
- 図表
- 目次
世界のライフサイエンスおよび化学計測機器の市場規模は2022年の417億9,400万米ドルから、予測期間中は5.29%のCAGRで推移し、2029年には606億7,200万米ドルの規模に成長すると予測されています。
地域別では、北米市場が2023年の170億米ドルから、5.53%のCAGRで推移し、2029年には234億8,100万米ドルに達すると予測されています。また、アジア太平洋市場は2023年の133億米ドルから、6.58%のCAGRで推移し、2029年には194億9,700万米ドルの規模に成長すると予測されています。
当レポートでは、世界のライフサイエンスおよび化学計測機器の市場を調査し、市場および製品の概要、競合情勢、市場規模の推移・予測、各種区分・地域/主要国別の詳細分析、価格動向、市場成長への各種影響因子の分析、産業チェーン、主要企業の分析などをまとめています。
目次
第1章 レポートの概要
- 調査範囲
- タイプ別市場分析
- 成長率:2018 vs 2022 vs 2029
- 一般機器
- 分析機器
- 用途別市場
- 市場の成長:2018 vs 2022 vs 2029
- 製薬・バイオ
- 学術・政府機関
- ヘルスケア
- 工業
- 前提・制約
- 調査目的
- 調査年数
第2章 競合情勢・主要企業
- 世界のトップ企業:収益別
- 世界の化学計測機器:企業タイプ別(Tier 1・2・3)
- 世界の主要企業ランキング:収益別
- 市場集中比率
- 主要企業の本社およびサービスエリア
- 主要企業の製品
- 主要企業の設立日
- M&A・拡張計画
第3章 世界のライフサイエンスおよび化学計測機器市場シナリオ:地域別
- 市場の展望
- 成長動向:地域別
- 北米
- 欧州
- アジア太平洋
- 南米
- 中東・アフリカ
第4章 ライフサイエンスおよび化学計測機器の内訳データ:タイプ別
- 市場規模の推移
- 市場規模の予測
第5章 ライフサイエンスおよび化学計測機器の内訳データ:用途別
- 市場規模の推移
- 市場規模の予測
第6章 主要企業のプロファイル
- Thermo Fisher Scientific
- Shimadzu
- Danaher
- Roche
- Agilent Technologies
- Bruker
- Waters
- PerkinElmer
- Bio-Rad Laboratories
- Mettler Toledo
- Illumina
- Sartorius
- HORIBA
- MGI Tech
- JEOL
第7章 産業チェーン・販売チャネルの分析
- 産業チェーン分析
- 主要原材料
- 製造モード・プロセス
- 販売・マーケティング
- 顧客
第8章 ライフサイエンスおよび化学計測機器:市場力学
- 産業動向
- 市場促進要因
- 市場課題
- 市場抑制要因
第9章 アナリストの見解・総論
第10章 付録
List of Tables
- Table 1. Global Life Science and Chemical Instrumentation Market Size Growth Rate by Type (US$ Million): 2018 VS 2022 VS 2029
- Table 2. Global Life Science and Chemical Instrumentation Market Size Growth by Application (US$ Million): 2018 VS 2022 VS 2029
- Table 3. Global Life Science and Chemical Instrumentation Revenue by Players (2018-2023) & (US$ Million)
- Table 4. Global Life Science and Chemical Instrumentation Market Share by Players (2018-2023)
- Table 5. Global Top Life Science and Chemical Instrumentation Players by Company Type (Tier 1, Tier 2, and Tier 3) & (based on the Revenue in Life Science and Chemical Instrumentation as of 2022)
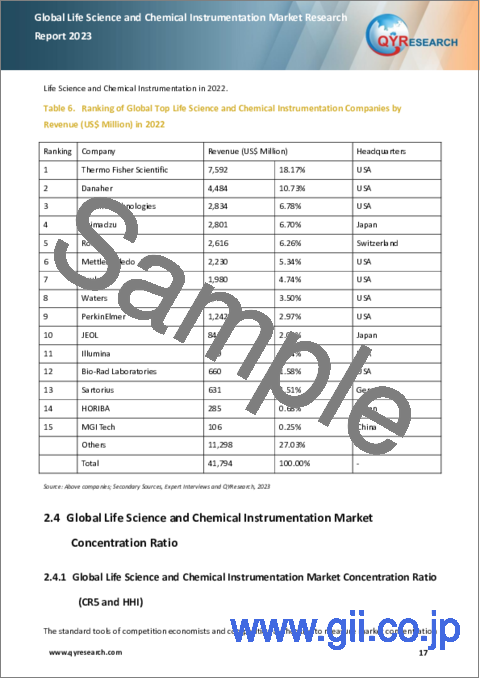
- Table 6. Ranking of Global Top Life Science and Chemical Instrumentation Companies by Revenue (US$ Million) in 2022
- Table 7. Global 5 Largest Players Market Share by Life Science and Chemical Instrumentation Revenue (CR5 and HHI) & (2018-2023)
- Table 8. Global Key Players of Life Science and Chemical Instrumentation, Headquarters and Area Served
- Table 9. Global Key Players of Life Science and Chemical Instrumentation, Product
- Table 10. Global Key Players of Life Science and Chemical Instrumentation, Founded Date
- Table 11. Mergers & Acquisitions, Expansion Plans
- Table 12. Global Life Science and Chemical Instrumentation Market Size by Region (US$ Million): 2018 VS 2022 VS 2029
- Table 13. Global Life Science and Chemical Instrumentation Market Size by Region (2018-2023) & (US$ Million)
- Table 14. Global Life Science and Chemical Instrumentation Market Share by Region (2018-2023)
- Table 15. Global Life Science and Chemical Instrumentation Forecasted Market Size by Region (2024-2029) & (US$ Million)
- Table 16. Global Life Science and Chemical Instrumentation Market Share by Region (2024-2029)
- Table 17. North America Life Science and Chemical Instrumentation Market Size Growth Rate by Country (US$ Million): 2018 VS 2022 VS 2029
- Table 18. North America Life Science and Chemical Instrumentation Market Size by Country (2018-2023) & (US$ Million)
- Table 19. North America Life Science and Chemical Instrumentation Market Size by Country (2024-2029) & (US$ Million)
- Table 20. Europe Life Science and Chemical Instrumentation Market Size Growth Rate by Country (US$ Million): 2018 VS 2022 VS 2029
- Table 21. Europe Life Science and Chemical Instrumentation Market Size by Country (2018-2023) & (US$ Million)
- Table 22. Europe Life Science and Chemical Instrumentation Market Size by Country (2024-2029) & (US$ Million)
- Table 23. Asia-Pacific Life Science and Chemical Instrumentation Market Size Growth Rate by Country (US$ Million): 2018 VS 2022 VS 2029
- Table 24. Asia-Pacific Life Science and Chemical Instrumentation Market Size by Region (2018-2023) & (US$ Million)
- Table 25. Asia-Pacific Life Science and Chemical Instrumentation Market Size by Region (2024-2029) & (US$ Million)
- Table 26. South America Life Science and Chemical Instrumentation Market Size Growth Rate by Country (US$ Million): 2018 VS 2022 VS 2029
- Table 27. South America Life Science and Chemical Instrumentation Market Size by Country (2018-2023) & (US$ Million)
- Table 28. South America Life Science and Chemical Instrumentation Market Size by Country (2024-2029) & (US$ Million)
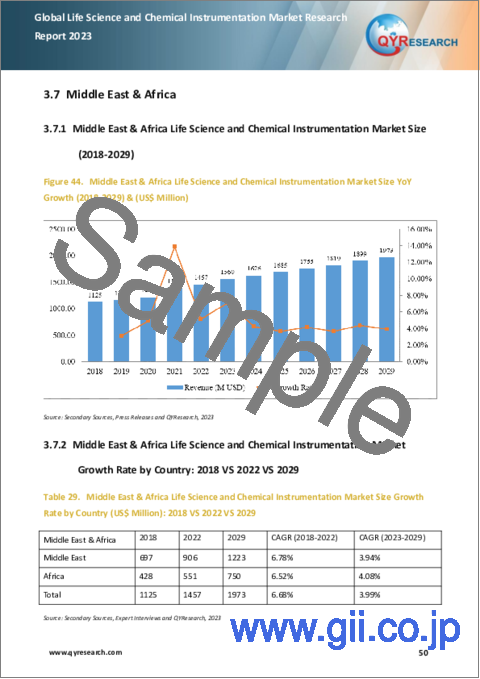
- Table 29. Middle East & Africa Life Science and Chemical Instrumentation Market Size Growth Rate by Country (US$ Million): 2018 VS 2022 VS 2029
- Table 30. Middle East & Africa Life Science and Chemical Instrumentation Market Size by Country (2018-2023) & (US$ Million)
- Table 31. Middle East & Africa Life Science and Chemical Instrumentation Market Size by Country (2024-2029) & (US$ Million)
- Table 32. Global Life Science and Chemical Instrumentation Market Size by Type (2018-2023) & (US$ Million)
- Table 33. Global Life Science and Chemical Instrumentation Revenue Market Share by Type (2018-2023)
- Table 34. Global Life Science and Chemical Instrumentation Forecasted Market Size by Type (2024-2029) & (US$ Million)
- Table 35. Global Life Science and Chemical Instrumentation Revenue Market Share by Type (2024-2029)
- Table 36. Global Life Science and Chemical Instrumentation Market Size by Application (2018-2023) & (US$ Million)
- Table 37. Global Life Science and Chemical Instrumentation Revenue Market Share by Application (2018-2023)
- Table 38. Global Life Science and Chemical Instrumentation Forecasted Market Size by Application (2024-2029) & (US$ Million)
- Table 39. Global Life Science and Chemical Instrumentation Revenue Market Share by Application (2024-2029)
- Table 40. Thermo Fisher Scientific Company Details
- Table 41. Thermo Fisher Scientific Business Overview
- Table 42. Thermo Fisher Scientific Life Science and Chemical Instrumentation Product
- Table 43. Thermo Fisher Scientific Revenue in Life Science and Chemical Instrumentation Business (2018-2023) & (US$ Million)
- Table 44. Thermo Fisher Scientific Recent Development
- Table 45. Shimadzu Company Details
- Table 46. Shimadzu Business Overview
- Table 47. Shimadzu Life Science and Chemical Instrumentation Product
- Table 48. Shimadzu Revenue in Life Science and Chemical Instrumentation Business (2018-2023) & (US$ Million)
- Table 49. Danaher Company Details
- Table 50. Danaher Business Overview
- Table 51. Danaher Life Science and Chemical Instrumentation Product
- Table 52. Danaher Revenue in Life Science and Chemical Instrumentation Business (2018-2023) & (US$ Million)
- Table 53. Danaher Recent Development
- Table 54. Roche Company Details
- Table 55. Roche Business Overview
- Table 56. Roche Life Science and Chemical Instrumentation Product
- Table 57. Roche Revenue in Life Science and Chemical Instrumentation Business (2018-2023) & (US$ Million)
- Table 58. Roche Recent Development
- Table 59. Agilent Technologies Company Details
- Table 60. Agilent Technologies Business Overview
- Table 61. Agilent Technologies Life Science and Chemical Instrumentation Product
- Table 62. Agilent Technologies Revenue in Life Science and Chemical Instrumentation Business (2018-2023) & (US$ Million)
- Table 63. Agilent Technologies Recent Development
- Table 64. Bruker Company Details
- Table 65. Bruker Business Overview
- Table 66. Bruker Life Science and Chemical Instrumentation Product
- Table 67. Bruker Revenue in Life Science and Chemical Instrumentation Business (2018-2023) & (US$ Million)
- Table 68. Bruker Recent Development
- Table 69. Waters Company Details
- Table 70. Waters Business Overview
- Table 71. Waters Life Science and Chemical Instrumentation Product
- Table 72. Waters Revenue in Life Science and Chemical Instrumentation Business (2018-2023) & (US$ Million)
- Table 73. PerkinElmer Company Details
- Table 74. PerkinElmer Business Overview
- Table 75. PerkinElmer Life Science and Chemical Instrumentation Product
- Table 76. PerkinElmer Revenue in Life Science and Chemical Instrumentation Business (2018-2023) & (US$ Million)
- Table 77. PerkinElmer Recent Development
- Table 78. Bio-Rad Laboratories Company Details
- Table 79. Bio-Rad Laboratories Business Overview
- Table 80. Bio-Rad Laboratories Life Science and Chemical Instrumentation Product
- Table 81. Bio-Rad Laboratories Revenue in Life Science and Chemical Instrumentation Business (2018-2023) & (US$ Million)
- Table 82. Mettler Toledo Company Details
- Table 83. Mettler Toledo Business Overview
- Table 84. Mettler Toledo Life Science and Chemical Instrumentation Product
- Table 85. Mettler Toledo Revenue in Life Science and Chemical Instrumentation Business (2018-2023) & (US$ Million)
- Table 86. Mettler Toledo Recent Development
- Table 87. Illumina Company Details
- Table 88. Illumina Business Overview
- Table 89. Illumina Life Science and Chemical Instrumentation Product
- Table 90. Illumina Revenue in Life Science and Chemical Instrumentation Business (2018-2023) & (US$ Million)
- Table 91. Illumina Recent Development
- Table 92. Sartorius Company Details
- Table 93. Sartorius Business Overview
- Table 94. Sartorius Life Science and Chemical Instrumentation Product
- Table 95. Sartorius Revenue in Life Science and Chemical Instrumentation Business (2018-2023) & (US$ Million)
- Table 96. Sartorius Recent Development
- Table 97. HORIBA Company Details
- Table 98. HORIBA Business Overview
- Table 99. HORIBA Life Science and Chemical Instrumentation Product
- Table 100. HORIBA Revenue in Life Science and Chemical Instrumentation Business (2018-2023) & (US$ Million)
- Table 101. MGI Tech Company Details
- Table 102. MGI Tech Business Overview
- Table 103. MGI Tech Life Science and Chemical Instrumentation Product
- Table 104. MGI Tech Revenue in Life Science and Chemical Instrumentation Business (2018-2023) & (US$ Million)
- Table 105. JEOL Company Details
- Table 106. JEOL Business Overview
- Table 107. JEOL Life Science and Chemical Instrumentation Product
- Table 108. JEOL Revenue in Life Science and Chemical Instrumentation Business (2018-2023) & (US$ Million)
- Table 109. Key Raw Materials Lists
- Table 110. Raw Materials Key Suppliers Lists
- Table 111. Life Science and Chemical Instrumentation Distributors List
- Table 112. Life Science and Chemical Instrumentation Customers List
- Table 113. Life Science and Chemical Instrumentation Market Trends
- Table 114. Life Science and Chemical Instrumentation Market Drivers
- Table 115. Life Science and Chemical Instrumentation Market Challenges
- Table 116. Life Science and Chemical Instrumentation Market Restraints
- Table 117. Research Programs/Design for This Report
- Table 118. Key Data Information from Secondary Sources
- Table 119. Key Data Information from Primary Sources
- Table 120. Authors List of This Report
- Table 121. QYR Business Unit and Senior & Team Lead Analysts
List of Figures
- Figure 1. Global Life Science and Chemical Instrumentation Market Size Comparison by Type (2023-2029) & (US$ Million)
- Figure 2. Global Life Science and Chemical Instrumentation Market Share by Type: 2022
- Figure 3. Global Life Science and Chemical Instrumentation Market Share by Type: 2029
- Figure 4. General Instrument Features
- Figure 5. Analytical Instruments Features
- Figure 6. Global Life Science and Chemical Instrumentation Market Size by Application (2023-2029) & (US$ Million)
- Figure 7. Global Life Science and Chemical Instrumentation Market Share by Application: 2022
- Figure 8. Global Life Science and Chemical Instrumentation Market Share by Application: 2029
- Figure 9. Pharma & Bio Case Studies
- Figure 10. Academic & Government Case Studies
- Figure 11. Healthcare Case Studies
- Figure 12. Industry Case Studies
- Figure 13. Life Science and Chemical Instrumentation Report Years Considered
- Figure 14. Global Life Science and Chemical Instrumentation Market Share by Players in 2022
- Figure 15. The Top 5 Players Market Share by Life Science and Chemical Instrumentation Revenue in 2022
- Figure 16. The Top 10 Players Market Share by Life Science and Chemical Instrumentation Revenue in 2022
- Figure 17. Global Life Science and Chemical Instrumentation Market Size (US$ Million), Year-over-Year: 2018-2029
- Figure 18. Global Life Science and Chemical Instrumentation Market Size, (US$ Million), 2018 VS 2023 VS 2029
- Figure 19. Global Life Science and Chemical Instrumentation Market Share by Region: 2022
- Figure 20. Global Life Science and Chemical Instrumentation Market Share by Region: 2029
- Figure 21. North America Life Science and Chemical Instrumentation Market Size YoY Growth (2018-2029) & (US$ Million)
- Figure 22. North America Life Science and Chemical Instrumentation Market Share by Country (2018-2029)
- Figure 23. United States Life Science and Chemical Instrumentation Market Size YoY Growth (2018-2029) & (US$ Million)
- Figure 24. Canada Life Science and Chemical Instrumentation Market Size YoY Growth (2018-2029) & (US$ Million)
- Figure 25. Mexico Life Science and Chemical Instrumentation Market Size YoY Growth (2018-2029) & (US$ Million)
- Figure 26. Europe Life Science and Chemical Instrumentation Market Size YoY Growth (2018-2029) & (US$ Million)
- Figure 27. Europe Life Science and Chemical Instrumentation Market Share by Country (2018-2029)
- Figure 28. Germany Life Science and Chemical Instrumentation Market Size YoY Growth (2018-2029) & (US$ Million)
- Figure 29. France Life Science and Chemical Instrumentation Market Size YoY Growth (2018-2029) & (US$ Million)
- Figure 30. U.K. Life Science and Chemical Instrumentation Market Size YoY Growth (2018-2029) & (US$ Million)
- Figure 31. Italy Life Science and Chemical Instrumentation Market Size YoY Growth (2018-2029) & (US$ Million)
- Figure 32. Russia Life Science and Chemical Instrumentation Market Size YoY Growth (2018-2029) & (US$ Million)
- Figure 33. Asia-Pacific Life Science and Chemical Instrumentation Market Size YoY Growth (2018-2029) & (US$ Million)
- Figure 34. Asia-Pacific Life Science and Chemical Instrumentation Market Share by Region (2018-2029)
- Figure 35. China Life Science and Chemical Instrumentation Market Size YoY Growth (2018-2029) & (US$ Million)
- Figure 36. Japan Life Science and Chemical Instrumentation Market Size YoY Growth (2018-2029) & (US$ Million)
- Figure 37. South Korea Life Science and Chemical Instrumentation Market Size YoY Growth (2018-2029) & (US$ Million)
- Figure 38. Southeast Asia Life Science and Chemical Instrumentation Market Size YoY Growth (2018-2029) & (US$ Million)
- Figure 39. India Life Science and Chemical Instrumentation Market Size YoY Growth (2018-2029) & (US$ Million)
- Figure 40. Australia Life Science and Chemical Instrumentation Market Size YoY Growth (2018-2029) & (US$ Million)
- Figure 41. South America Life Science and Chemical Instrumentation Market Size YoY Growth (2018-2029) & (US$ Million)
- Figure 42. South America Life Science and Chemical Instrumentation Market Share by Country (2018-2029)
- Figure 43. Brazil Life Science and Chemical Instrumentation Market Size YoY Growth (2018-2029) & (US$ Million)
- Figure 44. Middle East & Africa Life Science and Chemical Instrumentation Market Size YoY Growth (2018-2029) & (US$ Million)
- Figure 45. Middle East & Africa Life Science and Chemical Instrumentation Market Share by Country (2018-2029)
- Figure 46. Middle East Life Science and Chemical Instrumentation Market Size YoY Growth (2018-2029) & (US$ Million)
- Figure 47. Africa Life Science and Chemical Instrumentation Market Size YoY Growth (2018-2029) & (US$ Million)
- Figure 48. Thermo Fisher Scientific Revenue Growth Rate in Life Science and Chemical Instrumentation Business (2018-2023)
- Figure 49. Shimadzu Revenue Growth Rate in Life Science and Chemical Instrumentation Business (2018-2023)
- Figure 50. Danaher Revenue Growth Rate in Life Science and Chemical Instrumentation Business (2018-2023)
- Figure 51. Roche Revenue Growth Rate in Life Science and Chemical Instrumentation Business (2018-2023)
- Figure 52. Agilent Technologies Revenue Growth Rate in Life Science and Chemical Instrumentation Business (2018-2023)
- Figure 53. Bruker Revenue Growth Rate in Life Science and Chemical Instrumentation Business (2018-2023)
- Figure 54. Waters Revenue Growth Rate in Life Science and Chemical Instrumentation Business (2018-2023)
- Figure 55. PerkinElmer Revenue Growth Rate in Life Science and Chemical Instrumentation Business (2018-2023)
- Figure 56. Bio-Rad Laboratories Revenue Growth Rate in Life Science and Chemical Instrumentation Business (2018-2023)
- Figure 57. Mettler Toledo Revenue Growth Rate in Life Science and Chemical Instrumentation Business (2018-2023)
- Figure 58. Illumina Revenue Growth Rate in Life Science and Chemical Instrumentation Business (2018-2023)
- Figure 59. Sartorius Revenue Growth Rate in Life Science and Chemical Instrumentation Business (2018-2023)
- Figure 60. HORIBA Revenue Growth Rate in Life Science and Chemical Instrumentation Business (2018-2023)
- Figure 61. MGI Tech Revenue Growth Rate in Life Science and Chemical Instrumentation Business (2018-2023)
- Figure 62. JEOL Revenue Growth Rate in Life Science and Chemical Instrumentation Business (2018-2023)
- Figure 63. Life Science and Chemical Instrumentation Value Chain
- Figure 64. Life Science and Chemical Instrumentation Production Process
- Figure 65. Channels of Distribution
- Figure 66. Distributors Profiles
- Figure 67. Bottom-up and Top-down Approaches for This Report
- Figure 68. Data Triangulation
- Figure 69. Key Executives Interviewed
The global Life Science and Chemical Instrumentation market was valued at US$ 41,794 million in 2022 and is anticipated to reach US$ 60,672 million by 2029, witnessing a CAGR of 5.29% during the forecast period 2023-2029. The influence of COVID-19 and the Russia-Ukraine War were considered while estimating market sizes.
North American market for Life Science and Chemical Instrumentation is estimated to increase from $ 17000 million in 2023 to reach $ 23481 million by 2029, at a CAGR of 5.53 % during the forecast period of 2023 through 2029.
Asia-Pacific market for Life Science and Chemical Instrumentation is estimated to increase from $ 13300 million in 2023 to reach $ 19497 million by 2029, at a CAGR of 6.58 % during the forecast period of 2023 through 2029.
The major global companies of Life Science and Chemical Instrumentation include: Thermo Fisher Scientific, Danaher, Agilent Technologies, Shimadzu, Roche, Mettler Toledo, Bruker, etc. In 2022, the world's top five vendors accounted for approximately 48.64 % of the revenue.
Report Scope
This report aims to provide a comprehensive presentation of the global market for Life Science and Chemical Instrumentation, with both quantitative and qualitative analysis, to help readers develop business/growth strategies, assess the market competitive situation, analyze their position in the current marketplace, and make informed business decisions regarding Life Science and Chemical Instrumentation.
The Life Science and Chemical Instrumentation market size, estimations, and forecasts are provided in terms of and revenue ($ millions), considering 2022 as the base year, with history and forecast data for the period from 2018 to 2029. This report segments the global Life Science and Chemical Instrumentation market comprehensively. Regional market sizes, concerning products by Type, by Application, and by players, are also provided.
For a more in-depth understanding of the market, the report provides profiles of the competitive landscape, key competitors, and their respective market ranks. The report also discusses technological trends and new product developments.
The report will help the Life Science and Chemical Instrumentation companies, new entrants, and industry chain related companies in this market with information on the revenues for the overall market and the sub-segments across the different segments, by company, by Type, by Application, and by regions.
By Company
- Thermo Fisher Scientific
- Shimadzu
- Danaher
- Roche
- Agilent Technologies
- Bruker
- Waters
- PerkinElmer
- Bio-Rad Laboratories
- Mettler Toledo
- Illumina
- Sartorius
- HORIBA
- MGI Tech
- JEOL
Segment by Type
- General Instrument
- Analytical Instruments
- Others
Segment by Application
- Pharma & Bio
- Academic & Government
- Healthcare
- Industry
- Other
By Region
- North America
- United States
- Canada
- Mexico
- Asia-Pacific
- China
- Japan
- South Korea
- Southeast Asia
- India
- Australia
- Rest of Asia
- Europe
- Germany
- France
- U.K.
- Italy
- Russia
- Rest of Europe
- South America
- Brazil
- Rest of South America
- Middle East & Africa
- Middle East
- Africa
Table of Contents
1 Report Overview
- 1.1 Study Scope
- 1.2 Market Analysis by Type
- 1.2.1 Global Life Science and Chemical Instrumentation Market Size Growth Rate by Type: 2018 VS 2022 VS 2029
- 1.2.2 General Instrument
- 1.2.3 Analytical Instruments
- 1.3 Market by Application
- 1.3.1 Global Life Science and Chemical Instrumentation Market Growth by Application: 2018 VS 2022 VS 2029
- 1.3.2 Pharma & Bio
- 1.3.3 Academic & Government
- 1.3.4 Healthcare
- 1.3.5 Industry
- 1.4 Assumptions and Limitations
- 1.5 Study Objectives
- 1.6 Years Considered
2 Competition Landscape by Key Players
- 2.1 Global Top Life Science and Chemical Instrumentation Players by Revenue
- 2.1.1 Global Top Life Science and Chemical Instrumentation Players by Revenue (2018-2023)
- 2.1.2 Global Life Science and Chemical Instrumentation Revenue Market Share by Players (2018-2023)
- 2.2 Global Life Science and Chemical Instrumentation by Company Type (Tier 1, Tier 2, and Tier 3)
- 2.3 Global Key Players Ranking by Life Science and Chemical Instrumentation Revenue
- 2.4 Global Life Science and Chemical Instrumentation Market Concentration Ratio
- 2.4.1 Global Life Science and Chemical Instrumentation Market Concentration Ratio (CR5 and HHI)
- 2.4.2 Global Top 10 and Top 5 Companies by Life Science and Chemical Instrumentation Revenue in 2022
- 2.5 Global Key Players of Life Science and Chemical Instrumentation Head office and Area Served
- 2.6 Global Key Players of Life Science and Chemical Instrumentation, Product
- 2.7 Global Key Players of Life Science and Chemical Instrumentation, Founded Date
- 2.8 Mergers & Acquisitions, Expansion Plans
3 Global Life Science and Chemical Instrumentation Market Scenario by Region
- 3.1 Global Life Science and Chemical Instrumentation Market Perspective (2018-2029)
- 3.2 Global Life Science and Chemical Instrumentation Growth Trends by Region
- 3.2.1 Global Life Science and Chemical Instrumentation Market Size by Region: 2018 VS 2022 VS 2029
- 3.2.2 Life Science and Chemical Instrumentation Historic Market Size by Region (2018-2023)
- 3.2.3 Life Science and Chemical Instrumentation Forecasted Market Size by Region (2024-2029)
- 3.3 North America
- 3.3.1 North America Life Science and Chemical Instrumentation Market Size (2018-2029)
- 3.3.2 North America Life Science and Chemical Instrumentation Market Growth Rate by Country: 2018 VS 2022 VS 2029
- 3.3.3 North America Life Science and Chemical Instrumentation Market Size by Country (2018-2023)
- 3.3.4 North America Life Science and Chemical Instrumentation Market Size by Country (2024-2029)
- 3.3.5 United States
- 3.3.6 Canada
- 3.3.7 Mexico
- 3.4 Europe
- 3.4.1 Europe Life Science and Chemical Instrumentation Market Size (2018-2029)
- 3.4.2 Europe Life Science and Chemical Instrumentation Market Growth Rate by Country: 2018 VS 2022 VS 2029
- 3.4.3 Europe Life Science and Chemical Instrumentation Market Size by Country (2018-2023)
- 3.4.4 Europe Life Science and Chemical Instrumentation Market Size by Country (2024-2029)
- 3.4.5 Germany
- 3.4.6 France
- 3.4.7 U.K.
- 3.4.8 Italy
- 3.4.9 Russia
- 3.5 Asia-Pacific
- 3.5.1 Asia-Pacific Life Science and Chemical Instrumentation Market Size (2018-2029)
- 3.5.2 Asia-Pacific Life Science and Chemical Instrumentation Market Growth Rate by Country: 2018 VS 2022 VS 2029
- 3.5.3 Asia-Pacific Life Science and Chemical Instrumentation Market Size by Region (2018-2023)
- 3.5.4 Asia-Pacific Life Science and Chemical Instrumentation Market Size by Region (2024-2029)
- 3.5.5 China
- 3.5.6 Japan
- 3.5.7 South Korea
- 3.5.8 Southeast Asia
- 3.5.9 India
- 3.5.10 Australia
- 3.6 South America
- 3.6.1 South America Life Science and Chemical Instrumentation Market Size (2018-2029)
- 3.6.2 South America Life Science and Chemical Instrumentation Market Growth Rate by Country: 2018 VS 2022 VS 2029
- 3.6.3 South America Life Science and Chemical Instrumentation Market Size by Country (2018-2023)
- 3.6.4 South America Life Science and Chemical Instrumentation Market Size by Country (2024-2029)
- 3.6.5 Brazil
- 3.7 Middle East & Africa
- 3.7.1 Middle East & Africa Life Science and Chemical Instrumentation Market Size (2018-2029)
- 3.7.2 Middle East & Africa Life Science and Chemical Instrumentation Market Growth Rate by Country: 2018 VS 2022 VS 2029
- 3.7.3 Middle East & Africa Life Science and Chemical Instrumentation Market Size by Country (2018-2023)
- 3.7.4 Middle East & Africa Life Science and Chemical Instrumentation Market Size by Country (2024-2029)
- 3.7.5 Middle East
- 3.7.6 Africa
4 Life Science and Chemical Instrumentation Breakdown Data by Type
- 4.1 Global Life Science and Chemical Instrumentation Historic Market Size by Type (2018-2023)
- 4.2 Global Life Science and Chemical Instrumentation Forecasted Market Size by Type (2024-2029)
5 Life Science and Chemical Instrumentation Breakdown Data by Application
- 5.1 Global Life Science and Chemical Instrumentation Historic Market Size by Application (2018-2023)
- 5.2 Global Life Science and Chemical Instrumentation Forecasted Market Size by Application (2024-2029)
6 Key Players Profiles
- 6.1 Thermo Fisher Scientific
- 6.1.1 Thermo Fisher Scientific Company Details
- 6.1.2 Thermo Fisher Scientific Business Overview
- 6.1.3 Thermo Fisher Scientific Life Science and Chemical Instrumentation Introduction
- 6.1.4 Thermo Fisher Scientific Revenue in Life Science and Chemical Instrumentation Business (2018-2023)
- 6.1.5 Thermo Fisher Scientific Recent Development
- 6.2 Shimadzu
- 6.2.1 Shimadzu Company Details
- 6.2.2 Shimadzu Business Overview
- 6.2.3 Shimadzu Life Science and Chemical Instrumentation Introduction
- 6.2.4 Shimadzu Revenue in Life Science and Chemical Instrumentation Business (2018-2023)
- 6.3 Danaher
- 6.3.1 Danaher Company Details
- 6.3.2 Danaher Business Overview
- 6.3.3 Danaher Life Science and Chemical Instrumentation Introduction
- 6.3.4 Danaher Revenue in Life Science and Chemical Instrumentation Business (2018-2023)
- 6.3.5 Danaher Recent Development
- 6.4 Roche
- 6.4.1 Roche Company Details
- 6.4.2 Roche Business Overview
- 6.4.3 Roche Life Science and Chemical Instrumentation Introduction
- 6.4.4 Roche Revenue in Life Science and Chemical Instrumentation Business (2018-2023)
- 6.4.5 Roche Recent Development
- 6.5 Agilent Technologies
- 6.5.1 Agilent Technologies Company Details
- 6.5.2 Agilent Technologies Business Overview
- 6.5.3 Agilent Technologies Life Science and Chemical Instrumentation Introduction
- 6.5.4 Agilent Technologies Revenue in Life Science and Chemical Instrumentation Business (2018-2023)
- 6.5.5 Agilent Technologies Recent Development
- 6.6 Bruker
- 6.6.1 Bruker Company Details
- 6.6.2 Bruker Business Overview
- 6.6.3 Bruker Life Science and Chemical Instrumentation Introduction
- 6.6.4 Bruker Revenue in Life Science and Chemical Instrumentation Business (2018-2023)
- 6.6.5 Bruker Recent Development
- 6.7 Waters
- 6.7.1 Waters Company Details
- 6.7.2 Waters Business Overview
- 6.7.3 Waters Life Science and Chemical Instrumentation Introduction
- 6.7.4 Waters Revenue in Life Science and Chemical Instrumentation Business (2018-2023)
- 6.8 PerkinElmer
- 6.8.1 PerkinElmer Company Details
- 6.8.2 PerkinElmer Business Overview
- 6.8.3 PerkinElmer Life Science and Chemical Instrumentation Introduction
- 6.8.4 PerkinElmer Revenue in Life Science and Chemical Instrumentation Business (2018-2023)
- 6.8.5 PerkinElmer Recent Development
- 6.9 Bio-Rad Laboratories
- 6.9.1 Bio-Rad Laboratories Company Details
- 6.9.2 Bio-Rad Laboratories Business Overview
- 6.9.3 Bio-Rad Laboratories Life Science and Chemical Instrumentation Introduction
- 6.9.4 Bio-Rad Laboratories Revenue in Life Science and Chemical Instrumentation Business (2018-2023)
- 6.10 Mettler Toledo
- 6.10.1 Mettler Toledo Company Details
- 6.10.2 Mettler Toledo Business Overview
- 6.10.3 Mettler Toledo Life Science and Chemical Instrumentation Introduction
- 6.10.4 Mettler Toledo Revenue in Life Science and Chemical Instrumentation Business (2018-2023)
- 6.10.5 Mettler Toledo Recent Development
- 6.11 Illumina
- 6.11.1 Illumina Company Details
- 6.11.2 Illumina Business Overview
- 6.11.3 Illumina Life Science and Chemical Instrumentation Introduction
- 6.11.4 Illumina Revenue in Life Science and Chemical Instrumentation Business (2018-2023)
- 6.11.5 Illumina Recent Development
- 6.12 Sartorius
- 6.12.1 Sartorius Company Details
- 6.12.2 Sartorius Business Overview
- 6.12.3 Sartorius Life Science and Chemical Instrumentation Introduction
- 6.12.4 Sartorius Revenue in Life Science and Chemical Instrumentation Business (2018-2023)
- 6.12.5 Sartorius Recent Development
- 6.13 HORIBA
- 6.13.1 HORIBA Company Details
- 6.13.2 HORIBA Business Overview
- 6.13.3 HORIBA Life Science and Chemical Instrumentation Introduction
- 6.13.4 HORIBA Revenue in Life Science and Chemical Instrumentation Business (2018-2023)
- 6.14 MGI Tech
- 6.14.1 MGI Tech Company Details
- 6.14.2 MGI Tech Business Overview
- 6.14.3 MGI Tech Life Science and Chemical Instrumentation Introduction
- 6.14.4 MGI Tech Revenue in Life Science and Chemical Instrumentation Business (2018-2023)
- 6.15 JEOL
- 6.15.1 JEOL Company Details
- 6.15.2 JEOL Business Overview
- 6.15.3 JEOL Life Science and Chemical Instrumentation Introduction
- 6.15.4 JEOL Revenue in Life Science and Chemical Instrumentation Business (2018-2023)
7 Industry Chain and Sales Channels Analysis
- 7.1 Life Science and Chemical Instrumentation Industry Chain Analysis
- 7.2 Life Science and Chemical Instrumentation Key Raw Materials
- 7.2.1 Key Raw Materials
- 7.2.2 Raw Materials Key Suppliers
- 7.3 Life Science and Chemical Instrumentation Production Mode & Process
- 7.4 Life Science and Chemical Instrumentation Sales and Marketing
- 7.4.1 Life Science and Chemical Instrumentation Sales Channels
- 7.4.2 Life Science and Chemical Instrumentation Distributors
- 7.5 Life Science and Chemical Instrumentation Customers
8 Life Science and Chemical Instrumentation Market Dynamics
- 8.1 Life Science and Chemical Instrumentation Industry Trends
- 8.2 Life Science and Chemical Instrumentation Market Drivers
- 8.3 Life Science and Chemical Instrumentation Market Challenges
- 8.4 Life Science and Chemical Instrumentation Market Restraints
9 Analyst's Viewpoints/Conclusions
10 Appendix
- 10.1 Research Methodology
- 10.1.1 Methodology/Research Approach
- 10.1.2 Data Source
- 10.2 Author Details
- 10.3 Disclaimer