|
|
市場調査レポート
商品コード
1273258
バナジウム (CAS 7440-62-2) の世界市場:2023年Global Vanadium (CAS 7440-62-2) Market Research Report 2023 |
||||||
|
|
|||||||
カスタマイズ可能
適宜更新あり
|
|||||||


| バナジウム (CAS 7440-62-2) の世界市場:2023年 |
|
出版日: 2023年05月16日
発行: QYResearch
ページ情報: 英文 135 Pages
納期: 2~3営業日
|

- 全表示
- 概要
- 図表
- 目次
世界のバナジウム (CAS 7440-62-2) の市場規模は、2022年の43億7,000万米ドルから、2023年から2029年にかけて6.99%のCAGRで推移し、2029年末には65億9,000万米ドルの規模に成長すると予測されています。
当レポートでは、世界のバナジウム (CAS 7440-62-2) の市場を調査し、市場および製品の概要、市場規模 (生産量・生産額・消費量など) の推移・予測、各種区分・地域/主要国別の詳細分析、価格動向、市場成長への各種影響因子の分析、産業チェーン、主要企業の分析などをまとめています。
目次
第1章 バナジウム:市場概要
- 製品の定義
- バナジウム:用途別
- 成長率の分析:2022 vs 2029
- 鉄鋼業
- 化学工業
- バナジウム合金
- エネルギー貯蔵
- 世界市場の成長見通し
- 生産額の推計・予測
- 生産能力の推計・予測
- 生産量の推計・予測
- 平均価格推定・予測
- 前提・制約
第2章 製造業者・競合情勢
- 生産額の市場シェア:製造業者別
- 主要企業のランキング
- 市場シェア:企業タイプ別 (Tier 1、Tier 2、Tier 3)
- 平均価格の推移:製造業者別
- 世界の主要製造業者・販売地域・本社
- 世界の主要製造業者・提供される製品
- 競合状況・動向
- 新規参入候補
- Australian Vanadium Ltd.
- CNNC Hua Yuan
- AMG Vanadium
- Longbai Group
第3章 バナジウム生産:地域別
- 生産額の推計・予測:2018 vs 2022 vs 2029
- 生産額の推移・予測
- 市場シェアの推移
- 生産額の予測
- 生産量の推計・予測:2018 vs 2022 vs 2029
- 生産量の推移・予測
- 市場シェアの推移
- 生産量の予測
- 市場価格分析
- 生産量・生産額:前年比成長率
第4章 バナジウム消費:地域別
- 消費量の推計・予測:2018 vs 2022 vs 2029
- 消費量の予測
- 北米
- 欧州
- アジア太平洋
- ラテンアメリカ
- 中東・アフリカ
第5章 用途別の分類
- 生産量の推移・予測
- 生産額の推移・予測
- 価格
第6章 主要企業の概要
- PGVT
- Evraz
- Hesteel Group
- Beijing Jianlong
- Treibacher Industrie
- Glencore
- Chengyu
- Desheng Group
- Largo Inc.
- Bushveld Minerals
- Da Steel Industry
- U.S. Vanadium
- Shaanxi Youser
第7章 産業チェーンと販売チャネルの分析
- 産業チェーン分析
- 主要原料
- 抽出モードとプロセス
- 販売およびマーケティング
- 顧客
第8章 バナジウム:市場力学
- 産業動向
- 市場促進要因
- 市場抑制要因
- 市場課題
第9章 調査結果・総論
第10章 調査手法・データソース
List of Tables
- Table 1. Global Vanadium Market Value by Application, (US$ Million) & (2022 VS 2029)
- Table 2. Global Vanadium Production by Manufacturers (2018-2023) & (Tons)
- Table 3. Global Vanadium Production Market Share by Manufacturers (2018-2023)
- Table 4. Global Vanadium Production Value by Manufacturers (2018-2023) & (US$ Million)
- Table 5. Global Vanadium Production Value Share by Manufacturers (2018-2023)
- Table 6. Global Key Players of Vanadium, Industry Ranking, 2021 VS 2022
- Table 7. Company Type (Tier 1, Tier 2, and Tier 3) & (based on the Production Value in Vanadium as of 2022)
- Table 8. Global Market Vanadium Average Price by Manufacturers (US$/Ton) & (2018-2023)
- Table 9. Global Key Manufacturers of Vanadium, Sales Regions and Headquarters
- Table 10. Global Key Manufacturers of Vanadium, Product Offered
- Table 11. Global Vanadium Manufacturers Market Concentration Ratio (CR5 and HHI)
- Table 12. Global Vanadium Production Value by Region: 2018 VS 2022 VS 2029 (US$ Million)
- Table 13. Global Vanadium Production Value (US$ Million) by Region (2018-2023)
- Table 14. Global Vanadium Production Value Market Share by Region (2018-2023)
- Table 15. Global Vanadium Production Value (US$ Million) Forecast by Region (2024-2029)
- Table 16. Global Vanadium Production Value Market Share Forecast by Region (2024-2029)
- Table 17. Global Vanadium Production Comparison by Region: 2018 VS 2022 VS 2029 (Tons)
- Table 18. Global Vanadium Production (Tons) by Region (2018-2023)
- Table 19. Global Vanadium Production Market Share by Region (2018-2023)
- Table 20. Global Vanadium Production (Tons) Forecast by Region (2024-2029)
- Table 21. Global Vanadium Production Market Share Forecast by Region (2024-2029)
- Table 22. Global Vanadium Market Average Price (US$/Ton) by Region (2018-2023)
- Table 23. Global Vanadium Market Average Price (US$/Ton) by Region (2024-202*)
- Table 24. Global Vanadium Consumption Growth Rate by Region: 2018 VS 2022 VS 2029 (Tons)
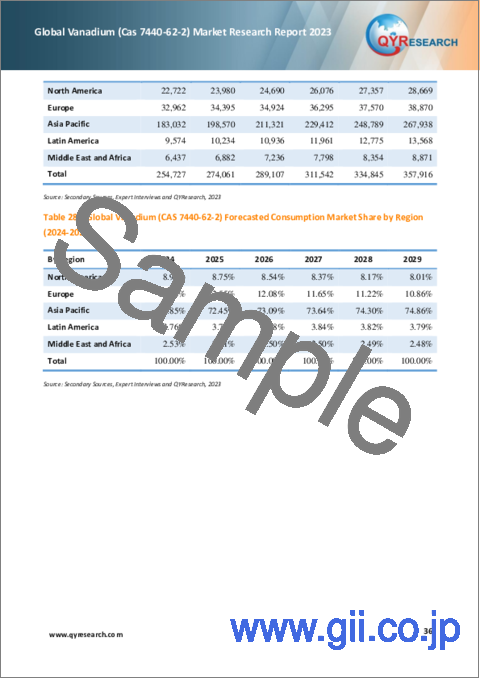
- Table 25. Global Vanadium Consumption by Region (2018-2023) & (Tons)
- Table 26. Global Vanadium Consumption Market Share by Region (2018-2023)
- Table 27. Global Vanadium Forecasted Consumption by Region (2024-2029) & (Tons)
- Table 28. Global Vanadium Forecasted Consumption Market Share by Region (2024-2029)
- Table 29. North America Vanadium Consumption Growth Rate by Country: 2018 VS 2022 VS 2029 (Tons)
- Table 30. North America Vanadium Consumption by Country (2018-2023) & (Tons)
- Table 31. North America Vanadium Consumption by Country (2024-2029) & (Tons)
- Table 32. Europe Vanadium Consumption Growth Rate by Country: 2018 VS 2022 VS 2029 (Tons)
- Table 33. Europe Vanadium Consumption by Country (2018-2023) & (Tons)
- Table 34. Europe Vanadium Consumption by Country (2024-2029) & (Tons)
- Table 35. Asia Pacific Vanadium Consumption Growth Rate by Country: 2018 VS 2022 VS 2029 (Tons)
- Table 36. Asia Pacific Vanadium Consumption by Region (2018-2023) & (Tons)
- Table 37. Asia Pacific Vanadium Consumption by Region (2024-2029) & (Tons)
- Table 38. Latin America Vanadium Consumption Growth Rate by Country: 2018 VS 2022 VS 2029 (Tons)
- Table 39. Latin America Vanadium Consumption by Country (2018-2023) & (Tons)
- Table 40. Latin America Vanadium Consumption by Country (2024-2029) & (Tons)
- Table 41. Middle East & Africa Vanadium Consumption Growth Rate by Country: 2018 VS 2022 VS 2029 (Tons)
- Table 42. Middle East & Africa Vanadium Consumption by Country (2018-2023) & (Tons)
- Table 43. Middle East & Africa Vanadium Consumption by Country (2024-2029) & (Tons)
- Table 44. Global Vanadium Production (Tons) by Application (2018-2023)
- Table 45. Global Vanadium Production (Tons) by Application (2024-2029)
- Table 46. Global Vanadium Production Market Share by Application (2018-2023)
- Table 47. Global Vanadium Production Market Share by Application (2024-2029)
- Table 48. Global Vanadium Production Value (US$ Million) by Application (2018-2023)
- Table 49. Global Vanadium Production Value (US$ Million) by Application (2024-2029)
- Table 50. Global Vanadium Production Value Market Share by Application (2018-2023)
- Table 51. Global Vanadium Production Value Market Share by Application (2024-2029)
- Table 52. Global Vanadium Price (US$/Ton) by Application (2018-2023)
- Table 53. Global Vanadium Price (US$/Ton) by Application (2024-2029)
- Table 54. PGVT Vanadium Company Information
- Table 55. PGVT Vanadium Specification and Application
- Table 56. PGVT Vanadium Production (Tons), Value (US$ Million), Price (US$/Ton) and Gross Margin (2018-2023)
- Table 57. Evraz Vanadium Company Information
- Table 58. Evraz Vanadium Specification and Application
- Table 59. Evraz Vanadium Production (Tons), Value (US$ Million), Price (US$/Ton) and Gross Margin (2018-2023)
- Table 60. Hesteel Group Vanadium Company Information
- Table 61. Hesteel Group Vanadium Specification and Application
- Table 62. Hesteel Group Vanadium Production (Tons), Value (US$ Million), Price (US$/Ton) and Gross Margin (2018-2023)
- Table 63. Beijing Jianlong Vanadium Company Information
- Table 64. Beijing Jianlong Vanadium Specification and Application
- Table 65. Beijing Jianlong Vanadium Production (Tons), Value (US$ Million), Price (US$/Ton) and Gross Margin (2018-2023)
- Table 66. Treibacher Industrie Vanadium Company Information
- Table 67. Treibacher Industrie Vanadium Specification and Application
- Table 68. Treibacher Industrie Vanadium Production (Tons), Value (US$ Million), Price (US$/Ton) and Gross Margin (2018-2023)
- Table 69. Glencore Vanadium Company Information
- Table 70. Glencore Vanadium Specification and Application
- Table 71. Glencore Vanadium Production (Tons), Value (US$ Million), Price (US$/Ton) and Gross Margin (2018-2023)
- Table 72. Chengyu Vanadium Company Information
- Table 73. Chengyu Vanadium Specification and Application
- Table 74. Chengyu Vanadium Production (Tons), Value (US$ Million), Price (US$/Ton) and Gross Margin (2018-2023)
- Table 75. Desheng Group Vanadium Company Information
- Table 76. Desheng Group Vanadium Specification and Application
- Table 77. Desheng Group Vanadium Production (Tons), Value (US$ Million), Price (US$/Ton) and Gross Margin (2018-2023)
- Table 78. Largo Inc. Vanadium Company Information
- Table 79. Largo Inc. Vanadium Specification and Application
- Table 80. Largo Inc. Vanadium Production (Tons), Value (US$ Million), Price (US$/Ton) and Gross Margin (2018-2023)
- Table 81. Bushveld Minerals Vanadium Company Information
- Table 82. Bushveld Minerals Vanadium Specification and Application
- Table 83. Bushveld Minerals Vanadium Production (Tons), Value (US$ Million), Price (US$/Ton) and Gross Margin (2018-2023)
- Table 84. Da Steel Industry Vanadium Company Information
- Table 85. Da Steel Industry Vanadium Specification and Application
- Table 86. Da Steel Industry Vanadium Production (Tons), Value (US$ Million), Price (US$/Ton) and Gross Margin (2018-2023)
- Table 87. U.S. Vanadium Vanadium Company Information
- Table 88. U.S. Vanadium Vanadium Specification and Application
- Table 89. U.S. Vanadium Vanadium Production (Tons), Value (US$ Million), Price (US$/Ton) and Gross Margin (2018-2023)
- Table 90. Shaanxi Youser Vanadium Company Information
- Table 91. Shaanxi Youser Vanadium Specification and Application
- Table 92. Shaanxi Youser Vanadium Production (Tons), Value (US$ Million), Price (US$/Ton) and Gross Margin (2018-2023)
- Table 93. Raw Materials Key Suppliers Lists
- Table 94. Vanadium Extraction Mode & Process
- Table 95. Vanadium Distributors List
- Table 96. Vanadium Customers List
- Table 97. Vanadium Market Trends
- Table 98. Vanadium Market Drivers
- Table 99. Vanadium Market Restraints
- Table 100. Vanadium Market Challenges
- Table 101. Research Programs/Design for This Report
- Table 102. Key Data Information from Secondary Sources
- Table 103. Key Data Information from Primary Sources
- Table 104. Authors List of This Report
- Table 105. QYR Business Unit and Senior & Team Lead Analysts
List of Figures
- Figure 1. Global Vanadium Market Share by Application: 2022 VS 2029
- Figure 2. Steel Industry
- Figure 3. Chemical Industry
- Figure 4. Vanadium Alloys
- Figure 5. Energy Storage
- Figure 6. Global Vanadium Production Value (US$ Million), 2018 VS 2022 VS 2029
- Figure 7. Global Vanadium Production Value (US$ Million) & (2018-2029)
- Figure 8. Global Vanadium Production Capacity (Tons) & (2018-2029)
- Figure 9. Global Vanadium Production (Tons) & (2018-2029)
- Figure 10. Global Vanadium Average Price (US$/Ton) & (2018-2029)
- Figure 11. Vanadium Report Years Considered
- Figure 12. Vanadium Production Share by Manufacturers in 2022
- Figure 13. Vanadium Production Value Share by Manufacturers in 2022
- Figure 14. The Global 5 Largest Players: Market Share by Vanadium Revenue in 2022
- Figure 15. China Vanadium Production Value (US$ Million) Growth Rate (2018-2029)
- Figure 16. Russia Africa Vanadium Production Value (US$ Million) Growth Rate (2018-2029)
- Figure 17. America Vanadium Production Value (US$ Million) Growth Rate (2018-2029)
- Figure 18. Europe (Ex. Russia) Vanadium Production Value (US$ Million) Growth Rate (2018-2029)
- Figure 19. North America Vanadium Consumption and Growth Rate (2018-2029) & (Tons)
- Figure 20. North America Vanadium Consumption Market Share by Country (2018-2029)
- Figure 21. U.S. Vanadium Consumption and Growth Rate (2018-2029) & (Tons)
- Figure 22. Canada Vanadium Consumption and Growth Rate (2018-2029) & (Tons)
- Figure 23. Europe Vanadium Consumption and Growth Rate (2018-2029) & (Tons)
- Figure 24. Europe Vanadium Consumption Market Share by Country (2018-2029)
- Figure 25. Germany Vanadium Consumption and Growth Rate (2018-2029) & (Tons)
- Figure 26. France Vanadium Consumption and Growth Rate (2018-2029) & (Tons)
- Figure 27. U.K. Vanadium Consumption and Growth Rate (2018-2029) & (Tons)
- Figure 28. Italy Vanadium Consumption and Growth Rate (2018-2029) & (Tons)
- Figure 29. Russia Vanadium Consumption and Growth Rate (2018-2029) & (Tons)
- Figure 30. Asia Pacific Vanadium Consumption and Growth Rate (2018-2029) & (Tons)
- Figure 31. Asia Pacific Vanadium Consumption Market Share by Region (2024-2029)
- Figure 32. China Vanadium Consumption and Growth Rate (2018-2029) & (Tons)
- Figure 33. Japan Vanadium Consumption and Growth Rate (2018-2029) & (Tons)
- Figure 34. Korea Vanadium Consumption and Growth Rate (2018-2029) & (Tons)
- Figure 35. Southeast Asia Vanadium Consumption and Growth Rate (2018-2029) & (Tons)
- Figure 36. India Vanadium Consumption and Growth Rate (2018-2029) & (Tons)
- Figure 37. Latin America Vanadium Consumption and Growth Rate (2018-2029) & (Tons)
- Figure 38. Latin America Vanadium Consumption Market Share by Country (2018-2029)
- Figure 39. Mexico Vanadium Consumption and Growth Rate (2018-2029) & (Tons)
- Figure 40. Brazil Vanadium Consumption and Growth Rate (2018-2029) & (Tons)
- Figure 41. Middle East & Africa Vanadium Consumption and Growth Rate (2018-2029) & (Tons)
- Figure 42. Middle East & Africa Vanadium Consumption Market Share by Country (2018-2029)
- Figure 43. Middle East Vanadium Consumption and Growth Rate (2018-2029) & (Tons)
- Figure 44. Africa Vanadium Consumption and Growth Rate (2018-2029) & (Tons)
- Figure 45. Vanadium Value Chain
- Figure 46. Bottom-up and Top-down Approaches for This Report
- Figure 47. Data Triangulation
The global Vanadium (CAS 7440-62-2) market was valued at USD 4.37 billion in 2022 and is expected to reach USD 6.59 billion by the end of 2029, growing at a CAGR of 6.99% between 2023 and 2029.The influence of COVID-19 and the Russia-Ukraine War were considered while estimating market sizes.
The major global manufacturers of Vanadium include: PGVT, Evraz, Beijing Jianlong, Treibacher Industrie, Chengyu, and etc. In 2022, the world's top five vendors accounted for approximately 51.75% of the revenue.
Report Scope
This report aims to provide a comprehensive presentation of the global market for Vanadium, with both quantitative and qualitative analysis, to help readers develop business/growth strategies, assess the market competitive situation, analyze their position in the current marketplace, and make informed business decisions regarding Vanadium.
The Vanadium market size, estimations, and forecasts are provided in terms of output/shipments (Tons) and revenue ($ millions), considering 2022 as the base year, with history and forecast data for the period from 2018 to 2029. This report segments the global Vanadium market comprehensively. Regional market sizes, concerning products, by Application, and by players, are also provided.
For a more in-depth understanding of the market, the report provides profiles of the competitive landscape, key competitors, and their respective market ranks. The report also discusses technological trends and new product developments.
The report will help the Vanadium manufacturers, new entrants, and industry chain related companies in this market with information on the revenues, production, and average price for the overall market and the sub-segments across the different segments, by company, by Application, and by regions.
By Company
- Pangang Group Vanadium and Titanium Resources Co.,Ltd.
- Evraz
- Hesteel Group
- Beijing Jianlong Heavy Industry Group Co., Ltd.
- Treibacher Industrie
- Glencore
- Chengyu Vanadium & Titanium Technology Co., Ltd.
- Desheng Group
- Largo Inc.
- Bushveld Minerals
- Da Steel
- U.S. Vanadium
- Shaanxi Youser
Segment by Application
- Steel Industry
- Chemical Industry
- Vanadium Alloys
- Energy Storage
- Others
Production by Region
- China
- Russia
- America
- Europe (Ex. Russia)
- Others
Consumption by Region
- North America
- U.S.
- Canada
- Asia-Pacific
- China
- Japan
- Korea
- Southeast Asia
- India
- Others
- Europe
- Germany
- UK
- France
- Russia
- Italy
- Others
- Latin America
- Mexico
- Brazil
- Others
- Middle East & Africa
Table of Contents
1 Vanadium Market Overview
- 1.1 Product Definition
- 1.2 Vanadium by Application
- 1.2.1 Global Vanadium Market Value Growth Rate Analysis by Application: 2022 VS 2029
- 1.2.2 Steel Industry
- 1.2.3 Chemical Industry
- 1.2.4 Vanadium Alloys
- 1.2.5 Energy Storage
- 1.3 Global Market Growth Prospects
- 1.3.1 Global Vanadium Production Value Estimates and Forecasts (2018-2029)
- 1.3.2 Global Vanadium Production Capacity Estimates and Forecasts (2018-2029)
- 1.3.3 Global Vanadium Production Estimates and Forecasts (2018-2029)
- 1.3.4 Global Vanadium Market Average Price Estimates and Forecasts (2018-2029)
- 1.4 Assumptions and Limitations
2 Market Competition by Manufacturers
- 2.1 Global Vanadium Production Value Market Share by Manufacturers (2018-2023)
- 2.2 Global Key Players of Vanadium, Industry Ranking, 2021 VS 2022
- 2.3 Global Vanadium Market Share by Company Type (Tier 1, Tier 2, and Tier 3)
- 2.4 Global Vanadium Average Price by Manufacturers (2018-2023)
- 2.5 Global Key Manufacturers of Vanadium, Sales Regions and Headquarters
- 2.6 Global Key Manufacturers of Vanadium, Product Offered
- 2.7 Vanadium Market Competitive Situation and Trends
- 2.7.1 Vanadium Market Concentration Rate
- 2.7.2 Global 5 Largest Vanadium Players Market Share by Revenue
- 2.8 Potential New Entrants Introduction
- 2.8.1 Australian Vanadium Ltd.
- 2.8.2 CNNC Hua Yuan
- 2.8.3 AMG Vanadium
- 2.8.4 Longbai Group
3 Vanadium Production by Region
- 3.1 Global Vanadium Production Value Estimates and Forecasts by Region: 2018 VS 2022 VS 2029
- 3.2 Global Vanadium Production Value by Region (2018-2029)
- 3.2.1 Global Vanadium Production Value Market Share by Region (2018-2023)
- 3.2.2 Global Forecasted Production Value of Vanadium by Region (2024-2029)
- 3.3 Global Vanadium Production Estimates and Forecasts by Region: 2018 VS 2022 VS 2029
- 3.4 Global Vanadium Production by Region (2018-2029)
- 3.4.1 Global Vanadium Production Market Share by Region (2018-2023)
- 3.4.2 Global Forecasted Production of Vanadium by Region (2024-2029)
- 3.5 Global Vanadium Market Price Analysis by Region (2018-2023)
- 3.6 Global Vanadium Production and Value, Year-over-Year Growth
- 3.6.1 China Vanadium Production Value Estimates and Forecasts (2018-2029)
- 3.6.2 Russia Vanadium Production Value Estimates and Forecasts (2018-2029)
- 3.6.3 America Vanadium Production Value Estimates and Forecasts (2018-2029)
- 3.6.4 Europe (Ex. Russia) Vanadium Production Value Estimates and Forecasts (2018-2029)
4 Vanadium Consumption by Region
- 4.1 Global Vanadium Consumption Estimates and Forecasts by Region: 2018 VS 2022 VS 2029
- 4.2 Global Vanadium Consumption by Region (2018-2029)
- 4.2.1 Global Vanadium Consumption by Region (2018-2029)
- 4.2.2 Global Vanadium Forecasted Consumption by Region (2024-2029)
- 4.3 North America
- 4.3.1 North America Vanadium Consumption Growth Rate by Country: 2018 VS 2022 VS 2029
- 4.3.2 North America Vanadium Consumption by Country (2018-2029)
- 4.3.3 U.S.
- 4.3.4 Canada
- 4.4 Europe
- 4.4.1 Europe Vanadium Consumption Growth Rate by Country: 2018 VS 2022 VS 2029
- 4.4.2 Europe Vanadium Consumption by Country (2018-2029)
- 4.4.3 Germany
- 4.4.4 France
- 4.4.5 U.K.
- 4.4.6 Italy
- 4.4.7 Russia
- 4.5 Asia Pacific
- 4.5.1 Asia Pacific Vanadium Consumption Growth Rate by Country: 2018 VS 2022 VS 2029
- 4.5.2 Asia Pacific Vanadium Consumption by Region (2018-2029)
- 4.5.3 China
- 4.5.4 Japan
- 4.5.5 Korea
- 4.5.6 Southeast Asia
- 4.5.7 India
- 4.6 Latin America
- 4.6.1 Latin America Vanadium Consumption Growth Rate by Country: 2018 VS 2022 VS 2029
- 4.6.2 Latin America Vanadium Consumption by Country (2018-2029)
- 4.6.3 Mexico
- 4.6.4 Brazil
- 4.7 Middle East & Africa
- 4.7.1 Middle East & Africa Vanadium Consumption Growth Rate by Country: 2018 VS 2022 VS 2029
- 4.7.2 Middle East & Africa Vanadium Consumption by Country (2018-2029)
- 4.7.3 Middle East
- 4.7.4 Africa
5 Segment by Application
- 5.1 Global Vanadium Production by Application (2018-2029)
- 5.1.1 Global Vanadium Production by Application (2018-2023)
- 5.1.2 Global Vanadium Production by Application (2024-2029)
- 5.1.3 Global Vanadium Production Market Share by Application (2018-2029)
- 5.2 Global Vanadium Production Value by Application (2018-2029)
- 5.2.1 Global Vanadium Production Value by Application (2018-2023)
- 5.2.2 Global Vanadium Production Value by Application (2024-2029)
- 5.2.3 Global Vanadium Production Value Market Share by Application (2018-2029)
- 5.3 Global Vanadium Price by Application (2018-2029)
6 Key Companies Profiled
- 6.1 PGVT
- 6.1.1 PGVT Vanadium Company Information
- 6.1.2 PGVT Vanadium Product Portfolio
- 6.1.3 PGVT Vanadium Production, Value, Price and Gross Margin (2018-2023)
- 6.1.4 PGVT Main Business and Markets Served
- 6.2 Evraz
- 6.2.1 Evraz Vanadium Company Information
- 6.2.2 Evraz Vanadium Product Portfolio
- 6.2.3 Evraz Vanadium Production, Value, Price and Gross Margin (2018-2023)
- 6.2.4 Evraz Main Business and Markets Served
- 6.3 Hesteel Group
- 6.3.1 Hesteel Group Vanadium Company Information
- 6.3.2 Hesteel Group Vanadium Product Portfolio
- 6.3.3 Hesteel Group Vanadium Production, Value, Price and Gross Margin (2018-2023)
- 6.3.4 Hesteel Group Main Business and Markets Served
- 6.4 Beijing Jianlong
- 6.4.1 Beijing Jianlong Vanadium Company Information
- 6.4.2 Beijing Jianlong Vanadium Product Portfolio
- 6.4.3 Beijing Jianlong Vanadium Production, Value, Price and Gross Margin (2018-2023)
- 6.4.4 Beijing Jianlong Main Business and Markets Served
- 6.5 Treibacher Industrie
- 6.5.1 Treibacher Industrie Vanadium Company Information
- 6.5.2 Treibacher Industrie Vanadium Product Portfolio
- 6.5.3 Treibacher Industrie Vanadium Production, Value, Price and Gross Margin (2018-2023)
- 6.5.4 Treibacher Industrie Main Business and Markets Served
- 6.6 Glencore
- 6.6.1 Glencore Vanadium Company Information
- 6.6.2 Glencore Vanadium Product Portfolio
- 6.6.3 Glencore Vanadium Production, Value, Price and Gross Margin (2018-2023)
- 6.6.4 Glencore Main Business and Markets Served
- 6.7 Chengyu
- 6.7.1 Chengyu Vanadium Company Information
- 6.7.2 Chengyu Vanadium Product Portfolio
- 6.7.3 Chengyu Vanadium Production, Value, Price and Gross Margin (2018-2023)
- 6.7.4 Chengyu Main Business and Markets Served
- 6.8 Desheng Group
- 6.8.1 Desheng Group Vanadium Company Information
- 6.8.2 Desheng Group Vanadium Product Portfolio
- 6.8.3 Desheng Group Vanadium Production, Value, Price and Gross Margin (2018-2023)
- 6.8.4 Desheng Group Main Business and Markets Served
- 6.9 Largo Inc.
- 6.9.1 Largo Inc. Vanadium Company Information
- 6.9.2 Largo Inc. Vanadium Product Portfolio
- 6.9.3 Largo Inc. Vanadium Production, Value, Price and Gross Margin (2018-2023)
- 6.9.4 Largo Inc. Main Business and Markets Served
- 6.10 Bushveld Minerals
- 6.10.1 Bushveld Minerals Vanadium Company Information
- 6.10.2 Bushveld Minerals Vanadium Product Portfolio
- 6.10.3 Bushveld Minerals Vanadium Production, Value, Price and Gross Margin (2018-2023)
- 6.10.4 Bushveld Minerals Main Business and Markets Served
- 6.11 Da Steel Industry
- 6.11.1 Da Steel Industry Vanadium Company Information
- 6.11.2 Da Steel Industry Vanadium Product Portfolio
- 6.11.3 Da Steel Industry Vanadium Production, Value, Price and Gross Margin (2018-2023)
- 6.11.4 Da Steel Industry Main Business and Markets Served
- 6.12 U.S. Vanadium
- 6.12.1 U.S. Vanadium Vanadium Company Information
- 6.12.2 U.S. Vanadium Vanadium Product Portfolio
- 6.12.3 U.S. Vanadium Vanadium Production, Value, Price and Gross Margin (2018-2023)
- 6.12.4 U.S. Vanadium Main Business and Markets Served
- 6.13 Shaanxi Youser
- 6.13.1 Shaanxi Youser Vanadium Company Information
- 6.13.2 Shaanxi Youser Vanadium Product Portfolio
- 6.13.3 Shaanxi Youser Vanadium Production, Value, Price and Gross Margin (2018-2023)
- 6.13.4 Shaanxi Youser Main Business and Markets Served
7 Industry Chain and Sales Channels Analysis
- 7.1 Vanadium Industry Chain Analysis
- 7.2 Vanadium Key Raw Materials
- 7.2.1 Key Raw Materials
- 7.2.2 Raw Materials Key Suppliers
- 7.3 Vanadium Extraction Mode & Process
- 7.4 Vanadium Sales and Marketing
- 7.4.1 Vanadium Sales Channels
- 7.4.2 Vanadium Distributors
- 7.5 Vanadium Customers
8 Vanadium Market Dynamics
- 8.1 Vanadium Industry Trends
- 8.2 Vanadium Market Drivers
- 8.3 Vanadium Market Restraints
- 8.4 Vanadium Market Challenges
9 Research Findings and Conclusion
10 Methodology and Data Source
- 10.1 Methodology/Research Approach
- 10.1.1 Research Programs/Design
- 10.1.2 Market Size Estimation
- 10.1.3 Market Breakdown and Data Triangulation
- 10.2 Data Source
- 10.2.1 Secondary Sources
- 10.2.2 Primary Sources
- 10.3 Author List
- 10.4 Disclaimer