|
|
市場調査レポート
商品コード
1751573
バナジウムの市場規模、シェア、動向分析レポート:用途別、地域別、セグメント予測、2025年~2030年Vanadium Market Size, Share & Trends Analysis Report By Application (Steel, Non-ferrous Alloys, Chemicals, Energy Storage), By Region (North America, Europe, Asia Pacific, CSA, MEA), And Segment Forecasts, 2025 - 2030 |
||||||
|
|||||||
カスタマイズ可能
|
|||||||

| バナジウムの市場規模、シェア、動向分析レポート:用途別、地域別、セグメント予測、2025年~2030年 |
|
出版日: 2025年05月28日
発行: Grand View Research
ページ情報: 英文 100 Pages
納期: 2~10営業日
|

全表示
- 概要
- 図表
- 目次
バナジウムの市場規模と動向:
世界のバナジウム市場規模は2024年に27億4,000万米ドルと推定され、2025年から2030年にかけてCAGR 3.1%で成長すると推定されます。
建設、自動車、機械、輸送セクターからの需要増に牽引された粗鋼生産の増加が、今後数年間のバナジウム需要を後押ししています。
建設、自動車、機械、輸送セクターからの需要増に牽引された粗鋼生産の増加が、今後数年間のバナジウム需要を促進しています。バナジウムは主に合金元素として鉄鋼製造に利用され、鉄鋼の強度、耐久性、耐摩耗性を高める。建設、自動車、航空宇宙産業で高強度鋼のニーズが高まっていることが、バナジウム消費を引き続き促進しています。また、インフラや工業製造業への世界の投資の増加がバナジウム需要を押し上げています。例えば、国際エネルギー機関(IEA)の報告によると、世界のインフラ投資は2019年の3兆2,000億米ドルから2023年には3兆8,000億米ドルに増加し、高強度鋼の需要を牽引し、バナジウム産業を牽引すると予想されています。
世界のバナジウム市場は、その消費量の約90%を占める高強度鋼の生産に不可欠な役割によって、着実な成長を遂げています。鉄鋼の強度、耐久性、耐食性を向上させるバナジウムの能力は、建設、自動車、重機械などの主要分野で不可欠です。世界鉄鋼協会によると、世界の粗鋼生産量は2019年の18億7,860万トンから2023年には18億9,260万トンに増加し、鉄鋼集約型産業からの安定した需要軌道を裏付けています。
バナジウム・レドックス・フロー電池(VRFB)は、稼働寿命が長く、拡張性があり、グリッド規模のエネルギー貯蔵に適しているため、脚光を浴びています。中国の100MW/400MWhの大連VRFB設置などのプロジェクトは、再生可能エネルギー供給を安定化させるバナジウムの可能性を浮き彫りにしています。バナジウム基合金は中性子吸収率が低く、極端な温度や腐食に対する耐性が高いため、最新型原子炉での使用が増加しています。
新興国市場は、都市化とインフラ開拓が鉄鋼消費を牽引しているため、勢いを増しています。オーストラリアや米国をはじめとする国々がバナジウムの国産化に取り組んでいるのも、重要な鉱物のサプライチェーンを確保することに対する地政学的関心の高まりを反映しています。クリーンエネルギーとカーボンニュートラルの目標が優先されるなか、エネルギー貯蔵とクリーン発電の両方を可能にするバナジウムの役割は、バナジウムを戦略的に重要な素材にしています。
目次
第1章 調査手法と範囲
第2章 エグゼクティブサマリー
第3章 バナジウム市場の変数、動向、範囲
- 市場系統の見通し
- 親市場の見通し
- 関連市場見通し
- 業界バリューチェーン分析
- 規制の枠組み
- 市場力学
- 市場促進要因分析
- 市場抑制要因分析
- 業界の課題
- 業界の機会
- 業界分析ツール
- ポーターのファイブフォース分析
- マクロ環境分析
第4章 バナジウム市場:用途推定・動向分析
- セグメントダッシュボード
- バナジウム市場:用途変動分析と市場シェア、2024年と2030年
- 鋼鉄
- 非鉄合金
- 化学薬品
- エネルギー貯蔵
第5章 バナジウム市場:地域推定・動向分析
- 地域変動分析と市場シェア、2024年と2030年
- 北米
- 米国
- カナダ
- メキシコ
- 欧州
- ドイツ
- フランス
- イタリア
- アジア太平洋
- 中国
- 日本
- インド
- 中南米
- ブラジル
- 中東・アフリカ
第6章 バナジウム市場-競合情勢
- 主要市場参入企業による最近の動向と影響分析
- 企業分類
- 企業ヒートマップ
- ポジション分析、2024年
- 戦略マッピング
- 拡大
- 合併と買収
- パートナーシップとコラボレーション
- 新しいアプリケーションのリリース
- 研究開発
- 企業プロファイル
- AMG
- Aura Energy Ltd
- Australian Vanadium Limited
- Bushveld Minerals
- EVRAZ plc
- Glencore
- HBIS Group
- Largo, Inc.
- Pangang Group Vanadium and Titanium Resources Co., Ltd.
- Vanadium Resources Limited
List of Tables
- Table 1 List Of Abbreviations
- Table 2 Global Vanadium Market Estimates and Forecasts by Application, 2018 - 2030 (Kilotons)
- Table 3 Global Vanadium Market Estimates and Forecasts by Application, 2018 - 2030 (USD Million)
- Table 4 Global Vanadium Market Estimates and Forecasts by Region, 2018 - 2030 (Kilotons)
- Table 5 Global Vanadium Market Estimates and Forecasts by Region, 2018 - 2030 (USD Million)
- Table 6 North America Vanadium Market Estimates and Forecasts by Country, 2018 - 2030 (Kilotons)
- Table 7 North America Vanadium Market Estimates and Forecasts by Country, 2018 - 2030 (USD Million)
- Table 8 North America Vanadium Market Estimates and Forecasts by Application, 2018 - 2030 (Kilotons)
- Table 9 North America Vanadium Market Estimates and Forecasts by Application, 2018 - 2030 (USD Million)
- Table 10 U.S. Macroeconomic Outlay
- Table 11 U.S. Vanadium Market Estimates and Forecasts by Application, 2018 - 2030 (Kilotons)
- Table 12 U.S. Vanadium Market Estimates and Forecasts by Application, 2018 - 2030 (USD Million)
- Table 13 Canada Macroeconomic Outlay
- Table 14 Canada Vanadium Market Estimates and Forecasts by Application, 2018 - 2030 (Kilotons)
- Table 15 Canada Vanadium Market Estimates and Forecasts by Application, 2018 - 2030 (USD Million)
- Table 16 Mexico Macroeconomic Outlay
- Table 17 Mexico Vanadium Market Estimates and Forecasts by Application, 2018 - 2030 (Kilotons)
- Table 18 Mexico Vanadium Market Estimates and Forecasts by Application, 2018 - 2030 (USD Million)
- Table 19 Europe Vanadium Market Estimates and Forecasts by Application, 2018 - 2030 (Kilotons)
- Table 20 Europe Vanadium Market Estimates and Forecasts by Application, 2018 - 2030 (USD Million)
- Table 21 Germany Macroeconomic Outlay
- Table 22 Germany Vanadium Market Estimates and Forecasts by Application, 2018 - 2030 (Kilotons)
- Table 23 Germany Vanadium Market Estimates and Forecasts by Application, 2018 - 2030 (USD Million)
- Table 24 France Macroeconomic Outlay
- Table 25 France Vanadium Market Estimates and Forecasts by Application, 2018 - 2030 (Kilotons)
- Table 26 France Vanadium Market Estimates and Forecasts by Application, 2018 - 2030 (USD Million)
- Table 27 Italy Macroeconomic Outlay
- Table 28 Italy Vanadium Market Estimates and Forecasts by Application, 2018 - 2030 (Kilotons)
- Table 29 Italy Vanadium Market Estimates and Forecasts by Application, 2018 - 2030 (USD Million)
- Table 30 Asia Pacific Vanadium Market Estimates and Forecasts by Application, 2018 - 2030 (Kilotons)
- Table 31 Asia Pacific Vanadium Market Estimates and Forecasts by Application, 2018 - 2030 (USD Million)
- Table 32 China Macroeconomic Outlay
- Table 33 China Vanadium Market Estimates and Forecasts by Application, 2018 - 2030 (Kilotons)
- Table 34 China Vanadium Market Estimates and Forecasts by Application, 2018 - 2030 (USD Million)
- Table 35 Japan Macroeconomic Outlay
- Table 36 Japan Vanadium Market Estimates and Forecasts by Application, 2018 - 2030 (Kilotons)
- Table 37 Japan Vanadium Market Estimates and Forecasts by Application, 2018 - 2030 (USD Million)
- Table 38 India Macroeconomic Outlay
- Table 39 India Vanadium Market Estimates and Forecasts by Application, 2018 - 2030 (Kilotons)
- Table 40 India Vanadium Market Estimates and Forecasts by Application, 2018 - 2030 (USD Million)
- Table 41 Central & South America Vanadium Market Estimates and Forecasts by Application, 2018 - 2030 (Kilotons)
- Table 42 Central & South America Vanadium Market Estimates and Forecasts by Application, 2018 - 2030 (USD Million)
- Table 43 Brazil Macroeconomic Outlay
- Table 44 Brazil Vanadium Market Estimates and Forecasts by Application, 2018 - 2030 (Kilotons)
- Table 45 Brazil Vanadium Market Estimates and Forecasts by Application, 2018 - 2030 (USD Million)
- Table 46 Middle East & Africa Vanadium Market Estimates and Forecasts by Application, 2018 - 2030 (Kilotons)
- Table 47 Middle East & Africa Vanadium Market Estimates and Forecasts by Application, 2018 - 2030 (USD Million)
List of Figures
- Fig. 1 Market Research Process
- Fig. 2 Data Triangulation Techniques
- Fig. 3 Primary Research Pattern
- Fig. 4 Market Research Approaches
- Fig. 5 QFD Modeling for Market Share Assessment
- Fig. 6 Information Procurement
- Fig. 7 Market Formulation and Validation
- Fig. 8 Data Validating & Publishing
- Fig. 9 Market Segmentation & Scope
- Fig. 10 Vanadium Market Snapshot
- Fig. 11 Segment Snapshot (1/2)
- Fig. 12 Segment Snapshot (1/2)
- Fig. 13 Competitive Landscape Snapshot
- Fig. 14 Parent Market Outlook
- Fig. 15 Vanadium Market - Value Chain Analysis
- Fig. 16 Vanadium Market - Market Dynamics
- Fig. 17 Vanadium Market - PORTER's Analysis
- Fig. 18 Vanadium Market - PESTEL Analysis
- Fig. 19 Vanadium Market Estimates & Forecasts, By Application: Key Takeaways
- Fig. 20 Vanadium Market Share, By Application, 2024 & 2030
- Fig. 21 Steel Market Estimates & Forecasts, 2018 - 2030 (USD Million, Kilotons)
- Fig. 22 Non-Ferrous Alloys Market Estimates & Forecasts, 2018 - 2030 (USD Million, Kilotons)
- Fig. 23 Chemicals Market Estimates & Forecasts, 2018 - 2030 (USD Million, Kilotons)
- Fig. 24 Energy Storage Market Estimates & Forecasts, 2018 - 2030 (USD Million, Kilotons)
- Fig. 25 Vanadium Market Revenue, By Region, 2024 & 2030 (USD Million)
- Fig. 26 Vanadium Market Estimates & Forecasts, 2018 - 2030 (USD Million, Kilotons)
- Fig. 27 North America Vanadium Market Estimates & Forecasts, 2018 - 2030 (USD Million, Kilotons)
- Fig. 28 U.S. Vanadium Market Estimates & Forecasts, 2018 - 2030 (USD Million, Kilotons)
- Fig. 29 Canada Vanadium Market Estimates & Forecasts, 2018 - 2030 (USD Million, Kilotons)
- Fig. 30 Mexico Vanadium Market Estimates & Forecasts, 2018 - 2030 (USD Million, Kilotons)
- Fig. 31 Europe Vanadium Market Estimates & Forecasts, 2018 - 2030 (USD Million, Kilotons)
- Fig. 32 Germany Vanadium Market Estimates & Forecasts, 2018 - 2030 (USD Million, Kilotons)
- Fig. 33 France Vanadium Market Estimates & Forecasts, 2018 - 2030 (USD Million, Kilotons)
- Fig. 34 Italy Vanadium Market Estimates & Forecasts, 2018 - 2030 (USD Million, Kilotons)
- Fig. 35 Asia Pacific Vanadium Market Estimates & Forecasts, 2018 - 2030 (USD Million, Kilotons)
- Fig. 36 China Vanadium Market Estimates & Forecasts, 2018 - 2030 (USD Million, Kilotons)
- Fig. 37 Japan Vanadium Market Estimates & Forecasts, 2018 - 2030 (USD Million, Kilotons)
- Fig. 38 India Vanadium Market Estimates & Forecasts, 2018 - 2030 (USD Million, Kilotons)
- Fig. 39 Central & South America Vanadium Market Estimates & Forecasts, 2018 - 2030 (USD Million, Kilotons)
- Fig. 40 Brazil Vanadium Market Estimates & Forecasts, 2018 - 2030 (USD Million, Kilotons)
- Fig. 41 Middle East & Africa Vanadium Market Estimates & Forecasts, 2018 - 2030 (USD Million, Kilotons)
- Fig. 42 Company Market Positioning
- Fig. 43 Strategy Mapping
Vanadium Market Size & Trends:
The global vanadium market size was estimated at USD 2.74 billion in 2024 and is estimated to grow at a CAGR of 3.1% from 2025 to 2030. Rising crude steel production, driven by growing demand from the construction, automotive, machinery, and transportation sectors, is encouraging the demand for vanadium in the coming years.
Rising crude steel production, driven by growing demand from the construction, automotive, machinery, and transportation sectors, is encouraging the demand for vanadium in the coming years. Vanadium is mainly utilized as an alloying element in steel manufacturing, as it enhances steel's strength, durability, and resistance to wear. The increasing need for high-strength steel across construction, automotive, and aerospace industries continues to propel vanadium consumption. Besides rising global investments in infrastructure and industrial manufacturing is boosting the demand for vanadium . For instance, as reported by the International Energy Agency (IEA), global investment in infrastructure rose from USD 3.2 trillion in 2019 to USD 3.8 trillion in 2023, which in turn is expected to drive the demand for high-strength steel and subsequently propelling the vanadium industry.
The global vanadium market is experiencing steady growth, driven by its essential role in high-strength steel production, which accounts for approximately 90% of its consumption. Vanadium's ability to enhance the strength, durability, and corrosion resistance of steel makes it indispensable in key sectors such as construction, automotive, and heavy machinery. According to the World Steel Association, global crude steel output increased from 1,878.6 million tons in 2019 to 1,892.6 million tons in 2023, underscoring a stable demand trajectory from steel-intensive industries.
The market is also benefiting from the global shift toward renewable energy, with vanadium redox flow batteries (VRFBs) gaining prominence due to their long operational lifespan, scalability, and suitability for grid-scale energy storage. Projects such as China's 100 MW/400 MWh Dalian VRFB installation highlight vanadium's potential in stabilizing renewable energy supply. Additionally, the nuclear sector presents another avenue for demand, as vanadium-based alloys are increasingly used in advanced reactors due to their low neutron absorption and high resistance to extreme temperatures and corrosion.
Emerging markets are creating momentum, as urbanization and infrastructure development drive steel consumption. Efforts by countries including Australia and the U.S. to develop domestic vanadium sources also reflect growing geopolitical interest in securing critical mineral supply chains. As clean energy and carbon neutrality goals being prioritized, vanadium's role in enabling both energy storage and clean power generation is making it a material of strategic importance.
Global Vanadium Market Report Segmentation
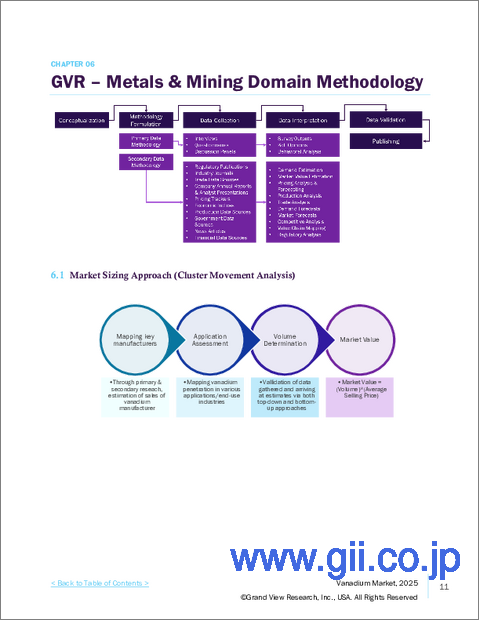
This report forecasts revenue growth at global, regional, and country levels and provides an analysis of the latest industry trends in each of the sub-segments from 2018 to 2030. For this study, Grand View Research has segmented the global vanadium market report based on application and region.
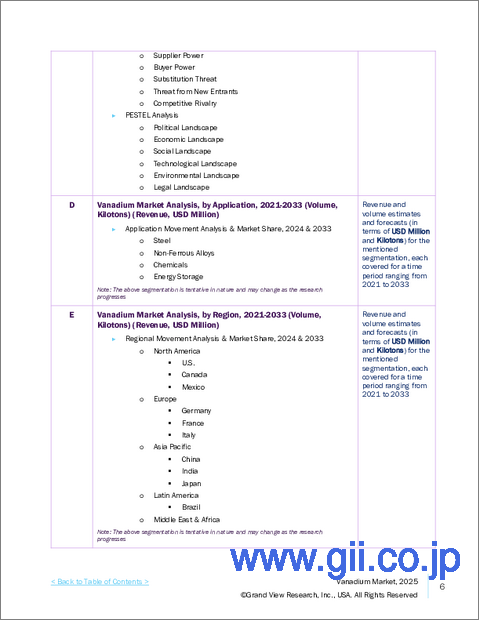
- Application Outlook (Revenue, USD Million, 2018 - 2030)
- Steel
- Non-Ferrous Alloys
- Chemicals
- Energy Storage
- Regional Outlook (Revenue, USD Million, 2018 - 2030)
- North America
- U.S.
- Canada
- Mexico
- Europe
- Germany
- France
- Italy
- Asia Pacific
- China
- Japan
- India
- Central & South America
- Brazil
- Middle East and Africa (MEA)
Table of Contents
Chapter 1. Methodology and Scope
- 1.1. Market Segmentation & Scope
- 1.2. Market Definition
- 1.3. Information Procurement
- 1.3.1. Purchased Database
- 1.3.2. GVR's Internal Database
- 1.3.3. Secondary Sources & Third-Party Perspectives
- 1.3.4. Primary Research
- 1.4. Information Analysis
- 1.4.1. Data Analysis Models
- 1.5. Market Formulation & Data Visualization
- 1.6. Data Validation & Publishing
Chapter 2. Executive Summary
- 2.1. Market Snapshot
- 2.2. Segment Snapshot
- 2.3. Competitive Landscape Snapshot
Chapter 3. Vanadium Market Variables, Trends & Scope
- 3.1. Market Lineage Outlook
- 3.1.1. Parent Market Outlook
- 3.1.2. Related Market Outlook
- 3.2. Industry Value Chain Analysis
- 3.3. Regulatory Framework
- 3.4. Market Dynamics
- 3.4.1. Market Driver Analysis
- 3.4.2. Market Restraint Analysis
- 3.4.3. Industry Challenges
- 3.4.4. Industry Opportunities
- 3.5. Industry Analysis Tools
- 3.5.1. Porter's Five Forces Analysis
- 3.5.2. Macro-environmental Analysis
Chapter 4. Vanadium Market: Application Estimates & Trend Analysis
- 4.1. Segment Dashboard
- 4.2. Vanadium Market: Application Movement Analysis & Market Share, 2024 & 2030
- 4.3. Steel
- 4.3.1. Steel Market Revenue Estimates and Forecasts, 2018 - 2030 (USD Million, Kilotons)
- 4.4. Non-Ferrous Alloys
- 4.4.1. Non-Ferrous Alloys Market Revenue Estimates and Forecasts, 2018 - 2030 (USD Million, Kilotons)
- 4.5. Chemicals
- 4.5.1. Chemicals Market Revenue Estimates and Forecasts, 2018 - 2030 (USD Million, Kilotons)
- 4.6. Energy Storage
- 4.6.1. Energy Storage Market Revenue Estimates and Forecasts, 2018 - 2030 (USD Million, Kilotons)
Chapter 5. Vanadium Market: Region Estimates & Trend Analysis
- 5.1. Regional Movement Analysis & Market Share, 2024 & 2030
- 5.2. North America
- 5.2.1. North America Vanadium Market Estimates & Forecast, 2018 - 2030 (USD Million, Kilotons)
- 5.2.2. U.S.
- 5.2.2.1. Key country dynamics
- 5.2.2.2. U.S. vanadium market estimates & forecast, 2018 - 2030 (USD Million, Kilotons)
- 5.2.3. Canada
- 5.2.3.1. Key country dynamics
- 5.2.3.2. Canada vanadium market estimates & forecast, 2018 - 2030 (USD Million, Kilotons)
- 5.2.4. Mexico
- 5.2.4.1. Key country dynamics
- 5.2.4.2. Mexico vanadium market estimates & forecast, 2018 - 2030 (USD Million, Kilotons)
- 5.3. Europe
- 5.3.1. Europe Vanadium Market Estimates & Forecast, 2018 - 2030 (USD Million, Kilotons)
- 5.3.2. Germany
- 5.3.2.1. Key country dynamics
- 5.3.2.2. Germany vanadium market estimates & forecast, 2018 - 2030 (USD Million, Kilotons)
- 5.3.3. France
- 5.3.3.1. Key country dynamics
- 5.3.3.2. France vanadium market estimates & forecast, 2018 - 2030 (USD Million, Kilotons)
- 5.3.4. Italy
- 5.3.4.1. Key country dynamics
- 5.3.4.2. Italy vanadium market estimates & forecast, 2018 - 2030 (USD Million, Kilotons)
- 5.4. Asia Pacific
- 5.4.1. Asia Pacific Vanadium Market Estimates & Forecast, 2018 - 2030 (USD Million, Kilotons)
- 5.4.2. China
- 5.4.2.1. Key country dynamics
- 5.4.2.2. China vanadium market estimates & forecast, 2018 - 2030 (USD Million, Kilotons)
- 5.4.3. Japan
- 5.4.3.1. Key country dynamics
- 5.4.3.2. Japan vanadium market estimates & forecast, 2018 - 2030 (USD Million, Kilotons)
- 5.4.4. India
- 5.4.4.1. Key country dynamics
- 5.4.4.2. India vanadium market estimates & forecast, 2018 - 2030 (USD Million, Kilotons)
- 5.5. Central & South America
- 5.5.1. Central & South America Vanadium Market Estimates & Forecast, 2018 - 2030 (USD Million, Kilotons)
- 5.5.2. Brazil
- 5.5.2.1. Key country dynamics
- 5.5.2.2. Brazil vanadium market estimates & forecast, 2018 - 2030 (Kilotons)
- 5.6. Middle East & Africa
- 5.6.1. Middle East & Africa Vanadium Market Estimates & Forecast, 2018 - 2030 (USD Million, Kilotons)
Chapter 6. Vanadium market - Competitive Landscape
- 6.1. Recent Developments & Impact Analysis, By Key Market Participants
- 6.2. Company Categorization
- 6.3. Company Heat Map
- 6.4. Position Analysis, 2024
- 6.5. Strategy Mapping
- 6.5.1. Expansion
- 6.5.2. Mergers & Acquisition
- 6.5.3. Partnerships & Collaborations
- 6.5.4. New Application Launches
- 6.5.5. Research And Development
- 6.6. Company Profiles
- 6.6.1. AMG
- 6.6.1.1. Participant's overview
- 6.6.1.2. Financial performance
- 6.6.1.3. Application benchmarking
- 6.6.1.4. Recent developments
- 6.6.2. Aura Energy Ltd
- 6.6.2.1. Participant's overview
- 6.6.2.2. Financial performance
- 6.6.2.3. Application benchmarking
- 6.6.2.4. Recent developments
- 6.6.3. Australian Vanadium Limited
- 6.6.3.1. Participant's overview
- 6.6.3.2. Financial performance
- 6.6.3.3. Application benchmarking
- 6.6.3.4. Recent developments
- 6.6.4. Bushveld Minerals
- 6.6.4.1. Participant's overview
- 6.6.4.2. Financial performance
- 6.6.4.3. Application benchmarking
- 6.6.4.4. Recent developments
- 6.6.5. EVRAZ plc
- 6.6.5.1. Participant's overview
- 6.6.5.2. Financial performance
- 6.6.5.3. Application benchmarking
- 6.6.5.4. Recent developments
- 6.6.6. Glencore
- 6.6.6.1. Participant's overview
- 6.6.6.2. Financial performance
- 6.6.6.3. Application benchmarking
- 6.6.6.4. Recent developments
- 6.6.7. HBIS Group
- 6.6.7.1. Participant's overview
- 6.6.7.2. Financial performance
- 6.6.7.3. Application benchmarking
- 6.6.7.4. Recent developments
- 6.6.8. Largo, Inc.
- 6.6.8.1. Participant's overview
- 6.6.8.2. Financial performance
- 6.6.8.3. Application benchmarking
- 6.6.8.4. Recent developments
- 6.6.9. Pangang Group Vanadium and Titanium Resources Co., Ltd.
- 6.6.9.1. Participant's overview
- 6.6.9.2. Financial performance
- 6.6.9.3. Application benchmarking
- 6.6.9.4. Recent developments
- 6.6.10. Vanadium Resources Limited
- 6.6.10.1. Participant's overview
- 6.6.10.2. Financial performance
- 6.6.10.3. Application benchmarking
- 6.6.10.4. Recent developments
- 6.6.1. AMG

