|
|
市場調査レポート
商品コード
1583090
高齢者・障害者支援ソリューションの世界市場 2024-2028年Global Elderly and Disabled Assistive Solutions Market 2024-2028 |
||||||

|
|||||||
カスタマイズ可能
|
|||||||


| 高齢者・障害者支援ソリューションの世界市場 2024-2028年 |
|
出版日: 2024年08月15日
発行: TechNavio
ページ情報: 英文 178 Pages
納期: 即納可能
|

全表示
- 概要
- 図表
- 目次
高齢者・障害者支援ソリューション市場 2024-2028年
高齢者・障害者支援ソリューション市場は2023-2028年に156億600万米ドル、予測期間中のCAGRは8.09%で成長すると予測されます。当レポートでは、高齢者・障害者支援ソリューション市場の全体的な分析、市場規模・予測、動向、成長促進要因、課題、約25のベンダーを網羅したベンダー分析などを掲載しています。
現在の市場シナリオ、最新動向と促進要因、市場環境全体に関する最新分析を提供しています。市場を牽引しているのは、政府やNGOによる取り組み、障害者や高齢者の増加、重傷を負う交通事故の増加などです。
| 市場範囲 | |
|---|---|
| 基準年 | 2024 |
| 終了年 | 2028 |
| 予測期間 | 2024-2028 |
| 成長モメンタム | 加速 |
| 前年比2024年 | 7.32% |
| CAGR | 8.09% |
| 増分額 | 156億600万米ドル |
本調査では、今後数年間における高齢者・障害者支援ソリューション市場の成長を促進する主な要因の1つとして、カスタマイズ化の進展を挙げています。また、オンライン小売の増加や医療ツーリズムの成長も市場の大きな需要につながります。
目次
第1章 エグゼクティブサマリー
- 市場概要
第2章 市場情勢
- 市場エコシステム
- 市場の特徴
- バリューチェーン分析
第3章 市場規模の評価
- 市場の定義
- 市場セグメント分析
- 市場規模 2023
- 市場の見通し 2023-2028
第4章 市場規模実績
- 高齢者・障害者支援ソリューションの世界市場 2018-2022
- 製品別セグメント分析 2018-2022
- エンドユーザー別セグメント分析 2018-2022
- 地域別セグメント分析 2018-2022
- 国別セグメント分析 2018-2022
第5章 ファイブフォース分析
- ファイブフォースの要約
- 買い手の交渉力
- 供給企業の交渉力
- 新規参入業者の脅威
- 代替品の脅威
- 競争の脅威
- 市況
第6章 市場セグメンテーション:製品別
- 市場セグメンテーション
- 比較:製品別
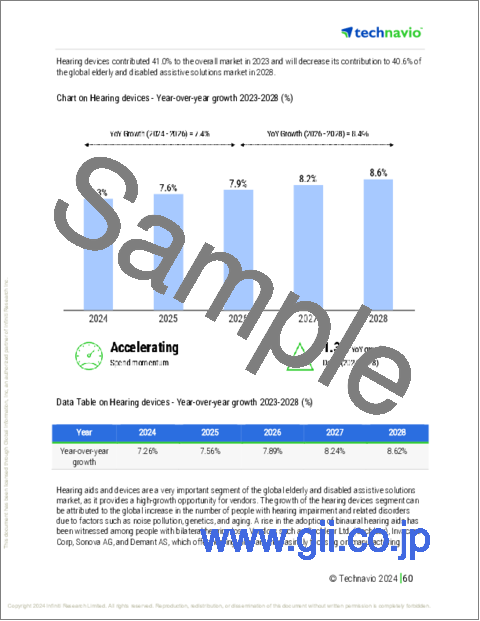
- 補聴器:市場規模と予測 2023-2028
- 移動および歩行補助器具:市場規模と予測 2023-2028
- ヘルスケア家具とBSE:市場規模と予測 2023-2028
- 視覚と読書補助:市場規模と予測 2023-2028
- 製品別の市場機会
第7章 市場セグメンテーション:エンドユーザー別
- 市場セグメンテーション
- 比較:エンドユーザー別
- 病院:市場規模と予測 2023-2028
- 在宅ケア環境:市場規模と予測 2023-2028
- 老人ホーム:市場規模と予測 2023-2028
- 介護施設:市場規模と予測 2023-2028
- エンドユーザー別の市場機会
第8章 顧客情勢
- 顧客情勢の概要
第9章 地域別情勢
- 地域別セグメンテーション
- 地域別比較
- 北米:市場規模と予測 2023-2028
- 欧州:市場規模と予測 2023-2028
- アジア:市場規模と予測 2023-2028
- 世界のその他の地域:市場規模と予測 2023-2028
- 米国:市場規模と予測 2023-2028
- ドイツ:市場規模と予測 2023-2028
- 日本:市場規模と予測 2023-2028
- 英国:市場規模と予測 2023-2028
- フランス:市場規模と予測 2023-2028
- 地域情勢別市場機会
第10章 促進要因・課題・機会・抑制要因
- 市場促進要因
- 市場の課題
- 促進要因と課題の影響
- 市場の機会・抑制要因
第11章 競合情勢
- 概要
- 競合情勢
- 混乱の状況
- 業界のリスク
第12章 競合分析
- 企業プロファイル
- 企業の市場ポジショニング
- Blue Chip Medical Products Inc.
- Briggs Corp.
- Cochlear Ltd.
- Demant AS
- DeVilbiss Healthcare GmbH
- Electric Mobility Euro Ltd.
- Freedom Scientific Inc.
- GF Health Products Inc.
- GN Store Nord AS
- Invacare Corp.
- MED EL Elektromedizinische Gerate GmbH
- Permobil AB
- Pride Mobility Products Corp.
- Siemens AG
- Sonova AG
第13章 付録
Exhibits:
- Exhibits1: Executive Summary - Chart on Market Overview
- Exhibits2: Executive Summary - Data Table on Market Overview
- Exhibits3: Executive Summary - Chart on Global Market Characteristics
- Exhibits4: Executive Summary - Chart on Market By Geographical Landscape
- Exhibits5: Executive Summary - Chart on Market Segmentation by Product
- Exhibits6: Executive Summary - Chart on Market Segmentation by End-user
- Exhibits7: Executive Summary - Chart on Incremental Growth
- Exhibits8: Executive Summary - Data Table on Incremental Growth
- Exhibits9: Executive Summary - Chart on Company Market Positioning
- Exhibits10: Parent Market
- Exhibits11: Data Table on - Parent Market
- Exhibits12: Market characteristics analysis
- Exhibits13: Value Chain Analysis
- Exhibits14: Offerings of companies included in the market definition
- Exhibits15: Market segments
- Exhibits16: Chart on Global - Market size and forecast 2023-2028 ($ million)
- Exhibits17: Data Table on Global - Market size and forecast 2023-2028 ($ million)
- Exhibits18: Chart on Global Market: Year-over-year growth 2023-2028 (%)
- Exhibits19: Data Table on Global Market: Year-over-year growth 2023-2028 (%)
- Exhibits20: Historic Market Size - Data Table on Global Elderly And Disabled Assistive Solutions Market 2018 - 2022 ($ million)
- Exhibits21: Historic Market Size - Product Segment 2018 - 2022 ($ million)
- Exhibits22: Historic Market Size - End-user Segment 2018 - 2022 ($ million)
- Exhibits23: Historic Market Size - Geography Segment 2018 - 2022 ($ million)
- Exhibits24: Historic Market Size - Country Segment 2018 - 2022 ($ million)
- Exhibits25: Five forces analysis - Comparison between 2023 and 2028
- Exhibits26: Bargaining power of buyers - Impact of key factors 2023 and 2028
- Exhibits27: Bargaining power of suppliers - Impact of key factors in 2023 and 2028
- Exhibits28: Threat of new entrants - Impact of key factors in 2023 and 2028
- Exhibits29: Threat of substitutes - Impact of key factors in 2023 and 2028
- Exhibits30: Threat of rivalry - Impact of key factors in 2023 and 2028
- Exhibits31: Chart on Market condition - Five forces 2023 and 2028
- Exhibits32: Chart on Product - Market share 2023-2028 (%)
- Exhibits33: Data Table on Product - Market share 2023-2028 (%)
- Exhibits34: Chart on Comparison by Product
- Exhibits35: Data Table on Comparison by Product
- Exhibits36: Chart on Hearing devices - Market size and forecast 2023-2028 ($ million)
- Exhibits37: Data Table on Hearing devices - Market size and forecast 2023-2028 ($ million)
- Exhibits38: Chart on Hearing devices - Year-over-year growth 2023-2028 (%)
- Exhibits39: Data Table on Hearing devices - Year-over-year growth 2023-2028 (%)
- Exhibits40: Chart on Mobility and ambulatory devices - Market size and forecast 2023-2028 ($ million)
- Exhibits41: Data Table on Mobility and ambulatory devices - Market size and forecast 2023-2028 ($ million)
- Exhibits42: Chart on Mobility and ambulatory devices - Year-over-year growth 2023-2028 (%)
- Exhibits43: Data Table on Mobility and ambulatory devices - Year-over-year growth 2023-2028 (%)
- Exhibits44: Chart on Healthcare furniture and BSE - Market size and forecast 2023-2028 ($ million)
- Exhibits45: Data Table on Healthcare furniture and BSE - Market size and forecast 2023-2028 ($ million)
- Exhibits46: Chart on Healthcare furniture and BSE - Year-over-year growth 2023-2028 (%)
- Exhibits47: Data Table on Healthcare furniture and BSE - Year-over-year growth 2023-2028 (%)
- Exhibits48: Chart on Vision and reading aids - Market size and forecast 2023-2028 ($ million)
- Exhibits49: Data Table on Vision and reading aids - Market size and forecast 2023-2028 ($ million)
- Exhibits50: Chart on Vision and reading aids - Year-over-year growth 2023-2028 (%)
- Exhibits51: Data Table on Vision and reading aids - Year-over-year growth 2023-2028 (%)
- Exhibits52: Market opportunity by Product ($ million)
- Exhibits53: Data Table on Market opportunity by Product ($ million)
- Exhibits54: Chart on End-user - Market share 2023-2028 (%)
- Exhibits55: Data Table on End-user - Market share 2023-2028 (%)
- Exhibits56: Chart on Comparison by End-user
- Exhibits57: Data Table on Comparison by End-user
- Exhibits58: Chart on Hospital - Market size and forecast 2023-2028 ($ million)
- Exhibits59: Data Table on Hospital - Market size and forecast 2023-2028 ($ million)
- Exhibits60: Chart on Hospital - Year-over-year growth 2023-2028 (%)
- Exhibits61: Data Table on Hospital - Year-over-year growth 2023-2028 (%)
- Exhibits62: Chart on Home care setting - Market size and forecast 2023-2028 ($ million)
- Exhibits63: Data Table on Home care setting - Market size and forecast 2023-2028 ($ million)
- Exhibits64: Chart on Home care setting - Year-over-year growth 2023-2028 (%)
- Exhibits65: Data Table on Home care setting - Year-over-year growth 2023-2028 (%)
- Exhibits66: Chart on Nursing homes - Market size and forecast 2023-2028 ($ million)
- Exhibits67: Data Table on Nursing homes - Market size and forecast 2023-2028 ($ million)
- Exhibits68: Chart on Nursing homes - Year-over-year growth 2023-2028 (%)
- Exhibits69: Data Table on Nursing homes - Year-over-year growth 2023-2028 (%)
- Exhibits70: Chart on Assisted living facilities - Market size and forecast 2023-2028 ($ million)
- Exhibits71: Data Table on Assisted living facilities - Market size and forecast 2023-2028 ($ million)
- Exhibits72: Chart on Assisted living facilities - Year-over-year growth 2023-2028 (%)
- Exhibits73: Data Table on Assisted living facilities - Year-over-year growth 2023-2028 (%)
- Exhibits74: Market opportunity by End-user ($ million)
- Exhibits75: Data Table on Market opportunity by End-user ($ million)
- Exhibits76: Analysis of price sensitivity, lifecycle, customer purchase basket, adoption rates, and purchase criteria
- Exhibits77: Chart on Market share By Geographical Landscape 2023-2028 (%)
- Exhibits78: Data Table on Market share By Geographical Landscape 2023-2028 (%)
- Exhibits79: Chart on Geographic comparison
- Exhibits80: Data Table on Geographic comparison
- Exhibits81: Chart on North America - Market size and forecast 2023-2028 ($ million)
- Exhibits82: Data Table on North America - Market size and forecast 2023-2028 ($ million)
- Exhibits83: Chart on North America - Year-over-year growth 2023-2028 (%)
- Exhibits84: Data Table on North America - Year-over-year growth 2023-2028 (%)
- Exhibits85: Chart on Europe - Market size and forecast 2023-2028 ($ million)
- Exhibits86: Data Table on Europe - Market size and forecast 2023-2028 ($ million)
- Exhibits87: Chart on Europe - Year-over-year growth 2023-2028 (%)
- Exhibits88: Data Table on Europe - Year-over-year growth 2023-2028 (%)
- Exhibits89: Chart on Asia - Market size and forecast 2023-2028 ($ million)
- Exhibits90: Data Table on Asia - Market size and forecast 2023-2028 ($ million)
- Exhibits91: Chart on Asia - Year-over-year growth 2023-2028 (%)
- Exhibits92: Data Table on Asia - Year-over-year growth 2023-2028 (%)
- Exhibits93: Chart on Rest of World (ROW) - Market size and forecast 2023-2028 ($ million)
- Exhibits94: Data Table on Rest of World (ROW) - Market size and forecast 2023-2028 ($ million)
- Exhibits95: Chart on Rest of World (ROW) - Year-over-year growth 2023-2028 (%)
- Exhibits96: Data Table on Rest of World (ROW) - Year-over-year growth 2023-2028 (%)
- Exhibits97: Chart on US - Market size and forecast 2023-2028 ($ million)
- Exhibits98: Data Table on US - Market size and forecast 2023-2028 ($ million)
- Exhibits99: Chart on US - Year-over-year growth 2023-2028 (%)
- Exhibits100: Data Table on US - Year-over-year growth 2023-2028 (%)
- Exhibits101: Chart on Germany - Market size and forecast 2023-2028 ($ million)
- Exhibits102: Data Table on Germany - Market size and forecast 2023-2028 ($ million)
- Exhibits103: Chart on Germany - Year-over-year growth 2023-2028 (%)
- Exhibits104: Data Table on Germany - Year-over-year growth 2023-2028 (%)
- Exhibits105: Chart on Japan - Market size and forecast 2023-2028 ($ million)
- Exhibits106: Data Table on Japan - Market size and forecast 2023-2028 ($ million)
- Exhibits107: Chart on Japan - Year-over-year growth 2023-2028 (%)
- Exhibits108: Data Table on Japan - Year-over-year growth 2023-2028 (%)
- Exhibits109: Chart on UK - Market size and forecast 2023-2028 ($ million)
- Exhibits110: Data Table on UK - Market size and forecast 2023-2028 ($ million)
- Exhibits111: Chart on UK - Year-over-year growth 2023-2028 (%)
- Exhibits112: Data Table on UK - Year-over-year growth 2023-2028 (%)
- Exhibits113: Chart on France - Market size and forecast 2023-2028 ($ million)
- Exhibits114: Data Table on France - Market size and forecast 2023-2028 ($ million)
- Exhibits115: Chart on France - Year-over-year growth 2023-2028 (%)
- Exhibits116: Data Table on France - Year-over-year growth 2023-2028 (%)
- Exhibits117: Market opportunity By Geographical Landscape ($ million)
- Exhibits118: Data Tables on Market opportunity By Geographical Landscape ($ million)
- Exhibits119: Impact of drivers and challenges in 2023 and 2028
- Exhibits120: Overview on criticality of inputs and factors of differentiation
- Exhibits121: Overview on factors of disruption
- Exhibits122: Impact of key risks on business
- Exhibits123: Companies covered
- Exhibits124: Matrix on companies position and classification
- Exhibits125: Blue Chip Medical Products Inc. - Overview
- Exhibits126: Blue Chip Medical Products Inc. - Product / Service
- Exhibits127: Blue Chip Medical Products Inc. - Key offerings
- Exhibits128: Briggs Corp. - Overview
- Exhibits129: Briggs Corp. - Product / Service
- Exhibits130: Briggs Corp. - Key offerings
- Exhibits131: Cochlear Ltd. - Overview
- Exhibits132: Cochlear Ltd. - Business segments
- Exhibits133: Cochlear Ltd. - Key news
- Exhibits134: Cochlear Ltd. - Key offerings
- Exhibits135: Cochlear Ltd. - Segment focus
- Exhibits136: Demant AS - Overview
- Exhibits137: Demant AS - Business segments
- Exhibits138: Demant AS - Key offerings
- Exhibits139: Demant AS - Segment focus
- Exhibits140: DeVilbiss Healthcare GmbH - Overview
- Exhibits141: DeVilbiss Healthcare GmbH - Product / Service
- Exhibits142: DeVilbiss Healthcare GmbH - Key news
- Exhibits143: DeVilbiss Healthcare GmbH - Key offerings
- Exhibits144: Electric Mobility Euro Ltd. - Overview
- Exhibits145: Electric Mobility Euro Ltd. - Product / Service
- Exhibits146: Electric Mobility Euro Ltd. - Key offerings
- Exhibits147: Freedom Scientific Inc. - Overview
- Exhibits148: Freedom Scientific Inc. - Product / Service
- Exhibits149: Freedom Scientific Inc. - Key offerings
- Exhibits150: GF Health Products Inc. - Overview
- Exhibits151: GF Health Products Inc. - Product / Service
- Exhibits152: GF Health Products Inc. - Key offerings
- Exhibits153: GN Store Nord AS - Overview
- Exhibits154: GN Store Nord AS - Business segments
- Exhibits155: GN Store Nord AS - Key news
- Exhibits156: GN Store Nord AS - Key offerings
- Exhibits157: GN Store Nord AS - Segment focus
- Exhibits158: Invacare Corp. - Overview
- Exhibits159: Invacare Corp. - Business segments
- Exhibits160: Invacare Corp. - Key news
- Exhibits161: Invacare Corp. - Key offerings
- Exhibits162: Invacare Corp. - Segment focus
- Exhibits163: MED EL Elektromedizinische Gerate GmbH - Overview
- Exhibits164: MED EL Elektromedizinische Gerate GmbH - Product / Service
- Exhibits165: MED EL Elektromedizinische Gerate GmbH - Key news
- Exhibits166: MED EL Elektromedizinische Gerate GmbH - Key offerings
- Exhibits167: Permobil AB - Overview
- Exhibits168: Permobil AB - Product / Service
- Exhibits169: Permobil AB - Key news
- Exhibits170: Permobil AB - Key offerings
- Exhibits171: Pride Mobility Products Corp. - Overview
- Exhibits172: Pride Mobility Products Corp. - Product / Service
- Exhibits173: Pride Mobility Products Corp. - Key offerings
- Exhibits174: Siemens AG - Overview
- Exhibits175: Siemens AG - Business segments
- Exhibits176: Siemens AG - Key news
- Exhibits177: Siemens AG - Key offerings
- Exhibits178: Siemens AG - Segment focus
- Exhibits179: Sonova AG - Overview
- Exhibits180: Sonova AG - Business segments
- Exhibits181: Sonova AG - Key offerings
- Exhibits182: Sonova AG - Segment focus
- Exhibits183: Inclusions checklist
- Exhibits184: Exclusions checklist
- Exhibits185: Currency conversion rates for US$
- Exhibits186: Research methodology
- Exhibits187: Information sources
- Exhibits188: Data validation
- Exhibits189: Validation techniques employed for market sizing
- Exhibits190: Data synthesis
- Exhibits191: 360 degree market analysis
- Exhibits192: List of abbreviations
Elderly And Disabled Assistive Solutions Market 2024-2028
The elderly and disabled assistive solutions market is forecasted to grow by USD 15606 mn during 2023-2028, accelerating at a CAGR of 8.09% during the forecast period. The report on the elderly and disabled assistive solutions market provides a holistic analysis, market size and forecast, trends, growth drivers, and challenges, as well as vendor analysis covering around 25 vendors.
The report offers an up-to-date analysis regarding the current market scenario, the latest trends and drivers, and the overall market environment. The market is driven by initiatives by governments and ngos, growing number of disabled and aged people, and growing number of road accidents resulting in serious injuries.
| Market Scope | |
|---|---|
| Base Year | 2024 |
| End Year | 2028 |
| Series Year | 2024-2028 |
| Growth Momentum | Accelerate |
| YOY 2024 | 7.32% |
| CAGR | 8.09% |
| Incremental Value | $15606 mn |
Technavio's elderly and disabled assistive solutions market is segmented as below:
By Product
- Hearing devices
- Mobility and ambulatory devices
- Healthcare furniture and BSE
- Vision and reading aids
By End-user
- Hospital
- Home care setting
- Nursing homes
- Assisted living facilities
By Geographical Landscape
- North America
- Europe
- Asia
- Rest of World (ROW)
This study identifies the growing customization as one of the prime reasons driving the elderly and disabled assistive solutions market growth during the next few years. Also, increasing online retail sales and growth of medical tourism will lead to sizable demand in the market.
The report on the elderly and disabled assistive solutions market covers the following areas:
- Elderly and disabled assistive solutions market sizing
- Elderly and disabled assistive solutions market forecast
- Elderly and disabled assistive solutions market industry analysis
The robust vendor analysis is designed to help clients improve their market position, and in line with this, this report provides a detailed analysis of several leading elderly and disabled assistive solutions market vendors that include Blue Chip Medical Products Inc., Briggs Corp., Cochlear Ltd., Demant AS, DeVilbiss Healthcare GmbH, Electric Mobility Euro Ltd., Freedom Scientific Inc., GF Health Products Inc., GN Store Nord AS, Invacare Corp., LifeTec, MED EL Elektromedizinische Gerate GmbH, Ottobock SE and Co. KGaA, Permobil AB, Pride Mobility Products Corp., Siemens AG, Sonova AG, Starkey Laboratories Inc., Sunrise Medical LLC, and WS Audiology AS. Also, the elderly and disabled assistive solutions market analysis report includes information on upcoming trends and challenges that will influence market growth. This is to help companies strategize and leverage all forthcoming growth opportunities.
The study was conducted using an objective combination of primary and secondary information including inputs from key participants in the industry. The report contains a comprehensive market and vendor landscape in addition to an analysis of the key vendors.
The publisher presents a detailed picture of the market by the way of study, synthesis, and summation of data from multiple sources by an analysis of key parameters such as profit, pricing, competition, and promotions. It presents various market facets by identifying the key industry influencers. The data presented is comprehensive, reliable, and a result of extensive primary and secondary research. The market research reports provide a complete competitive landscape and an in-depth vendor selection methodology and analysis using qualitative and quantitative research to forecast accurate market growth.
Table of Contents
1 Executive Summary
- 1.1 Market overview
- Executive Summary - Chart on Market Overview
- Executive Summary - Data Table on Market Overview
- Executive Summary - Chart on Global Market Characteristics
- Executive Summary - Chart on Market By Geographical Landscape
- Executive Summary - Chart on Market Segmentation by Product
- Executive Summary - Chart on Market Segmentation by End-user
- Executive Summary - Chart on Incremental Growth
- Executive Summary - Data Table on Incremental Growth
- Executive Summary - Chart on Company Market Positioning
2 Market Landscape
- 2.1 Market ecosystem
- Parent Market
- Data Table on - Parent Market
- 2.2 Market characteristics
- Market characteristics analysis
- 2.3 Value chain analysis
- Value Chain Analysis
3 Market Sizing
- 3.1 Market definition
- Offerings of companies included in the market definition
- 3.2 Market segment analysis
- Market segments
- 3.3 Market size 2023
- 3.4 Market outlook: Forecast for 2023-2028
- Chart on Global - Market size and forecast 2023-2028 ($ million)
- Data Table on Global - Market size and forecast 2023-2028 ($ million)
- Chart on Global Market: Year-over-year growth 2023-2028 (%)
- Data Table on Global Market: Year-over-year growth 2023-2028 (%)
4 Historic Market Size
- 4.1 Global Elderly And Disabled Assistive Solutions Market 2018 - 2022
- Historic Market Size - Data Table on Global Elderly And Disabled Assistive Solutions Market 2018 - 2022 ($ million)
- 4.2 Product segment analysis 2018 - 2022
- Historic Market Size - Product Segment 2018 - 2022 ($ million)
- 4.3 End-user segment analysis 2018 - 2022
- Historic Market Size - End-user Segment 2018 - 2022 ($ million)
- 4.4 Geography segment analysis 2018 - 2022
- Historic Market Size - Geography Segment 2018 - 2022 ($ million)
- 4.5 Country segment analysis 2018 - 2022
- Historic Market Size - Country Segment 2018 - 2022 ($ million)
5 Five Forces Analysis
- 5.1 Five forces summary
- Five forces analysis - Comparison between 2023 and 2028
- 5.2 Bargaining power of buyers
- Bargaining power of buyers - Impact of key factors 2023 and 2028
- 5.3 Bargaining power of suppliers
- Bargaining power of suppliers - Impact of key factors in 2023 and 2028
- 5.4 Threat of new entrants
- Threat of new entrants - Impact of key factors in 2023 and 2028
- 5.5 Threat of substitutes
- Threat of substitutes - Impact of key factors in 2023 and 2028
- 5.6 Threat of rivalry
- Threat of rivalry - Impact of key factors in 2023 and 2028
- 5.7 Market condition
- Chart on Market condition - Five forces 2023 and 2028
6 Market Segmentation by Product
- 6.1 Market segments
- Chart on Product - Market share 2023-2028 (%)
- Data Table on Product - Market share 2023-2028 (%)
- 6.2 Comparison by Product
- Chart on Comparison by Product
- Data Table on Comparison by Product
- 6.3 Hearing devices - Market size and forecast 2023-2028
- Chart on Hearing devices - Market size and forecast 2023-2028 ($ million)
- Data Table on Hearing devices - Market size and forecast 2023-2028 ($ million)
- Chart on Hearing devices - Year-over-year growth 2023-2028 (%)
- Data Table on Hearing devices - Year-over-year growth 2023-2028 (%)
- 6.4 Mobility and ambulatory devices - Market size and forecast 2023-2028
- Chart on Mobility and ambulatory devices - Market size and forecast 2023-2028 ($ million)
- Data Table on Mobility and ambulatory devices - Market size and forecast 2023-2028 ($ million)
- Chart on Mobility and ambulatory devices - Year-over-year growth 2023-2028 (%)
- Data Table on Mobility and ambulatory devices - Year-over-year growth 2023-2028 (%)
- 6.5 Healthcare furniture and BSE - Market size and forecast 2023-2028
- Chart on Healthcare furniture and BSE - Market size and forecast 2023-2028 ($ million)
- Data Table on Healthcare furniture and BSE - Market size and forecast 2023-2028 ($ million)
- Chart on Healthcare furniture and BSE - Year-over-year growth 2023-2028 (%)
- Data Table on Healthcare furniture and BSE - Year-over-year growth 2023-2028 (%)
- 6.6 Vision and reading aids - Market size and forecast 2023-2028
- Chart on Vision and reading aids - Market size and forecast 2023-2028 ($ million)
- Data Table on Vision and reading aids - Market size and forecast 2023-2028 ($ million)
- Chart on Vision and reading aids - Year-over-year growth 2023-2028 (%)
- Data Table on Vision and reading aids - Year-over-year growth 2023-2028 (%)
- 6.7 Market opportunity by Product
- Market opportunity by Product ($ million)
- Data Table on Market opportunity by Product ($ million)
7 Market Segmentation by End-user
- 7.1 Market segments
- Chart on End-user - Market share 2023-2028 (%)
- Data Table on End-user - Market share 2023-2028 (%)
- 7.2 Comparison by End-user
- Chart on Comparison by End-user
- Data Table on Comparison by End-user
- 7.3 Hospital - Market size and forecast 2023-2028
- Chart on Hospital - Market size and forecast 2023-2028 ($ million)
- Data Table on Hospital - Market size and forecast 2023-2028 ($ million)
- Chart on Hospital - Year-over-year growth 2023-2028 (%)
- Data Table on Hospital - Year-over-year growth 2023-2028 (%)
- 7.4 Home care setting - Market size and forecast 2023-2028
- Chart on Home care setting - Market size and forecast 2023-2028 ($ million)
- Data Table on Home care setting - Market size and forecast 2023-2028 ($ million)
- Chart on Home care setting - Year-over-year growth 2023-2028 (%)
- Data Table on Home care setting - Year-over-year growth 2023-2028 (%)
- 7.5 Nursing homes - Market size and forecast 2023-2028
- Chart on Nursing homes - Market size and forecast 2023-2028 ($ million)
- Data Table on Nursing homes - Market size and forecast 2023-2028 ($ million)
- Chart on Nursing homes - Year-over-year growth 2023-2028 (%)
- Data Table on Nursing homes - Year-over-year growth 2023-2028 (%)
- 7.6 Assisted living facilities - Market size and forecast 2023-2028
- Chart on Assisted living facilities - Market size and forecast 2023-2028 ($ million)
- Data Table on Assisted living facilities - Market size and forecast 2023-2028 ($ million)
- Chart on Assisted living facilities - Year-over-year growth 2023-2028 (%)
- Data Table on Assisted living facilities - Year-over-year growth 2023-2028 (%)
- 7.7 Market opportunity by End-user
- Market opportunity by End-user ($ million)
- Data Table on Market opportunity by End-user ($ million)
8 Customer Landscape
- 8.1 Customer landscape overview
- Analysis of price sensitivity, lifecycle, customer purchase basket, adoption rates, and purchase criteria
9 Geographic Landscape
- 9.1 Geographic segmentation
- Chart on Market share By Geographical Landscape 2023-2028 (%)
- Data Table on Market share By Geographical Landscape 2023-2028 (%)
- 9.2 Geographic comparison
- Chart on Geographic comparison
- Data Table on Geographic comparison
- 9.3 North America - Market size and forecast 2023-2028
- Chart on North America - Market size and forecast 2023-2028 ($ million)
- Data Table on North America - Market size and forecast 2023-2028 ($ million)
- Chart on North America - Year-over-year growth 2023-2028 (%)
- Data Table on North America - Year-over-year growth 2023-2028 (%)
- 9.4 Europe - Market size and forecast 2023-2028
- Chart on Europe - Market size and forecast 2023-2028 ($ million)
- Data Table on Europe - Market size and forecast 2023-2028 ($ million)
- Chart on Europe - Year-over-year growth 2023-2028 (%)
- Data Table on Europe - Year-over-year growth 2023-2028 (%)
- 9.5 Asia - Market size and forecast 2023-2028
- Chart on Asia - Market size and forecast 2023-2028 ($ million)
- Data Table on Asia - Market size and forecast 2023-2028 ($ million)
- Chart on Asia - Year-over-year growth 2023-2028 (%)
- Data Table on Asia - Year-over-year growth 2023-2028 (%)
- 9.6 Rest of World (ROW) - Market size and forecast 2023-2028
- Chart on Rest of World (ROW) - Market size and forecast 2023-2028 ($ million)
- Data Table on Rest of World (ROW) - Market size and forecast 2023-2028 ($ million)
- Chart on Rest of World (ROW) - Year-over-year growth 2023-2028 (%)
- Data Table on Rest of World (ROW) - Year-over-year growth 2023-2028 (%)
- 9.7 US - Market size and forecast 2023-2028
- Chart on US - Market size and forecast 2023-2028 ($ million)
- Data Table on US - Market size and forecast 2023-2028 ($ million)
- Chart on US - Year-over-year growth 2023-2028 (%)
- Data Table on US - Year-over-year growth 2023-2028 (%)
- 9.8 Germany - Market size and forecast 2023-2028
- Chart on Germany - Market size and forecast 2023-2028 ($ million)
- Data Table on Germany - Market size and forecast 2023-2028 ($ million)
- Chart on Germany - Year-over-year growth 2023-2028 (%)
- Data Table on Germany - Year-over-year growth 2023-2028 (%)
- 9.9 Japan - Market size and forecast 2023-2028
- Chart on Japan - Market size and forecast 2023-2028 ($ million)
- Data Table on Japan - Market size and forecast 2023-2028 ($ million)
- Chart on Japan - Year-over-year growth 2023-2028 (%)
- Data Table on Japan - Year-over-year growth 2023-2028 (%)
- 9.10 UK - Market size and forecast 2023-2028
- Chart on UK - Market size and forecast 2023-2028 ($ million)
- Data Table on UK - Market size and forecast 2023-2028 ($ million)
- Chart on UK - Year-over-year growth 2023-2028 (%)
- Data Table on UK - Year-over-year growth 2023-2028 (%)
- 9.11 France - Market size and forecast 2023-2028
- Chart on France - Market size and forecast 2023-2028 ($ million)
- Data Table on France - Market size and forecast 2023-2028 ($ million)
- Chart on France - Year-over-year growth 2023-2028 (%)
- Data Table on France - Year-over-year growth 2023-2028 (%)
- 9.12 Market opportunity By Geographical Landscape
- Market opportunity By Geographical Landscape ($ million)
- Data Tables on Market opportunity By Geographical Landscape ($ million)
10 Drivers, Challenges, and Opportunity/Restraints
- 10.1 Market drivers
- 10.2 Market challenges
- 10.3 Impact of drivers and challenges
- Impact of drivers and challenges in 2023 and 2028
- 10.4 Market opportunities/restraints
11 Competitive Landscape
- 11.1 Overview
- 11.2 Competitive Landscape
- Overview on criticality of inputs and factors of differentiation
- 11.3 Landscape disruption
- Overview on factors of disruption
- 11.4 Industry risks
- Impact of key risks on business
12 Competitive Analysis
- 12.1 Companies profiled
- Companies covered
- 12.2 Market positioning of companies
- Matrix on companies position and classification
- 12.3 Blue Chip Medical Products Inc.
- Blue Chip Medical Products Inc. - Overview
- Blue Chip Medical Products Inc. - Product / Service
- Blue Chip Medical Products Inc. - Key offerings
- 12.4 Briggs Corp.
- Briggs Corp. - Overview
- Briggs Corp. - Product / Service
- Briggs Corp. - Key offerings
- 12.5 Cochlear Ltd.
- Cochlear Ltd. - Overview
- Cochlear Ltd. - Business segments
- Cochlear Ltd. - Key news
- Cochlear Ltd. - Key offerings
- Cochlear Ltd. - Segment focus
- 12.6 Demant AS
- Demant AS - Overview
- Demant AS - Business segments
- Demant AS - Key offerings
- Demant AS - Segment focus
- 12.7 DeVilbiss Healthcare GmbH
- DeVilbiss Healthcare GmbH - Overview
- DeVilbiss Healthcare GmbH - Product / Service
- DeVilbiss Healthcare GmbH - Key news
- DeVilbiss Healthcare GmbH - Key offerings
- 12.8 Electric Mobility Euro Ltd.
- Electric Mobility Euro Ltd. - Overview
- Electric Mobility Euro Ltd. - Product / Service
- Electric Mobility Euro Ltd. - Key offerings
- 12.9 Freedom Scientific Inc.
- Freedom Scientific Inc. - Overview
- Freedom Scientific Inc. - Product / Service
- Freedom Scientific Inc. - Key offerings
- 12.10 GF Health Products Inc.
- GF Health Products Inc. - Overview
- GF Health Products Inc. - Product / Service
- GF Health Products Inc. - Key offerings
- 12.11 GN Store Nord AS
- GN Store Nord AS - Overview
- GN Store Nord AS - Business segments
- GN Store Nord AS - Key news
- GN Store Nord AS - Key offerings
- GN Store Nord AS - Segment focus
- 12.12 Invacare Corp.
- Invacare Corp. - Overview
- Invacare Corp. - Business segments
- Invacare Corp. - Key news
- Invacare Corp. - Key offerings
- Invacare Corp. - Segment focus
- 12.13 MED EL Elektromedizinische Gerate GmbH
- MED EL Elektromedizinische Gerate GmbH - Overview
- MED EL Elektromedizinische Gerate GmbH - Product / Service
- MED EL Elektromedizinische Gerate GmbH - Key news
- MED EL Elektromedizinische Gerate GmbH - Key offerings
- 12.14 Permobil AB
- Permobil AB - Overview
- Permobil AB - Product / Service
- Permobil AB - Key news
- Permobil AB - Key offerings
- 12.15 Pride Mobility Products Corp.
- Pride Mobility Products Corp. - Overview
- Pride Mobility Products Corp. - Product / Service
- Pride Mobility Products Corp. - Key offerings
- 12.16 Siemens AG
- Siemens AG - Overview
- Siemens AG - Business segments
- Siemens AG - Key news
- Siemens AG - Key offerings
- Siemens AG - Segment focus
- 12.17 Sonova AG
- Sonova AG - Overview
- Sonova AG - Business segments
- Sonova AG - Key offerings
- Sonova AG - Segment focus
13 Appendix
- 13.1 Scope of the report
- 13.2 Inclusions and exclusions checklist
- Inclusions checklist
- Exclusions checklist
- 13.3 Currency conversion rates for US$
- Currency conversion rates for US$
- 13.4 Research methodology
- Research methodology
- 13.5 Data procurement
- Information sources
- 13.6 Data validation
- Data validation
- 13.7 Validation techniques employed for market sizing
- Validation techniques employed for market sizing
- 13.8 Data synthesis
- Data synthesis
- 13.9 360 degree market analysis
- 360 degree market analysis
- 13.10 List of abbreviations
- List of abbreviations
