|
|
市場調査レポート
商品コード
1262657
金属石鹸の世界市場の分析 (2023年)Global Metallic Soaps Market Research Report 2023 |
||||||
|
|
|||||||
|
● お客様のご希望に応じて、既存データの加工や未掲載情報(例:国別セグメント)の追加などの対応が可能です。 詳細はお問い合わせください。 |
|||||||


| 金属石鹸の世界市場の分析 (2023年) |
|
出版日: 2023年04月23日
発行: QYResearch
ページ情報: 英文 181 Pages
納期: 2~3営業日
|
- 全表示
- 概要
- 図表
- 目次
世界の金属石鹸の市場規模は、2022年に26億9,790万米ドルと評価され、予測期間中 (2023年~2029年) に4.73%のCAGRで成長し、2029年には37億1,250万米ドルに達すると予測されています。
北米の金属石鹸の市場規模は、2023年の4億7,164万米ドルから、2029年までに5億9,856万米ドルに達し、予測期間中 (2023年~2029年) に4.05%のCAGRで成長すると予測されています。
欧州の金属石鹸の市場規模は、2023年の5億9,430万米ドルから、2029年までに7億5,875万米ドルに達し、予測期間中 (2023年~2029年) に4.16%のCAGRで成長すると予測されています。
中国の金属石鹸の市場規模は、2023年の8億5,060万米ドルから、2029年までに11億4,133万米ドルに達し、予測期間中 (2023年~2029年) に5.02%のCAGRで成長すると予測されています。
世界の金属石鹸の主要メーカーには、Baerlocher、FACI SPA、Dover Chemical、CHNV Technology、Sun Ace Kakoh、BELIKE Chemical、PMC Biogenix、Italmatch Chemicals、Chimiaranなどがあります。2022年には、世界の上位ベンダー3社で収益の約18.89%を占めています。
目次
第1章 金属石鹸:市場概要
- 製品の定義
- 金属石鹸:種類別
- 世界の金属石鹸の市場額の成長率の分析:種類別 (2018年・2022年・2029年)
- 亜鉛石鹸
- カルシウム石鹸
- アルミニウム石鹸
- マグネシウム石鹸
- ナトリウム石鹸
- バリウム石鹸
- その他
- 金属石鹸:用途別
- 世界の金属石鹸の市場額の成長率の分析:用途別 (2022年・2029年)
- プラスチック産業
- 建築・建設
- グリース産業
- ゴム産業
- 製紙業
- パーソナルケア用品
- 医薬品
- その他
- 世界市場の成長見通し
- 世界の金属石鹸の生産額、推定・予測 (2018年~2029年)
- 世界の金属石鹸の生産能力、推定・予測 (2018年~2029年)
- 世界の金属石鹸の生産、推定・予測 (2018年~2029年)
- 世界の金属石鹸の平均市場価格、推定・予測 (2018年~2029年)
- 前提・制約条件
第2章 市場競合:メーカー別
- 世界の金属石鹸の生産の市場シェア:メーカー別 (2018年~2023年)
- 世界の金属石鹸の生産額の市場シェア:メーカー別 (2018年~2023年)
- 世界の金属石鹸の主要企業:業界ランキング (2021年・2022年)
- 世界の金属石鹸の市場シェア:企業の種類別(ティア1、ティア2、ティア3)
- 世界の金属石鹸の平均価格:メーカー別 (2018年~2023年)
- 世界の金属石鹸の主要メーカー:製造拠点分布・本社
- 世界の金属石鹸の主要メーカー:製品種類
- 世界の金属石鹸の主要メーカー:設立時期
- 金属石鹸市場:競争状況と動向
- 企業合併・買収 (M&A)、拡大
第3章 金属石鹸の生産:地域別
- 世界の金属石鹸の生産額、推定・予測:地域別 (2018年・2022年・2029年)
- 世界の金属石鹸の生産額:地域別 (2018年~2029年)
- 世界の金属石鹸の生産、推定・予測:地域別 (2018年・2022年・2029年)
- 世界の金属石鹸の生産:地域別 (2018年~2029年)
- 世界の金属石鹸の市場価格の分析:地域別 (2018年~2023年)
- 世界の金属石鹸の生産・生産額・対前年成長率
- 北米の金属石鹸の生産額、推定・予測 (2018年~2029年)
- 欧州の金属石鹸の生産額、推定・予測 (2018年~2029年)
- 中国の金属石鹸の生産額、推定・予測 (2018年~2029年)
- 東南アジアの金属石鹸の生産額、推定・予測 (2018年~2029年)
第4章 金属石鹸の消費:地域別
- 世界の金属石鹸の消費、推定・予測:地域別 (2018年・2022年・2029年)
- 世界の金属石鹸の消費:地域別 (2018年~2029年)
- 北米
- 米国
- カナダ
- 欧州
- ドイツ
- フランス
- 英国
- イタリア
- ロシア
- アジア太平洋
- 中国
- 日本
- 韓国
- インド
- オーストラリア
- 東南アジア
- ラテンアメリカ
- メキシコ
- ブラジル
- アルゼンチン
- 中東・アフリカ
- 中東
- アフリカ
第5章 セグメント:種類別
- 世界の金属石鹸の生産:種類別 (2018年~2029年)
- 世界の金属石鹸の生産額:種類別 (2018年~2029年)
- 世界の金属石鹸の価格:種類別 (2018年~2029年)
第6章 セグメント:用途別
- 世界の金属石鹸の生産:用途別 (2018年~2029年)
- 世界の金属石鹸の生産額:用途別 (2018年~2029年)
- 世界の金属石鹸の価格:用途別 (2018年~2029年)
第7章 主要企業のプロファイル
- Baerlocher
- FACI SPA
- Dover Chemical
- CHNV Technology
- Sun Ace Kakoh
- BELIKE Chemical
- PMC Biogenix
- Italmatch Chemicals
- Chimiaran
- Sogis Chemical Industry
- Akdeniz Chemson
- Anhui Shafeng Advanced Material
- Tianjin Langhu Technology
- Linghu Xinwang Chemical
- Peter Greven
- Mittal Dhatu
- Jiangxi Hongyuan
- Valtris Specialty Chemicals
- James M. Brown
- Hangzhou Oleochemicals
- Evergreen Chemical
- Seoul Fine Chemical
第8章 産業チェーンと販売チャネルの分析
- 金属石鹸の産業チェーンの分析
- 金属石鹸の主要原材料
- 製造コストの構造比
- 金属石鹸の製造モードとプロセス
- 金属石鹸の流通業者
- 金属石鹸の顧客
第9章 金属石鹸の市場力学
- 金属石鹸業界の動向
- 金属石鹸市場の促進要因
- 金属石鹸市場の課題
第10章 調査結果と結論
第11章 調査手法とデータソース
List of Tables
- Table 1. Global Metallic Soaps Market Value by Type, (US$ Million) & (2018 VS 2022 VS 2029)
- Table 2. Major Manufacturers of Zinc Soaps
- Table 3. Major Manufacturers of Calcium Soaps
- Table 4. Major Manufacturers of Aluminum Soaps
- Table 5. Major Manufacturers of Magnesium Soaps
- Table 6. Major Manufacturers of Sodium Soaps
- Table 7. Major Manufacturers of Barium Soaps
- Table 8. Major Manufacturers of Others
- Table 9. Global Metallic Soaps Market Value by Application, (US$ Million) & (2022 VS 2029)
- Table 10. Others Application Fields
- Table 11. Global Metallic Soaps Production Capacity (Kilotons) by Manufacturers in 2022
- Table 12. Global Metallic Soaps Production by Manufacturers (2018-2023) & (Kilotons)
- Table 13. Global Metallic Soaps Production Market Share by Manufacturers (2018-2023)
- Table 14. Global Metallic Soaps Production Value by Manufacturers (2018-2023) & (US$ Million)
- Table 15. Global Metallic Soaps Production Value Share by Manufacturers (2018-2023)
- Table 16. Global Key Players of Metallic Soaps, Industry Ranking, 2021 VS 2022
- Table 17. Company Type (Tier 1, Tier 2, and Tier 3) & (based on the Production Value in Metallic Soaps as of 2022)
- Table 18. Global Market Metallic Soaps Average Price by Manufacturers (US$/Ton) & (2018-2023)
- Table 19. Global Key Manufacturers of Metallic Soaps, Manufacturing Base Distribution and Headquarters
- Table 20. Global Key Manufacturers of Metallic Soaps Product Offered
- Table 21. Establishment Date of Global Key Manufacturers of Metallic Soaps
- Table 22. Global Metallic Soaps Manufacturers Market Concentration Ratio (CR5 and HHI)
- Table 23. Mergers & Acquisitions, Expansion Plans
- Table 24. Global Metallic Soaps Production Value by Region: 2018 VS 2022 VS 2029 (US$ Million)
- Table 25. Global Metallic Soaps Production Value (US$ Million) by Region (2018-2023)
- Table 26. Global Metallic Soaps Production Value Market Share by Region (2018-2023)
- Table 27. Global Metallic Soaps Production Value (US$ Million) Forecast by Region (2024-2029)
- Table 28. Global Metallic Soaps Production Value Market Share Forecast by Region (2024-2029)
- Table 29. Global Metallic Soaps Production Comparison by Region: 2018 VS 2022 VS 2029 (Kilotons)
- Table 30. Global Metallic Soaps Production (Kilotons) by Region (2018-2023)
- Table 31. Global Metallic Soaps Production Market Share by Region (2018-2023)
- Table 32. Global Metallic Soaps Production (Kilotons) Forecast by Region (2024-2029)
- Table 33. Global Metallic Soaps Production Market Share Forecast by Region (2024-2029)
- Table 34. Global Metallic Soaps Market Average Price (US$/Ton) by Region (2018-2023)
- Table 35. Global Metallic Soaps Market Average Price (US$/Ton) by Region (2024-202*)
- Table 36. Global Metallic Soaps Consumption Growth Rate by Region: 2018 VS 2022 VS 2029 (Kilotons)
- Table 37. Global Metallic Soaps Consumption by Region (2018-2023) & (Kilotons)
- Table 38. Global Metallic Soaps Consumption Market Share by Region (2018-2023)
- Table 39. Global Metallic Soaps Forecasted Consumption by Region (2024-2029) & (Kilotons)
- Table 40. Global Metallic Soaps Forecasted Consumption Market Share by Region (2024-2029)
- Table 41. North America Metallic Soaps Consumption Growth Rate by Country: 2018 VS 2022 VS 2029 (Kilotons)
- Table 42. North America Metallic Soaps Consumption by Country (2018-2023) & (Kilotons)
- Table 43. North America Metallic Soaps Consumption by Country (2024-2029) & (Kilotons)
- Table 44. Europe Metallic Soaps Consumption Growth Rate by Country: 2018 VS 2022 VS 2029 (Kilotons)
- Table 45. Europe Metallic Soaps Consumption by Country (2018-2023) & (Kilotons)
- Table 46. Europe Metallic Soaps Consumption by Country (2024-2029) & (Kilotons)
- Table 47. Asia Pacific Metallic Soaps Consumption Growth Rate by Country: 2018 VS 2022 VS 2029 (Kilotons)
- Table 48. Asia Pacific Metallic Soaps Consumption by Region (2018-2023) & (Kilotons)
- Table 49. Asia Pacific Metallic Soaps Consumption by Region (2024-2029) & (Kilotons)
- Table 50. Latin America Metallic Soaps Consumption Growth Rate by Country: 2018 VS 2022 VS 2029 (Kilotons)
- Table 51. Latin America, Middle East & Africa Metallic Soaps Consumption by Country (2018-2023) & (Kilotons)
- Table 52. Latin America Metallic Soaps Consumption by Country (2024-2029) & (Kilotons)
- Table 53. Middle East and Africa Metallic Soaps Consumption Growth Rate by Country: 2018 VS 2022 VS 2029 (Kilotons)
- Table 54. Middle East and Africa Metallic Soaps Consumption by Country (2018-2023) & (Kilotons)
- Table 55. Middle East and Africa Metallic Soaps Consumption by Country (2024-2029) & (Kilotons)
- Table 56. Global Metallic Soaps Production (Kilotons) by Type (2018-2023)
- Table 57. Global Metallic Soaps Production (Kilotons) by Type (2024-2029)
- Table 58. Global Metallic Soaps Production Market Share by Type (2018-2023)
- Table 59. Global Metallic Soaps Production Market Share by Type (2024-2029)
- Table 60. Global Metallic Soaps Production Value (US$ Million) by Type (2018-2023)
- Table 61. Global Metallic Soaps Production Value (US$ Million) by Type (2024-2029)
- Table 62. Global Metallic Soaps Production Value Market Share by Type (2018-2023)
- Table 63. Global Metallic Soaps Production Value Market Share by Type (2024-2029)
- Table 64. Global Metallic Soaps Price (US$/Ton) by Type (2018-2023)
- Table 65. Global Metallic Soaps Price (US$/Ton) by Type (2024-2029)
- Table 66. Global Metallic Soaps Production (Kilotons) by Application (2018-2023)
- Table 67. Global Metallic Soaps Production (Kilotons) by Application (2024-2029)
- Table 68. Global Metallic Soaps Production Market Share by Application (2018-2023)
- Table 69. Global Metallic Soaps Production Market Share by Application (2024-2029)
- Table 70. Global Metallic Soaps Production Value (US$ Million) by Application (2018-2023)
- Table 71. Global Metallic Soaps Production Value (US$ Million) by Application (2024-2029)
- Table 72. Global Metallic Soaps Production Value Market Share by Application (2018-2023)
- Table 73. Global Metallic Soaps Production Value Market Share by Application (2024-2029)
- Table 74. Global Metallic Soaps Price (US$/Ton) by Application (2018-2023)
- Table 75. Global Metallic Soaps Price (US$/Ton) by Application (2024-2029)
- Table 76. Baerlocher Metallic Soaps Company Information
- Table 77. Baerlocher Metallic Soaps Specification and Specification
- Table 78. Baerlocher Metallic Soaps Production (Kilotons), Value (US$ Million), Price (US$/Ton) and Gross Margin (2018-2023)
- Table 79. Baerlocher Main Business and Markets Served
- Table 80. FACI SPA Metallic Soaps Company Information
- Table 81. FACI SPA Metallic Soaps Specification and Specification
- Table 82. FACI SPA Metallic Soaps Production (Kilotons), Value (US$ Million), Price (US$/Ton) and Gross Margin (2018-2023)
- Table 83. FACI SPA Main Business and Markets Served
- Table 84. Dover Chemical Metallic Soaps Company Information
- Table 85. Dover Chemical Metallic Soaps Specification and Specification
- Table 86. Dover Chemical Metallic Soaps Production (Kilotons), Value (US$ Million), Price (US$/Ton) and Gross Margin (2018-2023)
- Table 87. Dover Chemical Main Business and Markets Served
- Table 88. CHNV Technology Metallic Soaps Company Information
- Table 89. CHNV Technology Metallic Soaps Specification and Specification
- Table 90. CHNV Technology Metallic Soaps Production (Kilotons), Value (US$ Million), Price (US$/Ton) and Gross Margin (2018-2023)
- Table 91. CHNV Technology Main Business and Markets Served
- Table 92. Sun Ace Kakoh Metallic Soaps Company Information
- Table 93. Sun Ace Kakoh Metallic Soaps Specification and Specification
- Table 94. Sun Ace Kakoh Metallic Soaps Production (Kilotons), Value (US$ Million), Price (US$/Ton) and Gross Margin (2018-2023)
- Table 95. Sun Ace Kakoh Main Business and Markets Served
- Table 96. BELIKE Chemical Metallic Soaps Company Information
- Table 97. BELIKE Chemical Metallic Soaps Specification and Specification
- Table 98. BELIKE Chemical Metallic Soaps Production (Kilotons), Value (US$ Million), Price (US$/Ton) and Gross Margin (2018-2023)
- Table 99. BELIKE Chemical Main Business and Markets Served
- Table 100. PMC Biogenix Metallic Soaps Company Information
- Table 101. PMC Biogenix Metallic Soaps Specification and Specification
- Table 102. PMC Biogenix Metallic Soaps Production (Kilotons), Value (US$ Million), Price (US$/Ton) and Gross Margin (2018-2023)
- Table 103. PMC Biogenix Main Business and Markets Served
- Table 104. Italmatch Chemicals Metallic Soaps Company Information
- Table 105. Italmatch Chemicals Metallic Soaps Specification and Specification
- Table 106. Italmatch Chemicals Metallic Soaps Production (Kilotons), Value (US$ Million), Price (US$/Ton) and Gross Margin (2018-2023)
- Table 107. Italmatch Chemicals Main Business and Markets Served
- Table 108. Chimiaran Metallic Soaps Company Information
- Table 109. Chimiaran Metallic Soaps Specification and Specification
- Table 110. Chimiaran Metallic Soaps Production (Kilotons), Value (US$ Million), Price (US$/Ton) and Gross Margin (2018-2023)
- Table 111. Chimiaran Main Business and Markets Served
- Table 112. Sogis Chemical Industry Metallic Soaps Company Information
- Table 113. Sogis Chemical Industry Metallic Soaps Specification and Specification
- Table 114. Sogis Chemical Industry Metallic Soaps Production (Kilotons), Value (US$ Million), Price (US$/Ton) and Gross Margin (2018-2023)
- Table 115. Sogis Chemical Industry Main Business and Markets Served
- Table 116. Akdeniz Chemson Metallic Soaps Company Information
- Table 117. Akdeniz Chemson Metallic Soaps Specification and Specification
- Table 118. Akdeniz Chemson Metallic Soaps Production (Kilotons), Value (US$ Million), Price (US$/Ton) and Gross Margin (2018-2023)
- Table 119. Akdeniz Chemson Main Business and Markets Served
- Table 120. Anhui Shafeng Advanced Material Metallic Soaps Company Information
- Table 121. Anhui Shafeng Advanced Material Metallic Soaps Specification and Specification
- Table 122. Anhui Shafeng Advanced Material Metallic Soaps Production (Kilotons), Value (US$ Million), Price (US$/Ton) and Gross Margin (2018-2023)
- Table 123. Anhui Shafeng Advanced Material Main Business and Markets Served
- Table 124. Tianjin Langhu Technology Metallic Soaps Company Information
- Table 125. Tianjin Langhu Technology Metallic Soaps Specification and Specification
- Table 126. Tianjin Langhu Technology Metallic Soaps Production (Kilotons), Value (US$ Million), Price (US$/Ton) and Gross Margin (2018-2023)
- Table 127. Tianjin Langhu Technology Main Business and Markets Served
- Table 128. Linghu Xinwang Chemical Metallic Soaps Company Information
- Table 129. Linghu Xinwang Chemical Metallic Soaps Specification and Specification
- Table 130. Linghu Xinwang Chemical Metallic Soaps Production (Kilotons), Value (US$ Million), Price (US$/Ton) and Gross Margin (2018-2023)
- Table 131. Linghu Xinwang Chemical Main Business and Markets Served
- Table 132. Peter Greven Metallic Soaps Company Information
- Table 133. Peter Greven Metallic Soaps Specification and Specification
- Table 134. Peter Greven Metallic Soaps Production (Kilotons), Value (US$ Million), Price (US$/Ton) and Gross Margin (2018-2023)
- Table 135. Peter Greven Main Business and Markets Served
- Table 136. Mittal Dhatu Metallic Soaps Company Information
- Table 137. Mittal Dhatu Metallic Soaps Specification and Specification
- Table 138. Mittal Dhatu Metallic Soaps Production (Kilotons), Value (US$ Million), Price (US$/Ton) and Gross Margin (2018-2023)
- Table 139. Mittal Dhatu Main Business and Markets Served
- Table 140. Jiangxi Hongyuan Metallic Soaps Company Information
- Table 141. Jiangxi Hongyuan Metallic Soaps Specification and Specification
- Table 142. Jiangxi Hongyuan Metallic Soaps Production (Kilotons), Value (US$ Million), Price (US$/Ton) and Gross Margin (2018-2023)
- Table 143. Jiangxi Hongyuan Main Business and Markets Served
- Table 144. Valtris Specialty Chemicals Metallic Soaps Company Information
- Table 145. Valtris Specialty Chemicals Metallic Soaps Specification and Specification
- Table 146. Valtris Specialty Chemicals Metallic Soaps Production (Kilotons), Value (US$ Million), Price (US$/Ton) and Gross Margin (2018-2023)
- Table 147. Valtris Specialty Chemicals Main Business and Markets Served
- Table 148. James M. Brown Metallic Soaps Company Information
- Table 149. James M. Brown Metallic Soaps Specification and Specification
- Table 150. James M. Brown Metallic Soaps Production (Kilotons), Value (US$ Million), Price (US$/Ton) and Gross Margin (2018-2023)
- Table 151. James M. Brown Main Business and Markets Served
- Table 152. Hangzhou Oleochemicals Metallic Soaps Company Information
- Table 153. Hangzhou Oleochemicals Metallic Soaps Specification and Specification
- Table 154. Hangzhou Oleochemicals Metallic Soaps Production (Kilotons), Value (US$ Million), Price (US$/Ton) and Gross Margin (2018-2023)
- Table 155. Hangzhou Oleochemicals Main Business and Markets Served
- Table 156. Evergreen Chemical Metallic Soaps Company Information
- Table 157. Evergreen Chemical Metallic Soaps Specification and Specification
- Table 158. Evergreen Chemical Metallic Soaps Production (Kilotons), Value (US$ Million), Price (US$/Ton) and Gross Margin (2018-2023)
- Table 159. Evergreen Chemical Main Business and Markets Served
- Table 160. Seoul Fine Chemical Metallic Soaps Company Information
- Table 161. Seoul Fine Chemical Metallic Soaps Specification and Specification
- Table 162. Seoul Fine Chemical Metallic Soaps Production (Kilotons), Value (US$ Million), Price (US$/Ton) and Gross Margin (2018-2023)
- Table 163. Seoul Fine Chemical Main Business and Markets Served
- Table 164. Raw Materials Key Suppliers Lists
- Table 165. Metallic Soaps Distributors List
- Table 166. Metallic Soaps Customers List
- Table 167. Metallic Soaps Market Trends
- Table 168. Metallic Soaps Market Drivers
- Table 169. Metallic Soaps Market Challenges
- Table 170. Research Programs/Design for This Report
- Table 171. Key Data Information from Secondary Sources
- Table 172. Key Data Information from Primary Sources
- Table 173. Authors List of This Report
- Table 174. QYR Business Unit and Senior & Team Lead Analysts
List of Figures
- Figure 1. Product Picture of Metallic Soaps
- Figure 2. Global Metallic Soaps Market Value by Type, (US$ Million) & (2018 VS 2022 VS 2029)
- Figure 3. Global Metallic Soaps Market Share by Type: 2022 VS 2029
- Figure 4. Zinc Soaps Product Picture
- Figure 5. Calcium Soaps Product Picture
- Figure 6. Aluminum Soaps Product Picture
- Figure 7. Magnesium Soaps Product Picture
- Figure 8. Sodium Soaps Product Picture
- Figure 9. Barium Soaps Product Picture
- Figure 10. Global Metallic Soaps Market Value by Application, (US$ Million) & (2022 VS 2029)
- Figure 11. Global Metallic Soaps Market Share by Application: 2022 VS 2029
- Figure 12. Plastics Industry
- Figure 13. Building & Construction
- Figure 14. Grease Industry
- Figure 15. Rubber Industry
- Figure 16. Paper Industry
- Figure 17. Personal Care
- Figure 18. Pharmaceuticals
- Figure 19. Global Metallic Soaps Production Value (US$ Million), 2018 VS 2022 VS 2029
- Figure 20. Global Metallic Soaps Production Value (US$ Million) & (2018-2029)
- Figure 21. Global Metallic Soaps Production Capacity (Kilotons) & (2018-2029)
- Figure 22. Global Metallic Soaps Production (Kilotons) & (2018-2029)
- Figure 23. Global Metallic Soaps Average Price (US$/Ton) & (2018-2029)
- Figure 24. Metallic Soaps Report Years Considered
- Figure 25. Metallic Soaps Production Share by Manufacturers in 2022
- Figure 26. Metallic Soaps Market Share by Company Type (Tier 1, Tier 2, and Tier 3): 2018 VS 2022
- Figure 27. The Global 5 Largest Players: Market Share by Metallic Soaps Revenue in 2022
- Figure 28. The Global 10 Largest Players: Market Share by Metallic Soaps Revenue in 2022
- Figure 29. Global Metallic Soaps Production Value by Region: 2018 VS 2022 VS 2029 (US$ Million)
- Figure 30. Global Metallic Soaps Production Value Market Share by Region: 2018 VS 2022 VS 2029
- Figure 31. Global Metallic Soaps Production Comparison by Region: 2018 VS 2022 VS 2029 (Kilotons)
- Figure 32. Global Metallic Soaps Production Market Share by Region: 2018 VS 2022 VS 2029
- Figure 33. North America Metallic Soaps Production Value (US$ Million) Growth Rate (2018-2029)
- Figure 34. Europe Metallic Soaps Production Value (US$ Million) Growth Rate (2018-2029)
- Figure 35. China Metallic Soaps Production Value (US$ Million) Growth Rate (2018-2029)
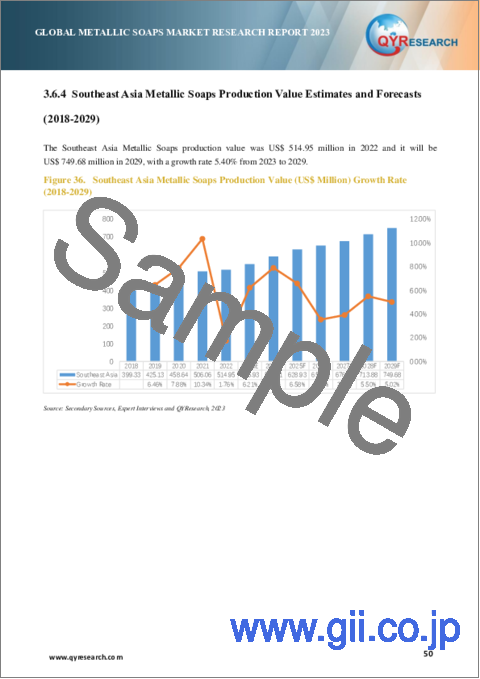
- Figure 36. Southeast Asia Metallic Soaps Production Value (US$ Million) Growth Rate (2018-2029)
- Figure 37. Global Metallic Soaps Consumption by Region: 2018 VS 2022 VS 2029 (Kilotons)
- Figure 38. Global Metallic Soaps Consumption Market Share by Region: 2018 VS 2022 VS 2029
- Figure 39. North America Metallic Soaps Consumption and Growth Rate (2018-2029) & (Kilotons)
- Figure 40. North America Metallic Soaps Consumption Market Share by Country (2018-2029)
- Figure 41. U.S. Metallic Soaps Consumption and Growth Rate (2018-2029) & (Kilotons)
- Figure 42. Canada Metallic Soaps Consumption and Growth Rate (2018-2029) & (Kilotons)
- Figure 43. Europe Metallic Soaps Consumption and Growth Rate (2018-2029) & (Kilotons)
- Figure 44. Europe Metallic Soaps Consumption Market Share by Country (2018-2029)
- Figure 45. Germany Metallic Soaps Consumption and Growth Rate (2018-2029) & (Kilotons)
- Figure 46. France Metallic Soaps Consumption and Growth Rate (2018-2029) & (Kilotons)
- Figure 47. U.K. Metallic Soaps Consumption and Growth Rate (2018-2029) & (Kilotons)
- Figure 48. Italy Metallic Soaps Consumption and Growth Rate (2018-2029) & (Kilotons)
- Figure 49. Russia Metallic Soaps Consumption and Growth Rate (2018-2029) & (Kilotons)
- Figure 50. Asia Pacific Metallic Soaps Consumption and Growth Rate (2018-2029) & (Kilotons)
- Figure 51. Asia Pacific Metallic Soaps Consumption Market Share by Region (2024-2029)
- Figure 52. China Metallic Soaps Consumption and Growth Rate (2018-2029) & (Kilotons)
- Figure 53. Japan Metallic Soaps Consumption and Growth Rate (2018-2029) & (Kilotons)
- Figure 54. South Korea Metallic Soaps Consumption and Growth Rate (2018-2029) & (Kilotons)
- Figure 55. India Metallic Soaps Consumption and Growth Rate (2018-2029) & (Kilotons)
- Figure 56. Australia Metallic Soaps Consumption and Growth Rate (2018-2029) & (Kilotons)
- Figure 57. Southeast Asia Metallic Soaps Consumption and Growth Rate (2018-2029) & (Kilotons)
- Figure 58. Latin America Metallic Soaps Consumption and Growth Rate (2018-2029) & (Kilotons)
- Figure 59. Latin America Metallic Soaps Consumption Market Share by Country (2018-2029)
- Figure 60. Mexico Metallic Soaps Consumption and Growth Rate (2018-2029) & (Kilotons)
- Figure 61. Brazil Metallic Soaps Consumption and Growth Rate (2018-2029) & (Kilotons)
- Figure 62. Argentina Metallic Soaps Consumption and Growth Rate (2018-2029) & (Kilotons)
- Figure 63. Middle East and Africa Metallic Soaps Consumption and Growth Rate (2018-2029) & (Kilotons)
- Figure 64. Middle East and Africa Metallic Soaps Consumption Market Share by Country (2018-2029)
- Figure 65. Middle East Metallic Soaps Consumption and Growth Rate (2018-2029) & (Kilotons)
- Figure 66. Africa Metallic Soaps Consumption and Growth Rate (2018-2029) & (Kilotons)
- Figure 67. Global Production Market Share of Metallic Soaps by Type (2018-2029)
- Figure 68. Global Production Value Market Share of Metallic Soaps by Type (2018-2029)
- Figure 69. Global Metallic Soaps Price (US$/Ton) by Type (2018-2029)
- Figure 70. Global Production Market Share of Metallic Soaps by Application (2018-2029)
- Figure 71. Global Production Value Market Share of Metallic Soaps by Application (2018-2029)
- Figure 72. Global Metallic Soaps Price (US$/Ton) by Application (2018-2029)
- Figure 73. Metallic Soaps Value Chain
- Figure 74. Manufacturing Cost Structure of Metallic Soaps
- Figure 75. Metallic Soaps Production Process
- Figure 76. Distributors Profiles
- Figure 77. Bottom-up and Top-down Approaches for This Report
- Figure 78. Data Triangulation
The global Metallic Soaps market was valued at US$ 2697.90 million in 2022 and is anticipated to reach US$ 3712.50 million by 2029, witnessing a CAGR of 4.73% during the forecast period 2023-2029. The influence of COVID-19 and the Russia-Ukraine War were considered while estimating market sizes.
North American market for Metallic Soaps is estimated to increase from US$ 471.64 million in 2023 to reach US$ 598.56 million by 2029, at a CAGR of 4.05% during the forecast period of 2023 through 2029.
Europe market for Metallic Soaps is estimated to increase from US$ 594.30 million in 2023 to reach US$ 758.75 million by 2029, at a CAGR of 4.16% during the forecast period of 2023 through 2029.
China market for Metallic Soaps is estimated to increase from US$ 850.60 million in 2023 to reach US$ 1141.33 million by 2029, at a CAGR of 5.02% during the forecast period of 2023 through 2029.
The major global manufacturers of Metallic Soaps include: Baerlocher, FACI SPA, Dover Chemical, CHNV Technology, Sun Ace Kakoh, BELIKE Chemical, PMC Biogenix, Italmatch Chemicals, and Chimiaran, etc. In 2022, the world's top three vendors accounted for approximately 18.89% of the revenue.
Report Scope
This report aims to provide a comprehensive presentation of the global market for Metallic Soaps, with both quantitative and qualitative analysis, to help readers develop business/growth strategies, assess the market competitive situation, analyze their position in the current marketplace, and make informed business decisions regarding Metallic Soaps.
The Metallic Soaps market size, estimations, and forecasts are provided in terms of output/shipments (Kilotons) and revenue ($ millions), considering 2022 as the base year, with history and forecast data for the period from 2018 to 2029. This report segments the global Metallic Soaps market comprehensively. Regional market sizes, concerning products by Type, by Application, and by players, are also provided.
For a more in-depth understanding of the market, the report provides profiles of the competitive landscape, key competitors, and their respective market ranks. The report also discusses technological trends and new product developments.
The report will help the Metallic Soaps manufacturers, new entrants, and industry chain related companies in this market with information on the revenues, production, and average price for the overall market and the sub-segments across the different segments, by company, by Type, by Application, and by regions.
By Company
- Baerlocher
- FACI SPA
- Dover Chemical
- CHNV Technology
- Sun Ace Kakoh
- BELIKE Chemical
- PMC Biogenix
- Italmatch Chemicals
- Chimiaran
- Sogis Chemical Industry
- Akdeniz Chemson
- Anhui Shafeng Advanced Material
- Tianjin Langhu Technology
- Linghu Xinwang Chemical
- Peter Greven
- Mittal Dhatu
- Jiangxi Hongyuan
- Valtris Specialty Chemicals
- James M. Brown
- Hangzhou Oleochemicals
- Evergreen Chemical
- Seoul Fine Chemical
Segment by Type
- Zinc Soaps
- Calcium Soaps
- Aluminum Soaps
- Magnesium Soaps
- Sodium Soaps
- Barium Soaps
- Others
Segment by Application
- Plastics Industry
- Building & Construction
- Grease Industry
- Rubber Industry
- Paper Industry
- Personal Care
- Pharmaceuticals
- Others
Production by Region
- North America
- Europe
- China
- Southeast Asia
Consumption by Region
- North America
- U.S.
- Canada
- Asia-Pacific
- China
- Japan
- South Korea
- India
- Australia
- Southeast Asia
- Europe
- Germany
- France
- U.K.
- Italy
- Russia
- Rest of Europe
- Latin America
- Mexico
- Brazil
- Argentina
- Rest of Latin America
- Middle East & Africa
- Middle East
- Africa
Core Chapters
- Chapter 1: Introduces the report scope of the report, executive summary of different market segments (by region, by Type, by Application, etc), including the market size of each market segment, future development potential, and so on. It offers a high-level view of the current state of the market and its likely evolution in the short to mid-term, and long term.
- Chapter 2: Detailed analysis of Metallic Soaps manufacturers competitive landscape, price, production and value market share, latest development plan, merger, and acquisition information, etc.
- Chapter 3: Production/output, value of Metallic Soaps by region/country. It provides a quantitative analysis of the market size and development potential of each region in the next six years.
- Chapter 4: Consumption of Metallic Soaps in regional level and country level. It provides a quantitative analysis of the market size and development potential of each region and its main countries and introduces the market development, future development prospects, market space, and production of each country in the world.
- Chapter 5: Provides the analysis of various market segments by Type, covering the market size and development potential of each market segment, to help readers find the blue ocean market in different market segments.
- Chapter 6: Provides the analysis of various market segments by Application, covering the market size and development potential of each market segment, to help readers find the blue ocean market in different downstream markets.
- Chapter 7: Provides profiles of key players, introducing the basic situation of the main companies in the market in detail, including product production/output, value, price, gross margin, product introduction, recent development, etc.
- Chapter 8: Analysis of industrial chain, including the upstream and downstream of the industry.
- Chapter 9: Introduces the market dynamics, latest developments of the market, the driving factors and restrictive factors of the market, the challenges and risks faced by manufacturers in the industry, and the analysis of relevant policies in the industry.
- Chapter 10: The main points and conclusions of the report.
Table of Contents
1 Metallic Soaps Market Overview
- 1.1 Product Definition
- 1.2 Metallic Soaps by Type
- 1.2.1 Global Metallic Soaps Market Value Growth Rate Analysis by Type: 2018 VS 2022 VS 2029
- 1.2.2 Zinc Soaps
- 1.2.3 Calcium Soaps
- 1.2.4 Aluminum Soaps
- 1.2.5 Magnesium Soaps
- 1.2.6 Sodium Soaps
- 1.2.7 Barium Soaps
- 1.2.8 Others
- 1.3 Metallic Soaps by Application
- 1.3.1 Global Metallic Soaps Market Value Growth Rate Analysis by Application: 2022 VS 2029
- 1.3.2 Plastics Industry
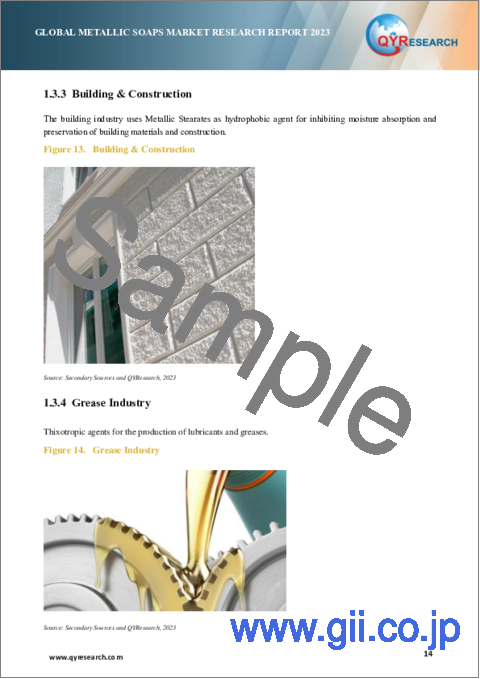
- 1.3.3 Building & Construction
- 1.3.4 Grease Industry
- 1.3.5 Rubber Industry
- 1.3.6 Paper Industry
- 1.3.7 Personal Care
- 1.3.8 Pharmaceuticals
- 1.3.9 Others
- 1.4 Global Market Growth Prospects
- 1.4.1 Global Metallic Soaps Production Value Estimates and Forecasts (2018-2029)
- 1.4.2 Global Metallic Soaps Production Capacity Estimates and Forecasts (2018-2029)
- 1.4.3 Global Metallic Soaps Production Estimates and Forecasts (2018-2029)
- 1.4.4 Global Metallic Soaps Market Average Price Estimates and Forecasts (2018-2029)
- 1.5 Assumptions and Limitations
2 Market Competition by Manufacturers
- 2.1 Global Metallic Soaps Production Market Share by Manufacturers (2018-2023)
- 2.2 Global Metallic Soaps Production Value Market Share by Manufacturers (2018-2023)
- 2.3 Global Key Players of Metallic Soaps, Industry Ranking, 2021 VS 2022
- 2.4 Global Metallic Soaps Market Share by Company Type (Tier 1, Tier 2, and Tier 3)
- 2.5 Global Metallic Soaps Average Price by Manufacturers (2018-2023)
- 2.6 Global Key Manufacturers of Metallic Soaps, Manufacturing Base Distribution and Headquarters
- 2.7 Global Key Manufacturers of Metallic Soaps Product Type
- 2.8 Global Key Manufacturers of Metallic Soaps, Establishment Date
- 2.9 Metallic Soaps Market Competitive Situation and Trends
- 2.9.1 Metallic Soaps Market Concentration Rate
- 2.9.2 Global 5 and 10 Largest Metallic Soaps Players Market Share by Revenue
- 2.10 Mergers & Acquisitions, Expansion
3 Metallic Soaps Production by Region
- 3.1 Global Metallic Soaps Production Value Estimates and Forecasts by Region: 2018 VS 2022 VS 2029
- 3.2 Global Metallic Soaps Production Value by Region (2018-2029)
- 3.2.1 Global Metallic Soaps Production Value Market Share by Region (2018-2023)
- 3.2.2 Global Forecasted Production Value of Metallic Soaps by Region (2024-2029)
- 3.3 Global Metallic Soaps Production Estimates and Forecasts by Region: 2018 VS 2022 VS 2029
- 3.4 Global Metallic Soaps Production by Region (2018-2029)
- 3.4.1 Global Metallic Soaps Production Market Share by Region (2018-2023)
- 3.4.2 Global Forecasted Production of Metallic Soaps by Region (2024-2029)
- 3.5 Global Metallic Soaps Market Price Analysis by Region (2018-2023)
- 3.6 Global Metallic Soaps Production and Value, Year-over-Year Growth
- 3.6.1 North America Metallic Soaps Production Value Estimates and Forecasts (2018-2029)
- 3.6.2 Europe Metallic Soaps Production Value Estimates and Forecasts (2018-2029)
- 3.6.3 China Metallic Soaps Production Value Estimates and Forecasts (2018-2029)
- 3.6.4 Southeast Asia Metallic Soaps Production Value Estimates and Forecasts (2018-2029)
4 Metallic Soaps Consumption by Region
- 4.1 Global Metallic Soaps Consumption Estimates and Forecasts by Region: 2018 VS 2022 VS 2029
- 4.2 Global Metallic Soaps Consumption by Region (2018-2029)
- 4.2.1 Global Metallic Soaps Consumption by Region (2018-2029)
- 4.2.2 Global Metallic Soaps Forecasted Consumption by Region (2024-2029)
- 4.3 North America
- 4.3.1 North America Metallic Soaps Consumption Growth Rate by Country: 2018 VS 2022 VS 2029
- 4.3.2 North America Metallic Soaps Consumption by Country (2018-2029)
- 4.3.3 U.S.
- 4.3.4 Canada
- 4.4 Europe
- 4.4.1 Europe Metallic Soaps Consumption Growth Rate by Country: 2018 VS 2022 VS 2029
- 4.4.2 Europe Metallic Soaps Consumption by Country (2018-2029)
- 4.4.3 Germany
- 4.4.4 France
- 4.4.5 U.K.
- 4.4.6 Italy
- 4.4.7 Russia
- 4.5 Asia Pacific
- 4.5.1 Asia Pacific Metallic Soaps Consumption Growth Rate by Country: 2018 VS 2022 VS 2029
- 4.5.2 Asia Pacific Metallic Soaps Consumption by Region (2018-2029)
- 4.5.3 China
- 4.5.4 Japan
- 4.5.5 South Korea
- 4.5.6 India
- 4.5.7 Australia
- 4.5.8 Southeast Asia
- 4.6 Latin America
- 4.6.1 Latin America Metallic Soaps Consumption Growth Rate by Country: 2018 VS 2022 VS 2029
- 4.6.2 Latin America Metallic Soaps Consumption by Country (2018-2029)
- 4.6.3 Mexico
- 4.6.4 Brazil
- 4.6.5 Argentina
- 4.7 Middle East and Africa
- 4.7.1 Middle East and Africa Metallic Soaps Consumption Growth Rate by Country: 2018 VS 2022 VS 2029
- 4.7.2 Middle East and Africa Metallic Soaps Consumption by Country (2018-2029)
- 4.7.3 Middle East
- 4.7.4 Africa
5 Segment by Type
- 5.1 Global Metallic Soaps Production by Type (2018-2029)
- 5.1.1 Global Metallic Soaps Production by Type (2018-2023)
- 5.1.2 Global Metallic Soaps Production by Type (2024-2029)
- 5.1.3 Global Metallic Soaps Production Market Share by Type (2018-2029)
- 5.2 Global Metallic Soaps Production Value by Type (2018-2029)
- 5.2.1 Global Metallic Soaps Production Value by Type (2018-2023)
- 5.2.2 Global Metallic Soaps Production Value by Type (2024-2029)
- 5.2.3 Global Metallic Soaps Production Value Market Share by Type (2018-2029)
- 5.3 Global Metallic Soaps Price by Type (2018-2029)
6 Segment by Application
- 6.1 Global Metallic Soaps Production by Application (2018-2029)
- 6.1.1 Global Metallic Soaps Production by Application (2018-2023)
- 6.1.2 Global Metallic Soaps Production by Application (2024-2029)
- 6.1.3 Global Metallic Soaps Production Market Share by Application (2018-2029)
- 6.2 Global Metallic Soaps Production Value by Application (2018-2029)
- 6.2.1 Global Metallic Soaps Production Value by Application (2018-2023)
- 6.2.2 Global Metallic Soaps Production Value by Application (2024-2029)
- 6.2.3 Global Metallic Soaps Production Value Market Share by Application (2018-2029)
- 6.3 Global Metallic Soaps Price by Application (2018-2029)
7 Key Companies Profiled
- 7.1 Baerlocher
- 7.1.1 Baerlocher Metallic Soaps Company Information
- 7.1.2 Baerlocher Metallic Soaps Product Portfolio
- 7.1.3 Baerlocher Metallic Soaps Production, Value, Price and Gross Margin (2018-2023)
- 7.1.4 Baerlocher Main Business and Markets Served
- 7.2 FACI SPA
- 7.2.1 FACI SPA Metallic Soaps Company Information
- 7.2.2 FACI SPA Metallic Soaps Product Portfolio
- 7.2.3 FACI SPA Metallic Soaps Production, Value, Price and Gross Margin (2018-2023)
- 7.2.4 FACI SPA Main Business and Markets Served
- 7.3 Dover Chemical
- 7.3.1 Dover Chemical Metallic Soaps Company Information
- 7.3.2 Dover Chemical Metallic Soaps Product Portfolio
- 7.3.3 Dover Chemical Metallic Soaps Production, Value, Price and Gross Margin (2018-2023)
- 7.3.4 Dover Chemical Main Business and Markets Served
- 7.4 CHNV Technology
- 7.4.1 CHNV Technology Metallic Soaps Company Information
- 7.4.2 CHNV Technology Metallic Soaps Product Portfolio
- 7.4.3 CHNV Technology Metallic Soaps Production, Value, Price and Gross Margin (2018-2023)
- 7.4.4 CHNV Technology Main Business and Markets Served
- 7.5 Sun Ace Kakoh
- 7.5.1 Sun Ace Kakoh Metallic Soaps Company Information
- 7.5.2 Sun Ace Kakoh Metallic Soaps Product Portfolio
- 7.5.3 Sun Ace Kakoh Metallic Soaps Production, Value, Price and Gross Margin (2018-2023)
- 7.5.4 Sun Ace Kakoh Main Business and Markets Served
- 7.6 BELIKE Chemical
- 7.6.1 BELIKE Chemical Metallic Soaps Company Information
- 7.6.2 BELIKE Chemical Metallic Soaps Product Portfolio
- 7.6.3 BELIKE Chemical Metallic Soaps Production, Value, Price and Gross Margin (2018-2023)
- 7.6.4 BELIKE Chemical Main Business and Markets Served
- 7.7 PMC Biogenix
- 7.7.1 PMC Biogenix Metallic Soaps Company Information
- 7.7.2 PMC Biogenix Metallic Soaps Product Portfolio
- 7.7.3 PMC Biogenix Metallic Soaps Production, Value, Price and Gross Margin (2018-2023)
- 7.7.4 PMC Biogenix Main Business and Markets Served
- 7.8 Italmatch Chemicals
- 7.8.1 Italmatch Chemicals Metallic Soaps Company Information
- 7.8.2 Italmatch Chemicals Metallic Soaps Product Portfolio
- 7.8.3 Italmatch Chemicals Metallic Soaps Production, Value, Price and Gross Margin (2018-2023)
- 7.8.4 Italmatch Chemicals Main Business and Markets Served
- 7.9 Chimiaran
- 7.9.1 Chimiaran Metallic Soaps Company Information
- 7.9.2 Chimiaran Metallic Soaps Product Portfolio
- 7.9.3 Chimiaran Metallic Soaps Production, Value, Price and Gross Margin (2018-2023)
- 7.9.4 Chimiaran Main Business and Markets Served
- 7.10 Sogis Chemical Industry
- 7.10.1 Sogis Chemical Industry Metallic Soaps Company Information
- 7.10.2 Sogis Chemical Industry Metallic Soaps Product Portfolio
- 7.10.3 Sogis Chemical Industry Metallic Soaps Production, Value, Price and Gross Margin (2018-2023)
- 7.10.4 Sogis Chemical Industry Main Business and Markets Served
- 7.11 Akdeniz Chemson
- 7.11.1 Akdeniz Chemson Metallic Soaps Company Information
- 7.11.2 Akdeniz Chemson Metallic Soaps Product Portfolio
- 7.11.3 Akdeniz Chemson Metallic Soaps Production, Value, Price and Gross Margin (2018-2023)
- 7.11.4 Akdeniz Chemson Main Business and Markets Served
- 7.12 Anhui Shafeng Advanced Material
- 7.12.1 Anhui Shafeng Advanced Material Metallic Soaps Company Information
- 7.12.2 Anhui Shafeng Advanced Material Metallic Soaps Product Portfolio
- 7.12.3 Anhui Shafeng Advanced Material Metallic Soaps Production, Value, Price and Gross Margin (2018-2023)
- 7.12.4 Anhui Shafeng Advanced Material Main Business and Markets Served
- 7.13 Tianjin Langhu Technology
- 7.13.1 Tianjin Langhu Technology Metallic Soaps Company Information
- 7.13.2 Tianjin Langhu Technology Metallic Soaps Product Portfolio
- 7.13.3 Tianjin Langhu Technology Metallic Soaps Production, Value, Price and Gross Margin (2018-2023)
- 7.13.4 Tianjin Langhu Technology Main Business and Markets Served
- 7.14 Linghu Xinwang Chemical
- 7.14.1 Linghu Xinwang Chemical Metallic Soaps Company Information
- 7.14.2 Linghu Xinwang Chemical Metallic Soaps Product Portfolio
- 7.14.3 Linghu Xinwang Chemical Metallic Soaps Production, Value, Price and Gross Margin (2018-2023)
- 7.14.4 Linghu Xinwang Chemical Main Business and Markets Served
- 7.15 Peter Greven
- 7.15.1 Peter Greven Metallic Soaps Company Information
- 7.15.2 Peter Greven Metallic Soaps Product Portfolio
- 7.15.3 Peter Greven Metallic Soaps Production, Value, Price and Gross Margin (2018-2023)
- 7.15.4 Peter Greven Main Business and Markets Served
- 7.16 Mittal Dhatu
- 7.16.1 Mittal Dhatu Metallic Soaps Company Information
- 7.16.2 Mittal Dhatu Metallic Soaps Product Portfolio
- 7.16.3 Mittal Dhatu Metallic Soaps Production, Value, Price and Gross Margin (2018-2023)
- 7.16.4 Mittal Dhatu Main Business and Markets Served
- 7.17 Jiangxi Hongyuan
- 7.17.1 Jiangxi Hongyuan Metallic Soaps Company Information
- 7.17.2 Jiangxi Hongyuan Metallic Soaps Product Portfolio
- 7.17.3 Jiangxi Hongyuan Metallic Soaps Production, Value, Price and Gross Margin (2018-2023)
- 7.17.4 Jiangxi Hongyuan Main Business and Markets Served
- 7.18 Valtris Specialty Chemicals
- 7.18.1 Valtris Specialty Chemicals Metallic Soaps Company Information
- 7.18.2 Valtris Specialty Chemicals Metallic Soaps Product Portfolio
- 7.18.3 Valtris Specialty Chemicals Metallic Soaps Production, Value, Price and Gross Margin (2018-2023)
- 7.18.4 Valtris Specialty Chemicals Main Business and Markets Served
- 7.19 James M. Brown
- 7.19.1 James M. Brown Metallic Soaps Company Information
- 7.19.2 James M. Brown Metallic Soaps Product Portfolio
- 7.19.3 James M. Brown Metallic Soaps Production, Value, Price and Gross Margin (2018-2023)
- 7.19.4 James M. Brown Main Business and Markets Served
- 7.20 Hangzhou Oleochemicals
- 7.20.1 Hangzhou Oleochemicals Metallic Soaps Company Information
- 7.20.2 Hangzhou Oleochemicals Metallic Soaps Product Portfolio
- 7.20.3 Hangzhou Oleochemicals Metallic Soaps Production, Value, Price and Gross Margin (2018-2023)
- 7.20.4 Hangzhou Oleochemicals Main Business and Markets Served
- 7.21 Evergreen Chemical
- 7.21.1 Evergreen Chemical Metallic Soaps Company Information
- 7.21.2 Evergreen Chemical Metallic Soaps Product Portfolio
- 7.21.3 Evergreen Chemical Metallic Soaps Production, Value, Price and Gross Margin (2018-2023)
- 7.21.4 Evergreen Chemical Main Business and Markets Served
- 7.22 Seoul Fine Chemical
- 7.22.1 Seoul Fine Chemical Metallic Soaps Company Information
- 7.22.2 Seoul Fine Chemical Metallic Soaps Product Portfolio
- 7.22.3 Seoul Fine Chemical Metallic Soaps Production, Value, Price and Gross Margin (2018-2023)
- 7.22.4 Seoul Fine Chemical Main Business and Markets Served
8 Industry Chain and Sales Channels Analysis
- 8.1 Metallic Soaps Industry Chain Analysis
- 8.2 Metallic Soaps Key Raw Materials
- 8.2.1 Key Raw Materials
- 8.2.2 Raw Materials Key Suppliers
- 8.3 Proportion of Manufacturing Cost Structure
- 8.4 Metallic Soaps Production Mode & Process
- 8.5 Metallic Soaps Distributors
- 8.6 Metallic Soaps Customers
9 Metallic Soaps Market Dynamics
- 9.1 Metallic Soaps Industry Trends
- 9.2 Metallic Soaps Market Drivers
- 9.3 Metallic Soaps Market Challenges
10 Research Findings and Conclusion
11 Methodology and Data Source
- 11.1 Methodology/Research Approach
- 11.1.1 Research Programs/Design
- 11.1.2 Market Size Estimation
- 11.1.3 Market Breakdown and Data Triangulation
- 11.2 Data Source
- 11.2.1 Secondary Sources
- 11.2.2 Primary Sources
- 11.3 Author List
- 11.4 Disclaimer