|
|
市場調査レポート
商品コード
1363498
固形石鹸の市場規模、シェア、動向分析レポート:タイプ別、用途別、流通チャネル別、地域別、セグメント予測、2023年~2030年Bar Soap Market Size, Share & Trends Analysis Report By Type (Organic, Synthetic), By Application (Hair Care, Body/Skin Care, Facial Care, Specialized), By Distribution Channel, By Region, And Segment Forecasts, 2023 - 2030 |
||||||
|
|
|||||||
カスタマイズ可能
|
|||||||


| 固形石鹸の市場規模、シェア、動向分析レポート:タイプ別、用途別、流通チャネル別、地域別、セグメント予測、2023年~2030年 |
|
出版日: 2023年09月20日
発行: Grand View Research
ページ情報: 英文 75 Pages
納期: 2~10営業日
|

- 全表示
- 概要
- 図表
- 目次
固形石鹸市場の成長と動向:
Grand View Research, Inc.の最新レポートによると、世界の固形石鹸市場規模は2030年までに431億米ドルに達する見込みです。
同市場は2023年から2030年にかけてCAGR 4.6%で拡大する見込みです。ホテルやレストラン、ヘルスクラブ、家庭、施設センターなど、様々なエンドユーザーからの固形石鹸需要の高まりが市場成長を後押ししています。さらに、ユニークな香り、視覚的に魅力的なデザイン、高級成分を使用した高品質の職人技バーソープに対する消費者の需要が高まっています。
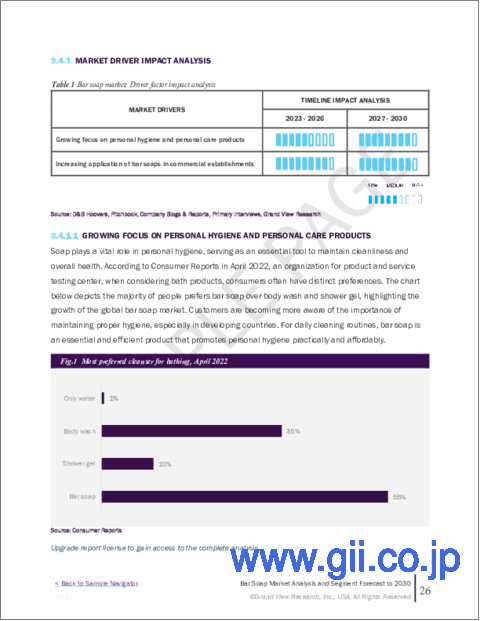
消費者はスキンケアの習慣を、個人的な衛生状態やセルフケアを維持するための日常的な儀式の一部として重視しています。2019年3月の世界・コスメティック・インダストリー誌の記事によると、かなりの割合の消費者が複数ステップのルーチンを守り、洗顔とモイスチャライザーの塗布を少なくとも1日2回行っています。洗顔重視の高まりは、固形石鹸の世界の需要を牽引しています。
一部のブランドはカスタマイズ可能な固形石鹸を提供しており、消費者は肌の悩みや好みに基づいて特定の成分を選択することができます。このパーソナライズされたアプローチは、オーダーメイドのスキンケアソリューションを求める消費者の共感を呼んでいます。
テクノロジーとイノベーションが固形石鹸市場の中心を占め続ける中、個性的で興味深い固形石鹸への欲求が高まっています。例えば、2022年7月、カナダのアルバータ州に本拠を置くクリーンテック企業CleanO2は、温室効果ガスの排出を抑制するため、温室効果ガスであるCO2をCleanO2ソープバーの主成分であるパールアッシュに変換する炭素捕捉ボディーバーソープの発売を発表しました。
固形石鹸市場の製造動向は、環境問題への対応と持続可能性の促進にますます重点を置くようになっています。メーカー各社は、環境に優しい技術を採用し、二酸化炭素排出量の少ないオーガニック固形石鹸を製造しています。また、廃棄物を減らし、環境に配慮した習慣を優先する顧客の原則に沿うために、生分解性包装を取り入れています。フードサービスエリア、ヘルスケア施設、オフィス、娯楽施設など、様々な公共の場で固形石鹸が広く使用されるようになり、ユニークな形や香りの固形石鹸の需要が高まっています。このような環境では、固形石鹸は必要不可欠な衛生用品としての役割を果たすだけでなく、消費者に手洗いを促す役割も果たしています。
固形石鹸市場レポートハイライト
- 合成固形石鹸分野は2022年に最大の売上シェアを占め、世界市場を独占しました。敏感肌、乾燥肌、ニキビ肌など、特定の肌の悩みに対応する合成固形石鹸の需要が高いです。こうした独自のニーズを満たすため、パーソナルケアブランドは消費者に特化した処方の開発に注力しています。
- 特殊固形石鹸セグメントは、予測期間中に最も速い成長を示すと推定されます。特殊な固形石鹸には、コラーゲン、レチノール、抗酸化物質などの成分が含まれていることが多く、老化の兆候をターゲットにし、より若々しい外見を促進します。
- アジア太平洋地域の固形石鹸市場は、予測期間中に最も急成長すると予想されます。リンゴ酢、オニオンシードオイル、その他のアーユルヴェーダ的なオプションなどの配合が、合成のものよりも天然の代替品への需要を生み出しています。また、固形石鹸会社はより幅広い消費者層を獲得するため、様々な量の手作り固形石鹸を提供しています。
目次
第1章 調査手法と範囲
第2章 エグゼクティブサマリー
第3章 固形石鹸市場の変数、動向、範囲
- 市場系統の見通し
- 業界のバリューチェーン分析
- 小売チャネル分析
- 利益率分析
- 市場力学
- 市場促進要因の分析
- 市場抑制要因分析
- 業界の課題
- 業界の機会
- 市場参入戦略
- 業界分析ツール
- 業界分析- ポーターのファイブフォース分析
第4章 消費者行動分析
- 人口統計分析
- 消費者の動向と好み
- 購入決定に影響を与える要因
- 消費者向け製品の採用
- 所見と推奨事項
第5章 固形石鹸市場:タイプ別推定・動向分析
- タイプの変動分析と市場シェア、2022年と2030年
- タイプ別
第6章 固形石鹸市場:用途別推定・動向分析
- 用途の変動分析と市場シェア、2022年と2030年
- 用途別
第7章 固形石鹸市場:流通チャネル別推定・動向分析
- 流通チャネルの変動分析と市場シェア、2022年と2030年
- 流通チャネル別
第8章 固形石鹸市場:地域別推定・動向分析
- 地域変動分析と市場シェア、2022年と2030年
- 北米
- 北米固形石鹸市場の推定・予測、2017~2030年
- 米国
- カナダ
- 欧州
- 欧州の固形石鹸市場の推定・予測、2017~2030年
- 英国
- ドイツ
- フランス
- アジア太平洋地域
- アジア太平洋地域の固形石鹸市場の推定・予測、2017~2030年
- 中国
- インド
- 日本
- 中南米
- 中南米の固形石鹸市場の推定・予測、2017~2030年
- ブラジル
- 中東とアフリカ
- 中東およびアフリカの固形石鹸市場の推定・予測、2017年から2030年
- 南アフリカ
第9章 競合情勢
- 主要市場参入企業による最近の動向と影響分析
- 主要企業
- Lush Retail Ltd.
- Ethique, Inc.
- Unilever
- Chagrin Valley Soap & Salve Co.
- Galderma S.A.
- The Body Shop
- Johnson & Johnson
- KIRK'S NATURAL LLC
- Tom's of Maine
- Dr. Bronner's
- 企業の分類
- 参入企業の概要
- 財務実績
- 製品のベンチマーク
- 企業市場シェア分析、2022年(金額シェア%)
- 企業ヒートマップ分析
- 戦略マッピング
- 小売パートナーシップ
- 新しい場所での拡大
- 持続可能性
- 製品の発売
List of Tables
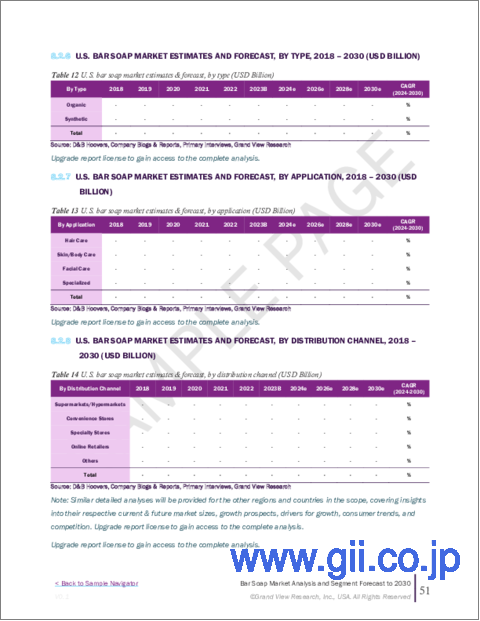
- 1. Bar soap market estimates & forecast, by type (USD Million)
- 2. Bar soap market estimates & forecast, by application (USD Million)
- 3. Bar soap market estimates & forecast, by distribution channel (USD Million)
- 4. U.S. macro-economic outlay
- 5. Canada macro-economic outlay
- 6. U.K. macro-economic outlay
- 7. Germany macro-economic outlay
- 8. France macro-economic outlay
- 9. China macro-economic outlay
- 10. India macro-economic outlay
- 11. Japan macro-economic outlay
- 12. Brazil macro-economic outlay
- 13. South Africa macro-economic outlay
- 14. Recent developments & impact analysis, by key market participants
List of Figures
- 1. Bar soap market segmentation
- 2. Information procurement
- 3. Primary research pattern
- 4. Primary research approaches
- 5. Primary research process
- 6. Market Snapshot
- 7. Segment Snapshot
- 8. Competitive Landscape Snapshot
- 9. Bar soap market - Industry value chain analysis
- 10. Bar soap market dynamics
- 11. Bar soap market: PORTER's Five Forces analysis
- 12. Bar soap market, by type: Key takeaways
- 13. Bar soap market, by type: Market share, 2022 & 2030
- 14. Organic bar soap market estimates & forecasts, 2017 - 2030 (USD Million)
- 15. Synthetic bar soap market estimates & forecasts, 2017 - 2030 (USD Million)
- 16. Bar soap market, by application: Key takeaways
- 17. Bar soap market, by application: Market share, 2022 & 2030
- 18. Bar soap market estimates & forecasts, for hair care, 2017 - 2030 (USD Million)
- 19. Bar soap market estimates & forecasts, for skin/body care, 2017 - 2030 (USD Million)
- 20. Bar soap market estimates & forecasts, for facial care, 2017 - 2030 (USD Million)
- 21. Specialized bar soap market estimates & forecasts, 2017 - 2030 (USD Million)
- 22. Bar soap market, by distribution channel: Key takeaways
- 23. Bar soap market, by distribution channel: Market share, 2022 & 2030
- 24. Bar soap market estimates & forecasts, through supermarkets and hypermarkets, 2017 - 2030 (USD Million)
- 25. Bar soap market estimates & forecasts, through convenience stores, 2017 - 2030 (USD Million)
- 26. Bar soap market estimates & forecasts, through specialty stores, 2017 - 2030 (USD Million)
- 27. Bar soap market estimates & forecasts, through online retailers, 2017 - 2030 (USD Million)
- 28. Bar soap market estimates & forecasts, through other distribution channels, 2017 - 2030 (USD Million)
- 29. Bar soap market revenue, by region, 2022 & 2030 (USD Million)
- 30. Regional marketplace: Key takeaways
- 31. North America Bar soap market estimates & forecast, 2017 - 2030 (USD Million)
- 32. U.S. Bar soap market estimates & forecast, 2017 - 2030 (USD Million)
- 33. Canada Bar soap market estimates & forecast, 2017 - 2030 (USD Million)
- 34. Europe Bar soap market estimates & forecast, 2017 - 2030 (USD Million)
- 35. U.K. Bar soap market estimates & forecast, 2017 - 2030 (USD Million)
- 36. Germany Bar soap market estimates & forecast, 2017 - 2030 (USD Million)
- 37. France Bar soap market estimates & forecasts, 2017 - 2030 (USD Million)
- 38. Asia Pacific Bar soap market estimates & forecast, 2017 - 2030 (USD Million)
- 39. China Bar soap market estimates & forecast, 2017 - 2030 (USD Million)
- 40. India Bar soap market estimates & forecast, 2017 - 2030 (USD Million)
- 41. Japan Bar soap market estimates & forecast, 2017 - 2030 (USD Million)
- 42. Central & South America Bar soap market estimates & forecast, 2017 - 2030 (USD Million)
- 43. Brazil Bar soap market estimates & forecast, 2017 - 2030 (USD Million)
- 44. Middle East & Africa Bar soap market estimates & forecast, 2017 - 2030 (USD Million)
- 45. South Africa Bar soap market estimates & forecast, 2017 - 2030 (USD Million)
- 46. Key company categorization
- 47. Company market share analysis, 2022 (Value % Share)
- 48. Strategic Framework
Bar Soap Market Growth & Trends:
The global bar soap market size is expected to reach USD 43.1 billion by 2030, according to a new report by Grand View Research, Inc.. The market is expected to expand at a CAGR of 4.6% from 2023 to 2030. The rising demand for bar soaps from various end-users, including hotels and restaurants, health clubs, homes, institutional centers, and others, is boosting market growth. Moreover, there is a growing consumer demand for high-quality artisanal bar soaps with unique scents, visually appealing designs, and premium ingredients.
Consumers value skincare routines as a positive part of their daily rituals to maintain their personal hygiene as well as self-care. According to an article in the Global Cosmetic Industry in March 2019, a significant percentage of them follow multi-step routines, washing their face and applying moisturizer at least twice daily. The growing emphasis on facial cleansing is driving the global demand for bar soap.
Some brands offer customizable facial soap bars, allowing consumers to select specific ingredients based on their skin concerns or preferences. This personalized approach has resonated well with consumers who seek tailor-made skincare solutions. Al? Goods, based in Arizona, U.S., is one such company offering custom bar soaps with respect to shape, scent, color, and ingredients. Customers can choose from a range of essential oils and all-natural plant-based colorants to create special one-of-a-kind soap bars. They can also choose from various natural additives like calendula, aloe vera, oats, and honey, along with additional kinds of butter and oils such as coconut oil, cocoa butter, and shea butter.
The desire for distinctive and interesting bar soaps has grown as technology and innovation continue to take center stage in the market for bar soaps. For instance, in July 2022, the Alberta, Canada-based cleantech company CleanO2 announced the launch of a carbon capture body bar soap that converts CO2, a greenhouse gas, into pearl ash, the main ingredient in CleanO2 soap bars, in an effort to curb greenhouse gas emissions.
Manufacturing trends in the market for bar soaps are increasingly focused on addressing environmental concerns and promoting sustainability. Manufacturers are adopting eco-friendly techniques to produce organic soap bars with a smaller carbon impact. They are also incorporating biodegradable packaging to reduce waste and align with the principles of eco-aware customers who prioritize green practices. The extensive use of bar soaps in various public places, such as food service areas, healthcare facilities, offices, and entertainment venues, has led to an increased demand for them in unique shapes and fragrances. In these settings, bar soaps not only serve as essential hygiene products but also encourage consumers to wash their hands.
Bar Soap Market Report Highlights:
- The synthetic bar soap segment dominated the global market by accounting for the largest revenue share in 2022. Synthetic soap bars that address particular skin concerns such as sensitive skin, dryness, or acne-prone skin are in high demand. In order to meet these unique needs, personal care brands have been concentrating on developing formulae that are specifically suited to the consumer
- The specialized bar soap segment is estimated to show the fastest growth over the forecast period. Specialty bars often include ingredients like collagen, retinol, or antioxidants, targeting signs of aging and promoting a more youthful appearance
- The Asia Pacific market for bar soaps is anticipated to have the fastest growth over the forecast period. Formulations such as apple cider vinegar, onion seed oil, and other Ayurvedic options have created a demand for natural alternatives over synthetic ones. Also, bar soap companies are providing hand-crafted bar soaps in different quantities to gain a wider consumer base
Table of Contents
Chapter 1. Methodology and Scope
- 1.1. Market Segmentation & Scope
- 1.2. Market Definition
- 1.3. Information Procurement
- 1.3.1. Purchased Database
- 1.3.2. GVR's Internal Database
- 1.3.3. Secondary Sources & Third-Party Perspectives
- 1.3.4. Primary Research
- 1.4. Information Analysis
- 1.4.1. Data Analysis Models
- 1.5. Market Formulation & Data Visualization
- 1.6. Data Validation & Publishing
Chapter 2. Executive Summary
- 2.1. Market Outlook
- 2.2. Type Outlook
- 2.3. Application Outlook
- 2.4. Distribution channel Outlook
- 2.5. Regional Outlook
Chapter 3. Bar Soap Market Variables, Trends & Scope
- 3.1. Market Lineage Outlook
- 3.2. Industry Value Chain Analysis
- 3.2.1. Retail Channel Analysis
- 3.2.2. Profit Margin Analysis
- 3.3. Market Dynamics
- 3.3.1. Market Driver Analysis
- 3.3.2. Market Restraint Analysis
- 3.3.3. Industry Challenges
- 3.3.4. Industry Opportunities
- 3.4. Market Entry Strategies
- 3.5. Industry Analysis Tools
- 3.5.1. Industry Analysis - Porter's Five Forces
- 3.5.1.1. Supplier Power
- 3.5.1.2. Buyer Power
- 3.5.1.3. Substitution Threat
- 3.5.1.4. Threat from New Entrant
- 3.5.1.5. Competitive Rivalry
- 3.5.1.6. Industry opportunities
- 3.5.1. Industry Analysis - Porter's Five Forces
Chapter 4. Consumer Behavior Analysis
- 4.1. Demographic Analysis
- 4.2. Consumer Trends and Preferences
- 4.3. Factors Affecting Buying Decision
- 4.4. Consumer Product Adoption
- 4.5. Observations & Recommendations
Chapter 5. Bar Soap Market: Type Estimates & Trend Analysis
- 5.1. Type Movement Analysis & Market Share, 2022 & 2030
- 5.2. Bar Soap Market Estimates & Forecast, By Type (USD Million)
- 5.2.1. Organic
- 5.2.2. Synthetic
Chapter 6. Bar Soap Market: Application Estimates & Trend Analysis
- 6.1. Application Movement Analysis & Market Share, 2022 & 2030
- 6.2. Bar Soap Market Estimates & Forecast, By Application (USD Million)
- 6.2.1. Hair Care
- 6.2.2. Skin/Body Care
- 6.2.3. Facial Care
- 6.2.4. Specialized
Chapter 7. Bar Soap Market: Distribution Channel Estimates & Trend Analysis
- 7.1. Distribution channel Movement Analysis & Market Share, 2022 & 2030
- 7.2. Bar Soap Market Estimates & Forecast, By Distribution Channel (USD Million)
- 7.2.1. Supermarkets/Hypermarkets
- 7.2.2. Convenience Stores
- 7.2.3. Specialty Stores
- 7.2.4. Online Retailers
- 7.2.5. Others
Chapter 8. Bar Soap Market: Regional Estimates & Trend Analysis
- 8.1. Regional Movement Analysis & Market Share, 2022 & 2030
- 8.2. North America
- 8.2.1. North America bar soap market estimates & forecast, 2017 - 2030 (USD Million)
- 8.2.2. U.S.
- 8.2.2.1. Key country dynamics
- 8.2.2.2. U.S. bar soap market estimates & Forecast, 2017 - 2030 (USD Million)
- 8.2.3. Canada
- 8.2.3.1. Key country dynamics
- 8.2.3.2. Canada bar soap market estimates & Forecast, 2017 - 2030 (USD Million)
- 8.3. Europe
- 8.3.1. Europe bar soap market estimates & forecast, 2017 - 2030 (USD Million)
- 8.3.2. U.K.
- 8.3.2.1. Key country dynamics
- 8.3.2.2. U.K. bar soap market estimates & forecast, 2017 - 2030 (USD Million)
- 8.3.3. Germany
- 8.3.3.1. Key country dynamics
- 8.3.3.2. Germany bar soap market estimates & forecast, 2017 - 2030 (USD Million)
- 8.3.4. France
- 8.3.4.1. Key country dynamics
- 8.3.4.2. France bar soap market estimates & forecast, 2017 - 2030 (USD Million)
- 8.4. Asia Pacific
- 8.4.1. Asia Pacific bar soap market estimates & Forecast, 2017 - 2030 (USD Million)
- 8.4.2. China
- 8.4.2.1. Key country dynamics
- 8.4.2.2. China bar soap market estimates & forecast, 2017 - 2030 (USD Million)
- 8.4.3. India
- 8.4.3.1. Key country dynamics
- 8.4.3.2. India bar soap market estimates & forecast, 2017 - 2030 (USD Million)
- 8.4.4. Japan
- 8.4.4.1. Key country dynamics
- 8.4.4.2. Japan bar soap market estimates & forecast, 2017 - 2030 (USD Million)
- 8.5. Central & South America
- 8.5.1. Central & South America bar soap market estimates & forecast, 2017 - 2030 (USD Million)
- 8.5.2. Brazil
- 8.5.2.1. Key country dynamics
- 8.5.2.2. Brazil bar soap market estimates & forecast, 2017 - 2030 (USD Million)
- 8.6. Middle East & Africa
- 8.6.1. Middle East & Africa bar soap market estimates & forecast, 2017 - 2030 (USD Million)
- 8.6.2. South Africa
- 8.6.2.1. Key country dynamics
- 8.6.2.2. South Africa bar soap market estimates & forecast, 2017 - 2030 (USD Million)
Chapter 9. Competitive Landscape
- 9.1. Recent Developments & Impact Analysis, By Key Market Participants
- 9.2. Key Companies
- 9.2.1. Lush Retail Ltd.
- 9.2.2. Ethique, Inc.
- 9.2.3. Unilever
- 9.2.4. Chagrin Valley Soap & Salve Co.
- 9.2.5. Galderma S.A.
- 9.2.6. The Body Shop
- 9.2.7. Johnson & Johnson
- 9.2.8. KIRK'S NATURAL LLC
- 9.2.9. Tom's of Maine
- 9.2.10. Dr. Bronner's
- 9.3. Company Categorization
- 9.4. Participant's Overview
- 9.5. Financial Performance
- 9.6. Product Benchmarking
- 9.7. Company Market Share Analysis, 2022 (Value % Share)
- 9.8. Company Heat Map Analysis
- 9.9. Strategy Mapping
- 9.9.1. Retail Partnerships
- 9.9.2. Expanding At New Locations
- 9.9.3. Sustainability
- 9.9.4. Product Launch
