|
|
市場調査レポート
商品コード
1227586
軟磁性材料の世界市場:販売分析 (2023年)Global Soft Magnetic Materials Sales Market Report 2023 |
||||||
|
|
|||||||
|
● お客様のご希望に応じて、既存データの加工や未掲載情報(例:国別セグメント)の追加などの対応が可能です。 詳細はお問い合わせください。 |
|||||||


| 軟磁性材料の世界市場:販売分析 (2023年) |
|
出版日: 2023年03月01日
発行: QYResearch
ページ情報: 英文 199 Pages
納期: 2~3営業日
|
- 全表示
- 概要
- 図表
- 目次
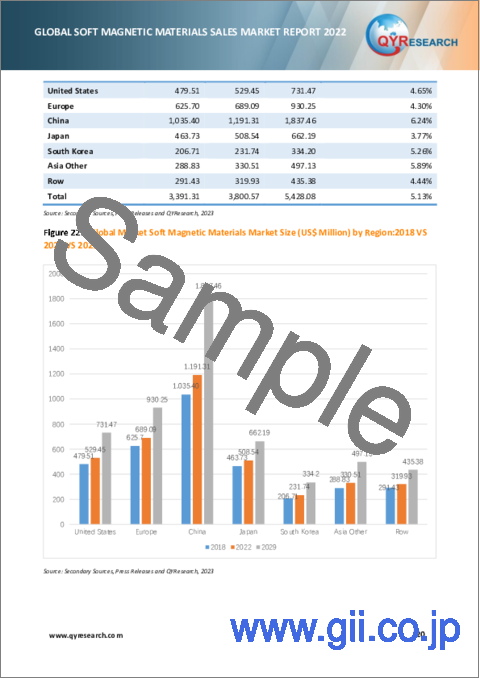
世界の軟磁性材料の市場規模は、2022年に38億米ドルに達した後、予測期間中 (2023年~2029年) に5.13%のCAGRで成長し、2029年までに54億米ドルの再調整規模になると予測されます。
この健康危機による経済変化を十分に考慮し、2022年に世界市場の67.70%を占めるソフトフェライト材料は、2023年から2029年の間に改訂4.77%のCAGRで成長し、2029年までに36億米ドルに達すると予測されます。一方、自動車・輸送機械の分野はこの予測期間を通じて、CAGRが6.71%に改訂されています。
2022年に、米国の軟磁性材料の市場規模は5億2,945万米ドル、中国は11億9,131万米ドルでした。米国のシェアは2022年に13.93%、中国のシェアは31.35%で、中国のシェアは2029年に33.85%に達し、分析期間を通じて6.24%のCAGRで推移する、と予測されています。
当レポートでは、世界の軟磁性材料の市場について分析し、種類別・用途別・地域別 (国別) の市場動向の見通し (2018年~2029年)、主要企業のプロファイルなどについて調査しております。
目次
第1章 軟磁性材料:市場概要
- 軟磁性材料:製品の範囲
- 軟磁性材料:種類別
- 販売:種類別 (2018年・2022年・2029年)
- ソフトフェライト材料
- 金属磁性粉末材料
- アモルファス磁性材料
- ナノ結晶軟磁性材料
- 用途別の市場セグメント
- 販売の比較:用途別 (2018年・2022年・2029年)
- 通信機器
- 家電製品・民生用電子機器
- 自動車・輸送機械
- 太陽光発電・風力発電
- 照明産業
- コンピュータ・オフィス機器
- その他
- 世界の軟磁性材料市場:推定・予測 (2018年~2029年)
- 市場規模の成長率 (金額、2018年~2029年)
- 市場規模の成長率 (数量、2018年~2029年)
- 価格動向 (2018年~2029年)
- 前提・制約条件
第2章 軟磁性材料:地域別の推定・予測
- 市場規模:地域別 (2018年・2022年・2029年)
- 遡及的市場シナリオ:地域別 (2018年~2023年)
- 市場の推計・予測:地域別 (2024年~2029年)
- 地域別の市場分析:詳細分析
- 米国 (2018年~2029年)
- 欧州 (2018年~2029年)
- 中国 (2018年~2029年)
- 日本 (2018年~2029年)
- 韓国 (2018年~2029年)
- 他のアジア諸国 (2018年~2029年)
第3章 軟磁性材料:企業別の競合情勢
- 軟磁性材料の主要企業の販売:企業別 (2018年~2023年)
- 軟磁性材料の主要企業の収益 (2018年~2023年)
- 市場シェア:企業の種類別 (ティア1、ティア2、ティア3) (収益別、2022年)
- 平均価格:企業別 (2018年~2023年)
- 軟磁性材料の主要メーカーの製造拠点・本社
- 軟磁性材料の主要メーカーの製品種類
- 軟磁性材料の主要メーカーの設立時期
- メーカーの企業合併・買収 (M&A)、拡張計画
第4章 軟磁性材料:種類別の市場規模
- 過去の市場分析:種類別 (2018年~2023年)
- 市場の推計・予測:種類別 (2024年~2029年)
第5章 軟磁性材料:用途別の市場規模
- 過去の市場分析:用途別 (2018年~2023年)
- 市場の推計・予測:用途別 (2024年~2029年)
第6章 米国の軟磁性材料市場:詳細分析
- 販売:企業別
- 販売:種類別の内訳
- 販売:用途別の内訳
第7章 欧州の軟磁性材料市場:詳細分析
第8章 中国の軟磁性材料市場:詳細分析
第9章 日本の軟磁性材料市場:詳細分析
第10章 韓国の軟磁性材料市場:詳細分析
第11章 他のアジア諸国の軟磁性材料市場:詳細分析
第12章 企業プロファイル:軟磁性材料事業の主要指標
- Proterial, Ltd.
- TDK
- DMEGC
- Qingdao Yunlu
- TDG
- POCO Magnetic
- MAGNETICS
- CSC (Changsung Corp.)
- ZheJiang NBTM KeDa (KDM)
- Advanced Technology
- Acme Electronics
- FERROXCUBE (YAGEO)
- Kaiyuan Magnetism
- Samwha Electronics
- Haining Lianfeng
- Nanjing New Conda
- Zhejiang Zhaojing
- Dongbu Electronic Materials
- Micrometals
第13章 軟磁性材料の製造コストの分析
- 軟磁性材料の主要原材料の分析
- 製造コストの構造比率
- 軟磁性材料の製造プロセスの分析
- 軟磁性材料の産業チェーンの分析
第14章 マーケティングチャネル・流通業者・顧客
- マーケティングチャネル
- 軟磁性材料の流通業者の一覧
- 軟磁性材料の顧客
第15章 軟磁性材料の市場力学
- 軟磁性材料業界の動向
- 軟磁性材料市場の促進要因
- 軟磁性材料市場の課題と抑制要因
第16章 調査結果と結論
第17章 付録
List of Tables
- Table 1. Global Soft Magnetic Materials Sales (US$ Million) Growth Rate by Type (2018 & 2022 & 2029)
- Table 2. Global Soft Magnetic Materials Sales (US$ Million) Comparison by Application (2018 & 2022 & 2029)
- Table 3. Global Market Soft Magnetic Materials Market Size (US$ Million) by Region:2018 VS 2022 VS 2029
- Table 4. Global Soft Magnetic Materials Sales (K Tonnes) by Region (2018-2023)
- Table 5. Global Soft Magnetic Materials Sales Market Share by Region (2018-2023)
- Table 6. Global Soft Magnetic Materials Revenue (US$ Million) Market Share by Region (2018-2023)
- Table 7. Global Soft Magnetic Materials Revenue Share by Region (2018-2023)
- Table 8. Global Soft Magnetic Materials Sales (K Tonnes) Forecast by Region (2024-2029)
- Table 9. Global Soft Magnetic Materials Sales Market Share Forecast by Region (2024-2029)
- Table 10. Global Soft Magnetic Materials Revenue (US$ Million) Forecast by Region (2024-2029)
- Table 11. Global Soft Magnetic Materials Revenue Share Forecast by Region (2024-2029)
- Table 12. Global Soft Magnetic Materials Sales by Company (K Tonnes) & (2018-2023)
- Table 13. Global Soft Magnetic Materials Sales Share by Company (2018-2023)
- Table 14. Global Soft Magnetic Materials Revenue by Company (US$ Million) & (2018-2023)
- Table 15. Global Soft Magnetic Materials Revenue Share by Company (2018-2023)
- Table 16. Global Soft Magnetic Materials by Company Type (Tier 1, Tier 2, and Tier 3) & (based on the Revenue in Soft Magnetic Materials as of 2022)
- Table 17. Global Market Soft Magnetic Materials Average Price by Company (US$/Tonne) & (2018-2023)
- Table 18. Global Key Manufacturers of Soft Magnetic Materials, Manufacturing Sites & Headquarters
- Table 19. Global Key Manufacturers of Soft Magnetic Materials, Product Type
- Table 20. Global Key Manufacturers of Soft Magnetic Materials Established Date
- Table 21. Manufacturers Mergers & Acquisitions, Expansion Plans
- Table 22. Global Soft Magnetic Materials Sales by Type (K Tonnes) & (2018-2023)
- Table 23. Global Soft Magnetic Materials Sales Share by Type (2018-2023)
- Table 24. Global Soft Magnetic Materials Revenue by Type (US$ Million) & (2018-2023)
- Table 25. Global Soft Magnetic Materials Price by Type (US$/Tonne) & (2018-2023)
- Table 26. Global Soft Magnetic Materials Sales by Type (K Tonnes) & (2024-2029)
- Table 27. Global Soft Magnetic Materials Revenue by Type (US$ Million) & (2024-2029)
- Table 28. Global Soft Magnetic Materials Price by Type (US$/Tonne) & (2024-2029)
- Table 29. Global Soft Magnetic Materials Sales by Application (K Tonnes) & (2018-2023)
- Table 30. Global Soft Magnetic Materials Sales Share by Application (2018-2023)
- Table 31. Global Soft Magnetic Materials Revenue by Application (US$ Million) & (2018-2023)
- Table 32. Global Soft Magnetic Materials Price by Application (US$/Tonne) & (2018-2023)
- Table 33. Global Soft Magnetic Materials Sales by Application (K Tonnes) & (2024-2029)
- Table 34. Global Soft Magnetic Materials Revenue Market Share by Application (US$ Million) & (2024-2029)
- Table 35. Global Soft Magnetic Materials Price by Application (US$/Tonne) & (2024-2029)
- Table 36. United States Soft Magnetic Materials Revenue by Company (2018-2023) & (US$ Million)
- Table 37. United States Soft Magnetic Materials Revenue Market Share by Company (2018-2023)
- Table 38. United States Soft Magnetic Materials Sales by Type (2018-2023) & (K Tonnes)
- Table 39. United States Soft Magnetic Materials Sales Market Share by Type (2018-2023)
- Table 40. United States Soft Magnetic Materials Sales by Type (2024-2029) & (K Tonnes)
- Table 41. United States Soft Magnetic Materials Sales Market Share by Type (2024-2029)
- Table 42. United States Soft Magnetic Materials Sales by Application (2018-2023) & (K Tonnes)
- Table 43. United States Soft Magnetic Materials Sales Market Share by Application (2018-2023)
- Table 44. United States Soft Magnetic Materials Sales by Application (2024-2029) & (K Tonnes)
- Table 45. United States Soft Magnetic Materials Sales Market Share by Application (2024-2029)
- Table 46. Europe Soft Magnetic Materials Revenue by Company (2018-2023) & (US$ Million)
- Table 47. Europe Soft Magnetic Materials Revenue Market Share by Company (2018-2023)
- Table 48. Europe Soft Magnetic Materials Sales by Type (2018-2023) & (K Tonnes)
- Table 49. Europe Soft Magnetic Materials Sales Market Share by Type (2018-2023)
- Table 50. Europe Soft Magnetic Materials Sales by Type (2024-2029) & (K Tonnes)
- Table 51. Europe Soft Magnetic Materials Sales Market Share by Type (2024-2029)
- Table 52. Europe Soft Magnetic Materials Sales by Application (2018-2023) & (K Tonnes)
- Table 53. Europe Soft Magnetic Materials Sales Market Share by Application (2018-2023)
- Table 54. Europe Soft Magnetic Materials Sales by Application (2024-2029) & (K Tonnes)
- Table 55. Europe Soft Magnetic Materials Sales Market Share by Application (2024-2029)
- Table 56. China Soft Magnetic Materials Revenue by Company (2018-2023) & (US$ Million)
- Table 57. China Soft Magnetic Materials Revenue Market Share by Company (2018-2023)
- Table 58. China Soft Magnetic Materials Sales by Type (2018-2023) & (K Tonnes)
- Table 59. China Soft Magnetic Materials Sales Market Share by Type (2018-2023)
- Table 60. China Soft Magnetic Materials Sales by Type (2024-2029) & (K Tonnes)
- Table 61. China Soft Magnetic Materials Sales Market Share by Type (2024-2029)
- Table 62. China Soft Magnetic Materials Sales by Application (2018-2023) & (K Tonnes)
- Table 63. China Soft Magnetic Materials Sales Market Share by Application (2018-2023)
- Table 64. China Soft Magnetic Materials Sales by Application (2024-2029) & (K Tonnes)
- Table 65. China Soft Magnetic Materials Sales Market Share by Application (2024-2029)
- Table 66. Japan Soft Magnetic Materials Revenue by Company (2018-2023) & (US$ Million)
- Table 67. Japan Soft Magnetic Materials Revenue Market Share by Company (2018-2023)
- Table 68. Japan Soft Magnetic Materials Sales by Type (2018-2023) & (K Tonnes)
- Table 69. Japan Soft Magnetic Materials Sales Market Share by Type (2018-2023)
- Table 70. Japan Soft Magnetic Materials Sales by Type (2024-2029) & (K Tonnes)
- Table 71. Japan Soft Magnetic Materials Sales Market Share by Type (2024-2029)
- Table 72. Japan Soft Magnetic Materials Sales by Application (2018-2023) & (K Tonnes)
- Table 73. Japan Soft Magnetic Materials Sales Market Share by Application (2018-2023)
- Table 74. Japan Soft Magnetic Materials Sales by Application (2024-2029) & (K Tonnes)
- Table 75. Japan Soft Magnetic Materials Sales Market Share by Application (2024-2029)
- Table 76. South Korea Soft Magnetic Materials Revenue by Company (2018-2023) & (US$ Million)
- Table 77. South Korea Soft Magnetic Materials Revenue Market Share by Company (2018-2023)
- Table 78. South Korea Soft Magnetic Materials Sales by Type (2018-2023) & (K Tonnes)
- Table 79. South Korea Soft Magnetic Materials Sales Market Share by Type (2018-2023)
- Table 80. South Korea Soft Magnetic Materials Sales by Type (2024-2029) & (K Tonnes)
- Table 81. South Korea Soft Magnetic Materials Sales Market Share by Type (2024-2029)
- Table 82. South Korea Soft Magnetic Materials Sales by Application (2018-2023) & (K Tonnes)
- Table 83. South Korea Soft Magnetic Materials Sales Market Share by Application (2018-2023)
- Table 84. South Korea Soft Magnetic Materials Sales by Application (2024-2029) & (K Tonnes)
- Table 85. South Korea Soft Magnetic Materials Sales Market Share by Application (2024-2029)
- Table 86. Asia Other Soft Magnetic Materials Revenue by Company (2018-2023) & (US$ Million)
- Table 87. Asia Other Soft Magnetic Materials Revenue Market Share by Company (2018-2023)
- Table 88. Asia Other Soft Magnetic Materials Sales by Type (2018-2023) & (K Tonnes)
- Table 89. Asia Other Soft Magnetic Materials Sales Market Share by Type (2018-2023)
- Table 90. Asia Other Soft Magnetic Materials Sales by Type (2024-2029) & (K Tonnes)
- Table 91. Asia Other Soft Magnetic Materials Sales Market Share by Type (2024-2029)
- Table 92. Asia Other Soft Magnetic Materials Sales by Application (2018-2023) & (K Tonnes)
- Table 93. Asia Other Soft Magnetic Materials Sales Market Share by Application (2018-2023)
- Table 94. Asia Other Soft Magnetic Materials Sales by Application (2024-2029) & (K Tonnes)
- Table 95. Asia Other Soft Magnetic Materials Sales Market Share by Application (2024-2029)
- Table 96. Proterial, Ltd. Company Information
- Table 97. Proterial, Ltd. Description and Business Overview
- Table 98. Proterial, Ltd. Soft Magnetic Materials Sales (K Tonnes), Revenue (US$ Million), Price (US$/Tonne) and Gross Margin (2018-2023)
- Table 99. Proterial, Ltd. Soft Magnetic Materials Product
- Table 100. TDK Company Information
- Table 101. TDK Description and Business Overview
- Table 102. TDK Soft Magnetic Materials Sales (K Tonnes), Revenue (US$ Million), Price (US$/Tonne) and Gross Margin (2018-2023)
- Table 103. TDK Soft Magnetic Materials Product
- Table 104. DMEGC Company Information
- Table 105. DMEGC Description and Business Overview
- Table 106. DMEGC Soft Magnetic Materials Sales (K Tonnes), Revenue (US$ Million), Price (US$/Tonne) and Gross Margin (2018-2023)
- Table 107. DMEGC Soft Magnetic Materials Product
- Table 108. Qingdao Yunlu Company Information
- Table 109. Qingdao Yunlu Description and Business Overview
- Table 110. Qingdao Yunlu Soft Magnetic Materials Sales (K Tonnes), Revenue (US$ Million), Price (US$/Tonne) and Gross Margin (2018-2023)
- Table 111. Qingdao Yunlu Soft Magnetic Materials Product
- Table 112. TDG Company Information
- Table 113. TDG Description and Business Overview
- Table 114. TDG Soft Magnetic Materials Sales (K Tonnes), Revenue (US$ Million), Price (US$/Tonne) and Gross Margin (2018-2023)
- Table 115. TDG Soft Magnetic Materials Product
- Table 116. POCO Magnetic Company Information
- Table 117. POCO Magnetic Description and Business Overview
- Table 118. POCO Magnetic Soft Magnetic Materials Sales (K Tonnes), Revenue (US$ Million), Price (US$/Tonne) and Gross Margin (2018-2023)
- Table 119. POCO Magnetic Soft Magnetic Materials Product
- Table 120. MAGNETICS Company Information
- Table 121. MAGNETICS Description and Business Overview
- Table 122. MAGNETICS Soft Magnetic Materials Sales (K Tonnes), Revenue (US$ Million), Price (US$/Tonne) and Gross Margin (2018-2023)
- Table 123. MAGNETICS Soft Magnetic Materials Product
- Table 124. CSC (Changsung Corp.) Company Information
- Table 125. CSC (Changsung Corp.) Description and Business Overview
- Table 126. CSC (Changsung Corp.) Soft Magnetic Materials Sales (K Tonnes), Revenue (US$ Million), Price (US$/Tonne) and Gross Margin (2018-2023)
- Table 127. CSC (Changsung Corp.) Soft Magnetic Materials Product
- Table 128. ZheJiang NBTM KeDa (KDM) Company Information
- Table 129. ZheJiang NBTM KeDa (KDM) Description and Business Overview
- Table 130. ZheJiang NBTM KeDa (KDM) Soft Magnetic Materials Sales (K Tonnes), Revenue (US$ Million), Price (US$/Tonne) and Gross Margin (2018-2023)
- Table 131. ZheJiang NBTM KeDa (KDM) Soft Magnetic Materials Product
- Table 132. Advanced Technology Company Information
- Table 133. Advanced Technology Description and Business Overview
- Table 134. Advanced Technology Soft Magnetic Materials Sales (K Tonnes), Revenue (US$ Million), Price (US$/Tonne) and Gross Margin (2018-2023)
- Table 135. Advanced Technology Soft Magnetic Materials Product
- Table 136. Acme Electronics Company Information
- Table 137. Acme Electronics Description and Business Overview
- Table 138. Acme Electronics Soft Magnetic Materials Sales (K Tonnes), Revenue (US$ Million), Price (US$/Tonne) and Gross Margin (2018-2023)
- Table 139. Acme Electronics Soft Magnetic Materials Product
- Table 140. FERROXCUBE Company Information
- Table 141. FERROXCUBE Description and Business Overview
- Table 142. FERROXCUBE Soft Magnetic Materials Sales (K Tonnes), Revenue (US$ Million), Price (US$/Tonne) and Gross Margin (2018-2023)
- Table 143. FERROXCUBE Soft Magnetic Materials Product
- Table 144. Kaiyuan Magnetism Company Information
- Table 145. Kaiyuan Magnetism Description and Business Overview
- Table 146. Kaiyuan Magnetism Soft Magnetic Materials Sales (K Tonnes), Revenue (US$ Million), Price (US$/Tonne) and Gross Margin (2018-2023)
- Table 147. Kaiyuan Magnetism Soft Magnetic Materials Product
- Table 148. Samwha Electronics Company Information
- Table 149. Samwha Electronics Description and Business Overview
- Table 150. Samwha Electronics Soft Magnetic Materials Sales (K Tonnes), Revenue (US$ Million), Price (US$/Tonne) and Gross Margin (2018-2023)
- Table 151. Samwha Electronics Soft Magnetic Materials Product
- Table 152. Haining Lianfeng Company Information
- Table 153. Haining Lianfeng Description and Business Overview
- Table 154. Haining Lianfeng Soft Magnetic Materials Sales (K Tonnes), Revenue (US$ Million), Price (US$/Tonne) and Gross Margin (2018-2023)
- Table 155. Haining Lianfeng Soft Magnetic Materials Product
- Table 156. Nanjing New Conda Company Information
- Table 157. Nanjing New Conda Description and Business Overview
- Table 158. Nanjing New Conda Soft Magnetic Materials Sales (K Tonnes), Revenue (US$ Million), Price (US$/Tonne) and Gross Margin (2018-2023)
- Table 159. Nanjing New Conda Soft Magnetic Materials Product
- Table 160. Zhejiang Zhaojing Company Information
- Table 161. Zhejiang Zhaojing Description and Business Overview
- Table 162. Zhejiang Zhaojing Soft Magnetic Materials Sales (K Tonnes), Revenue (US$ Million), Price (US$/Tonne) and Gross Margin (2018-2023)
- Table 163. Zhejiang Zhaojing Soft Magnetic Materials Product
- Table 164. Dongbu Electronic Materials Company Information
- Table 165. Dongbu Electronic Materials Description and Business Overview
- Table 166. Dongbu Electronic Materials Soft Magnetic Materials Sales (K Tonnes), Revenue (US$ Million), Price (US$/Tonne) and Gross Margin (2018-2023)
- Table 167. Dongbu Electronic Materials Soft Magnetic Materials Product
- Table 168. Micrometals Company Information
- Table 169. Micrometals Description and Business Overview
- Table 170. Micrometals Soft Magnetic Materials Sales (K Tonnes), Revenue (US$ Million), Price (US$/Tonne) and Gross Margin (2018-2023)
- Table 171. Micrometals Soft Magnetic Materials Product
- Table 172. Production Base and Market Concentration Rate of Raw Material
- Table 173. Key Suppliers of Raw Materials
- Table 174. Soft Magnetic Materials Distributors List
- Table 175. Soft Magnetic Materials Customers List
- Table 176. Soft Magnetic Materials Market Trends
- Table 177. Soft Magnetic Materials Market Drivers
- Table 178. Soft Magnetic Materials Market Challenges and Restraints
- Table 179. Research Programs/Design for This Report
- Table 180. Key Data Information from Secondary Sources
- Table 181. Key Data Information from Primary Sources
- Table 182. QYR Business Unit and Senior & Team Lead Analysts
List of Figures
- Figure 1. Soft Magnetic Materials Product Picture
- Figure 2. Global Soft Magnetic Materials Sales (US$ Million) by Type (2018 & 2022 & 2029)
- Figure 3. Global Soft Magnetic Materials Sales Market Share by Type in 2022
- Figure 4. Soft Ferrite Materials Product Picture
- Figure 5. Metal Magnetic Powder Materials Product Picture
- Figure 6. Amorphous Magnetic Materials Product Picture
- Figure 7. Nanocrystalline Soft Magnetic Materials Product Picture
- Figure 8. Global Soft Magnetic Materials Sales (US$ Million) by Application (2018 & 2022 & 2029)
- Figure 9. Global Soft Magnetic Materials Sales Market Share by Application in 2022
- Figure 10. Communication Examples
- Figure 11. Home Appliances and Consumer Electronics Examples
- Figure 12. Automotive and Transportation Examples
- Figure 13. Photovoltaics and Wind Power Examples
- Figure 14. Lighting Industry Examples
- Figure 15. Computers and Office Equipment Examples
- Figure 16. Aerospace and Medical Examples
- Figure 17. Global Soft Magnetic Materials Sales, (US$ Million), 2018 VS 2022 VS 2029
- Figure 18. Global Soft Magnetic Materials Sales Growth Rate (2018-2029) & (US$ Million)
- Figure 19. Global Soft Magnetic Materials Sales (K Tonnes) Growth Rate (2018-2029)
- Figure 20. Global Soft Magnetic Materials Price Trends Growth Rate (2018-2029) & (US$/Tonne)
- Figure 21. Soft Magnetic Materials Report Years Considered
- Figure 22. Global Market Soft Magnetic Materials Market Size (US$ Million) by Region:2018 VS 2022 VS 2029
- Figure 23. Global Soft Magnetic Materials Revenue Market Share by Region: 2018-2023
- Figure 24. United States Soft Magnetic Materials Revenue (US$ Million) Growth Rate (2018-2029)
- Figure 25. United States Soft Magnetic Materials Sales (K Tonnes) Growth Rate (2018-2029)
- Figure 26. Europe Soft Magnetic Materials Revenue (US$ Million) Growth Rate (2018-2029)
- Figure 27. Europe Soft Magnetic Materials Sales (K Tonnes) Growth Rate (2018-2029)
- Figure 28. China Soft Magnetic Materials Revenue (US$ Million) Growth Rate (2018-2029)
- Figure 29. China Soft Magnetic Materials Sales (K Tonnes) Growth Rate (2018-2029)
- Figure 30. Japan Soft Magnetic Materials Revenue (US$ Million) Growth Rate (2018-2029)
- Figure 31. Japan Soft Magnetic Materials Sales (K Tonnes) Growth Rate (2018-2029)
- Figure 32. South Korea Soft Magnetic Materials Revenue (US$ Million) Growth Rate (2018-2029)
- Figure 33. South Korea Soft Magnetic Materials Sales (K Tonnes) Growth Rate (2018-2029)
- Figure 34. Asia Other Soft Magnetic Materials Revenue (US$ Million) Growth Rate (2018-2029)
- Figure 35. Asia Other Soft Magnetic Materials Sales (K Tonnes) Growth Rate (2018-2029)
- Figure 36. Global 5 Largest Soft Magnetic Materials Players Market Share by Revenue in Soft Magnetic Materials: 2022
- Figure 37. Global Soft Magnetic Materials Revenue Share by Type (2018-2023)
- Figure 38. Global Soft Magnetic Materials Sales Share by Type (2024-2029)
- Figure 39. Global Soft Magnetic Materials Revenue Share by Type (2024-2029)
- Figure 40. Global Soft Magnetic Materials Revenue Share by Application (2018-2023)
- Figure 41. Global Soft Magnetic Materials Sales Share by Application (2024-2029)
- Figure 42. Global Soft Magnetic Materials Revenue Share by Application (2024-2029)
- Figure 43. Manufacturing Cost Structure of Soft Magnetic Materials
- Figure 44. Manufacturing Process Analysis of Soft Ferrite Core Material
- Figure 45. Manufacturing Process Analysis of Metal Magnetic Powder Core
- Figure 46. Manufacturing Process of Amorphous
- Figure 47. Production of Amorphous Metal Ribbons
- Figure 48. Soft Magnetic Materials Industrial Chain
- Figure 49. Channels of Distribution
- Figure 50. Distributors Profiles
- Figure 51. Bottom-up and Top-down Approaches for This Report
- Figure 52. Data Triangulation
- Figure 53. Key Executives Interviewed
The global Soft Magnetic Materials market size was US$ 3.8 billion in 2022 and is forecast to a readjusted size of US$ 5.4 billion by 2029 with a CAGR of 5.13% during the forecast period 2023-2029. Fully considering the economic change by this health crisis, Soft Ferrite Materials accounting for 67.70% of the Soft Magnetic Materials global market in 2022, is projected to value US$ 3.6 billion by 2029, growing at a revised 4.77% CAGR from 2023 to 2029. While Automotive and Transportation segment is altered to an 6.71% CAGR throughout this forecast period.
The United States Soft Magnetic Materials market size was US$ 529.45 million in 2022, while China was US$ 1,191.31 million. The proportion of the United States was 13.93% in 2022, while Chinese percentage was 31.35%, and it is predicted that China share will reach 33.85% in 2029, trailing a CAGR of 6.24% through the analysis period.
The global key manufacturers of Soft Magnetic Materials include Proterial, Ltd., TDK, DMEGC, Qingdao Yunlu, TDG, POCO Magnetic, MAGNETICS, CSC (Changsung Corp.), and ZheJiang NBTM KeDa (KDM), etc. In 2022, the global top five players occupied for a share approximately 23.73% in terms of revenue.
Scope and Market Size:
The global Soft Magnetic Materials market is segmented by company, region (country), by Type, and by Application. Players, stakeholders, and other participants in the global Soft Magnetic Materials market will be able to gain the upper hand as they use the report as a powerful resource. The segmental analysis focuses on sales, revenue and forecast by region (country), by Type and by Application for the period 2018-2029.
By Company
- Proterial, Ltd.
- TDK
- DMEGC
- Qingdao Yunlu
- TDG
- POCO Magnetic
- MAGNETICS
- CSC (Changsung Corp.)
- ZheJiang NBTM KeDa (KDM)
- Advanced Technology
- Acme Electronics
- FERROXCUBE
- Kaiyuan Magnetism
- Samwha Electronics
- Haining Lianfeng
- Nanjing New Conda
- Zhejiang Zhaojing
- Dongbu Electronic Materials
- Micrometals
Segment by Type
- Soft Ferrite Materials
- Metal Magnetic Powder Materials
- Amorphous Magnetic Materials
- Nanocrystalline Soft Magnetic Materials
- Others
Segment by Application
- Communication
- Home Appliances and Consumer Electronics
- Automotive and Transportation
- Photovoltaics and Wind Power
- Lighting Industry
- Computers and Office Equipment
- Others
By Region
- United States
- Europe
- China
- Japan
- Southeast Asia
- India
- Other Regions
Table of Contents
1 Soft Magnetic Materials Market Overview
- 1.1 Soft Magnetic Materials Product Scope
- 1.2 Soft Magnetic Materials by Type
- 1.2.1 Global Soft Magnetic Materials Sales by Type (2018 & 2022 & 2029)
- 1.2.2 Soft Ferrite Materials
- 1.2.3 Metal Magnetic Powder Materials
- 1.2.4 Amorphous Magnetic Materials
- 1.2.5 Nanocrystalline Soft Magnetic Materials
- 1.3 Soft Magnetic Materials by Application
- 1.3.1 Global Soft Magnetic Materials Sales Comparison by Application (2018 & 2022 & 2029)
- 1.3.2 Communication
- 1.3.3 Home Appliances and Consumer Electronics
- 1.3.4 Automotive and Transportation
- 1.3.5 Photovoltaics and Wind Power
- 1.3.6 Lighting Industry
- 1.3.7 Computers and Office Equipment
- 1.3.8 Others
- 1.4 Global Soft Magnetic Materials Market Estimates and Forecasts (2018-2029)
- 1.4.1 Global Soft Magnetic Materials Market Size in Value Growth Rate (2018-2029)
- 1.4.2 Global Soft Magnetic Materials Market Size in Volume Growth Rate (2018-2029)
- 1.4.3 Global Soft Magnetic Materials Price Trends (2018-2029)
- 1.5 Assumptions and Limitations
2 Soft Magnetic Materials Estimates and Forecasts by Region
- 2.1 Global Soft Magnetic Materials Market Size by Region: 2018 VS 2022 VS 2029
- 2.2 Global Soft Magnetic Materials Retrospective Market Scenario by Region (2018-2023)
- 2.2.1 Global Soft Magnetic Materials Sales Market Share by Region (2018-2023)
- 2.2.2 Global Soft Magnetic Materials Revenue Market Share by Region (2018-2023)
- 2.3 Global Soft Magnetic Materials Market Estimates and Forecasts by Region (2024-2029)
- 2.3.1 Global Soft Magnetic Materials Sales Estimates and Forecasts by Region (2024-2029)
- 2.3.2 Global Soft Magnetic Materials Revenue Forecast by Region (2024-2029)
- 2.4 Geographic Market Analysis: Market Facts & Figures
- 2.4.1 United States Soft Magnetic Materials Estimates and Projections (2018-2029)
- 2.4.2 Europe Soft Magnetic Materials Estimates and Projections (2018-2029)
- 2.4.3 China Soft Magnetic Materials Estimates and Projections (2018-2029)
- 2.4.4 Japan Soft Magnetic Materials Estimates and Projections (2018-2029)
- 2.4.5 South Korea Soft Magnetic Materials Estimates and Projections (2018-2029)
- 2.4.6 Asia Other Soft Magnetic Materials Estimates and Projections (2018-2029)
3 Soft Magnetic Materials Competition Landscape by Players
- 3.1 Global Soft Magnetic Materials Sales by Players (2018-2023)
- 3.2 Global Top Soft Magnetic Materials Players by Revenue (2018-2023)
- 3.3 Global Soft Magnetic Materials Market Share by Company Type (Tier 1, Tier 2, and Tier 3) & (based on the Revenue in Soft Magnetic Materials as of 2022)
- 3.4 Global Soft Magnetic Materials Average Price by Company (2018-2023)
- 3.5 Global Key Manufacturers of Soft Magnetic Materials, Manufacturing Sites & Headquarters
- 3.6 Global Key Manufacturers of Soft Magnetic Materials, Product Type
- 3.7 Global Key Manufacturers of Soft Magnetic Materials Established Date
- 3.8 Manufacturers Mergers & Acquisitions, Expansion Plans
4 Soft Magnetic Materials Market Size by Type
- 4.1 Global Soft Magnetic Materials Historic Market Review by Type (2018-2023)
- 4.1.1 Global Soft Magnetic Materials Sales by Type (2018-2023)
- 4.1.2 Global Soft Magnetic Materials Revenue by Type (2018-2023)
- 4.1.3 Global Soft Magnetic Materials Price by Type (2018-2023)
- 4.2 Global Soft Magnetic Materials Market Estimates and Forecasts by Type (2024-2029)
- 4.2.1 Global Soft Magnetic Materials Sales Forecast by Type (2024-2029)
- 4.2.2 Global Soft Magnetic Materials Revenue Forecast by Type (2024-2029)
- 4.2.3 Global Soft Magnetic Materials Price Forecast by Type (2024-2029)
5 Global Soft Magnetic Materials Market Size by Application
- 5.1 Global Soft Magnetic Materials Historic Market Review by Application (2018-2023)
- 5.1.1 Global Soft Magnetic Materials Sales by Application (2018-2023)
- 5.1.2 Global Soft Magnetic Materials Revenue by Application (2018-2023)
- 5.1.3 Global Soft Magnetic Materials Price by Application (2018-2023)
- 5.2 Global Soft Magnetic Materials Market Estimates and Forecasts by Application (2024-2029)
- 5.2.1 Global Soft Magnetic Materials Sales Forecast by Application (2024-2029)
- 5.2.2 Global Soft Magnetic Materials Revenue Forecast by Application (2024-2029)
- 5.2.3 Global Soft Magnetic Materials Price Forecast by Application (2024-2029)
6 United States Soft Magnetic Materials Market Facts & Figures
- 6.1 United States Soft Magnetic Materials Sales by Company
- 6.2 United States Soft Magnetic Materials Sales Breakdown by Type
- 6.2.1 United States Soft Magnetic Materials Sales Breakdown by Type (2018-2023)
- 6.2.2 United States Soft Magnetic Materials Sales Breakdown by Type (2024-2029)
- 6.3 United States Soft Magnetic Materials Sales Breakdown by Application
- 6.3.1 United States Soft Magnetic Materials Sales Breakdown by Application (2018-2023)
- 6.3.2 United States Soft Magnetic Materials Sales Breakdown by Application (2024-2029)
7 Europe Soft Magnetic Materials Market Facts & Figures
- 7.1 Europe Soft Magnetic Materials Sales by Company
- 7.2 Europe Soft Magnetic Materials Sales Breakdown by Type
- 7.2.1 Europe Soft Magnetic Materials Sales Breakdown by Type (2018-2023)
- 7.2.2 Europe Soft Magnetic Materials Sales Breakdown by Type (2024-2029)
- 7.3 Europe Soft Magnetic Materials Sales Breakdown by Application
- 7.3.1 Europe Soft Magnetic Materials Sales Breakdown by Application (2018-2023)
- 7.3.2 Europe Soft Magnetic Materials Sales Breakdown by Application (2024-2029)
8 China Soft Magnetic Materials Market Facts & Figures
- 8.1 China Soft Magnetic Materials Sales by Company
- 8.2 China Soft Magnetic Materials Sales Breakdown by Type
- 8.2.1 China Soft Magnetic Materials Sales Breakdown by Type (2018-2023)
- 8.2.2 China Soft Magnetic Materials Sales Breakdown by Type (2024-2029)
- 8.3 China Soft Magnetic Materials Sales Breakdown by Application
- 8.3.1 China Soft Magnetic Materials Sales Breakdown by Application (2018-2023)
- 8.3.2 China Soft Magnetic Materials Sales Breakdown by Application (2024-2029)
9 Japan Soft Magnetic Materials Market Facts & Figures
- 9.1 Japan Soft Magnetic Materials Sales by Company
- 9.2 Japan Soft Magnetic Materials Sales Breakdown by Type
- 9.2.1 Japan Soft Magnetic Materials Sales Breakdown by Type (2018-2023)
- 9.2.2 Japan Soft Magnetic Materials Sales Breakdown by Type (2024-2029)
- 9.3 Japan Soft Magnetic Materials Sales Breakdown by Application
- 9.3.1 Japan Soft Magnetic Materials Sales Breakdown by Application (2018-2023)
- 9.3.2 Japan Soft Magnetic Materials Sales Breakdown by Application (2024-2029)
10 South Korea Soft Magnetic Materials Market Facts & Figures
- 10.1 South Korea Soft Magnetic Materials Sales by Company
- 10.2 South Korea Soft Magnetic Materials Sales Breakdown by Type
- 10.2.1 South Korea Soft Magnetic Materials Sales Breakdown by Type (2018-2023)
- 10.2.2 South Korea Soft Magnetic Materials Sales Breakdown by Type (2024-2029)
- 10.3 South Korea Soft Magnetic Materials Sales Breakdown by Application
- 10.3.1 South Korea Soft Magnetic Materials Sales Breakdown by Application (2018-2023)
- 10.3.2 South Korea Soft Magnetic Materials Sales Breakdown by Application (2024-2029)
11 Asia Other Soft Magnetic Materials Market Facts & Figures
- 11.1 Asia Other Soft Magnetic Materials Sales by Company
- 11.2 Asia Other Soft Magnetic Materials Sales Breakdown by Type
- 11.2.1 Asia Other Soft Magnetic Materials Sales Breakdown by Type (2018-2023)
- 11.2.2 Asia Other Soft Magnetic Materials Sales Breakdown by Type (2024-2029)
- 11.3 Asia Other Soft Magnetic Materials Sales Breakdown by Application
- 11.3.1 Asia Other Soft Magnetic Materials Sales Breakdown by Application (2018-2023)
- 11.3.2 Asia Other Soft Magnetic Materials Sales Breakdown by Application (2024-2029)
12 Company Profiles and Key Figures
- 12.1 Proterial, Ltd.
- 12.1.1 Proterial, Ltd. Company Information
- 12.1.2 Proterial, Ltd. Business Overview
- 12.1.3 Proterial, Ltd. Soft Magnetic Materials Sales, Revenue and Gross Margin (2018-2023)
- 12.1.4 Proterial, Ltd. Soft Magnetic Materials Products Offered
- 12.2 TDK
- 12.2.1 TDK Company Information
- 12.2.2 TDK Business Overview
- 12.2.3 TDK Soft Magnetic Materials Sales, Revenue and Gross Margin (2018-2023)
- 12.2.4 TDK Soft Magnetic Materials Products Offered
- 12.3 DMEGC
- 12.3.1 DMEGC Company Information
- 12.3.2 DMEGC Business Overview
- 12.3.3 DMEGC Soft Magnetic Materials Sales, Revenue and Gross Margin (2018-2023)
- 12.3.4 DMEGC Soft Magnetic Materials Products Offered
- 12.4 Qingdao Yunlu
- 12.4.1 Qingdao Yunlu Company Information
- 12.4.2 Qingdao Yunlu Business Overview
- 12.4.3 Qingdao Yunlu Soft Magnetic Materials Sales, Revenue and Gross Margin (2018-2023)
- 12.4.4 Qingdao Yunlu Soft Magnetic Materials Products Offered
- 12.5 TDG
- 12.5.1 TDG Company Information
- 12.5.2 TDG Business Overview
- 12.5.3 TDG Soft Magnetic Materials Sales, Revenue and Gross Margin (2018-2023)
- 12.5.4 TDG Soft Magnetic Materials Products Offered
- 12.6 POCO Magnetic
- 12.6.1 POCO Magnetic Company Information
- 12.6.2 POCO Magnetic Business Overview
- 12.6.3 POCO Magnetic Soft Magnetic Materials Sales, Revenue and Gross Margin (2018-2023)
- 12.6.4 POCO Magnetic Soft Magnetic Materials Products Offered
- 12.7 MAGNETICS
- 12.7.1 MAGNETICS Company Information
- 12.7.2 MAGNETICS Business Overview
- 12.7.3 MAGNETICS Soft Magnetic Materials Sales, Revenue and Gross Margin (2018-2023)
- 12.7.4 MAGNETICS Soft Magnetic Materials Products Offered
- 12.8 CSC (Changsung Corp.)
- 12.8.1 CSC (Changsung Corp.) Company Information
- 12.8.2 CSC (Changsung Corp.) Business Overview
- 12.8.3 CSC (Changsung Corp.) Soft Magnetic Materials Sales, Revenue and Gross Margin (2018-2023)
- 12.8.4 CSC (Changsung Corp.) Soft Magnetic Materials Products Offered
- 12.9 ZheJiang NBTM KeDa (KDM)
- 12.9.1 ZheJiang NBTM KeDa (KDM) Company Information
- 12.9.2 ZheJiang NBTM KeDa (KDM) Business Overview
- 12.9.3 ZheJiang NBTM KeDa (KDM) Soft Magnetic Materials Sales, Revenue and Gross Margin (2018-2023)
- 12.9.4 ZheJiang NBTM KeDa (KDM) Soft Magnetic Materials Products Offered
- 12.10 Advanced Technology
- 12.10.1 Advanced Technology Company Information
- 12.10.2 Advanced Technology Business Overview
- 12.10.3 Advanced Technology Soft Magnetic Materials Sales, Revenue and Gross Margin (2018-2023)
- 12.10.4 Advanced Technology Soft Magnetic Materials Products Offered
- 12.11 Acme Electronics
- 12.11.1 Acme Electronics Company Information
- 12.11.2 Acme Electronics Business Overview
- 12.11.3 Acme Electronics Soft Magnetic Materials Sales, Revenue and Gross Margin (2018-2023)
- 12.11.4 Acme Electronics Soft Magnetic Materials Products Offered
- 12.12 FERROXCUBE (YAGEO)
- 12.12.1 FERROXCUBE Company Information
- 12.12.2 FERROXCUBE Business Overview
- 12.12.3 FERROXCUBE Soft Magnetic Materials Sales, Revenue and Gross Margin (2018-2023)
- 12.12.4 FERROXCUBE Soft Magnetic Materials Products Offered
- 12.13 Kaiyuan Magnetism
- 12.13.1 Kaiyuan Magnetism Company Information
- 12.13.2 Kaiyuan Magnetism Business Overview
- 12.13.3 Kaiyuan Magnetism Soft Magnetic Materials Sales, Revenue and Gross Margin (2018-2023)
- 12.13.4 Kaiyuan Magnetism Soft Magnetic Materials Products Offered
- 12.14 Samwha Electronics
- 12.14.1 Samwha Electronics Company Information
- 12.14.2 Samwha Electronics Business Overview
- 12.14.3 Samwha Electronics Soft Magnetic Materials Sales, Revenue and Gross Margin (2018-2023)
- 12.14.4 Samwha Electronics Soft Magnetic Materials Products Offered
- 12.15 Haining Lianfeng
- 12.15.1 Haining Lianfeng Company Information
- 12.15.2 Haining Lianfeng Business Overview
- 12.15.3 Haining Lianfeng Soft Magnetic Materials Sales, Revenue and Gross Margin (2018-2023)
- 12.15.4 Haining Lianfeng Soft Magnetic Materials Products Offered
- 12.16 Nanjing New Conda
- 12.16.1 Nanjing New Conda Company Information
- 12.16.2 Nanjing New Conda Business Overview
- 12.16.3 Nanjing New Conda Soft Magnetic Materials Sales, Revenue and Gross Margin (2018-2023)
- 12.16.4 Nanjing New Conda Soft Magnetic Materials Products Offered
- 12.17 Zhejiang Zhaojing
- 12.17.1 Zhejiang Zhaojing Company Information
- 12.17.2 Zhejiang Zhaojing Business Overview
- 12.17.3 Zhejiang Zhaojing Soft Magnetic Materials Sales, Revenue and Gross Margin (2018-2023)
- 12.17.4 Zhejiang Zhaojing Soft Magnetic Materials Products Offered
- 12.18 Dongbu Electronic Materials
- 12.18.1 Dongbu Electronic Materials Company Information
- 12.18.2 Dongbu Electronic Materials Business Overview
- 12.18.3 Dongbu Electronic Materials Soft Magnetic Materials Sales, Revenue and Gross Margin (2018-2023)
- 12.18.4 Dongbu Electronic Materials Soft Magnetic Materials Products Offered
- 12.19 Micrometals
- 12.19.1 Micrometals Company Information
- 12.19.2 Micrometals Business Overview
- 12.19.3 Micrometals Soft Magnetic Materials Sales, Revenue and Gross Margin (2018-2023)
- 12.19.4 Micrometals Soft Magnetic Materials Products Offered
13 Soft Magnetic Materials Manufacturing Cost Analysis
- 13.1 Soft Magnetic Materials Key Raw Materials Analysis
- 13.1.1 Key Raw Materials
- 13.1.2 Key Suppliers of Raw Materials
- 13.2 Proportion of Manufacturing Cost Structure
- 13.3 Manufacturing Process Analysis of Soft Magnetic Materials
- 13.4 Soft Magnetic Materials Industrial Chain Analysis
14 Marketing Channel, Distributors and Customers
- 14.1 Marketing Channel
- 14.2 Soft Magnetic Materials Distributors List
- 14.3 Soft Magnetic Materials Customers
15 Soft Magnetic Materials Market Dynamics
- 15.1 Soft Magnetic Materials Industry Trends
- 15.2 Soft Magnetic Materials Market Drivers
- 15.3 Soft Magnetic Materials Market Challenges and Restraints
16 Research Findings and Conclusion
17 Appendix
- 17.1 Research Methodology
- 17.1.1 Methodology/Research Approach
- 17.1.2 Data Source
- 17.2 Author Details
- 17.3 Disclaimer