|
|
市場調査レポート
商品コード
1075992
軟磁性材料の世界市場:2022年~2027年Soft Magnetic Materials Market - Forecast(2022 - 2027) |
||||||
|
● お客様のご希望に応じて、既存データの加工や未掲載情報(例:国別セグメント)の追加などの対応が可能です。 詳細はお問い合わせください。 |
|||||||
| 軟磁性材料の世界市場:2022年~2027年 |
|
出版日: 2022年04月22日
発行: IndustryARC
ページ情報: 英文 117 Pages
納期: 2~3営業日
|
- 全表示
- 概要
- 目次
軟磁性材料の市場規模は予測期間中9.2%のCAGRで推移し、2027年には791億7,000万米ドルの規模に成長すると予測されています。
タイプ別で見ると、純鉄の部門が2019年に最大のシェアを示しています。また、用途別では、モーターの部門が2019年に最大のシェアを示しています。
当レポートでは、世界の軟磁性材料の市場を調査し、市場の定義と概要、市場成長への各種影響因子の分析、市場規模の推移・予測、各種区分・地域/主要国別の内訳、競合環境、主要企業のプロファイルなどをまとめています。
目次
第1章 軟磁性材料市場:市場概要
第2章 軟磁性材料市場:エグゼクティブサマリー
第3章 軟磁性材料市場:情勢
- 比較分析
- 主要企業の市場シェア分析
- 主要企業の製品ベンチマーキング
- 主要5社の財務分析
- 主要企業の特許分析
- 価格分析
第4章 軟磁性材料市場:市場影響因子
- 市場促進要因
- 市場抑制要因
- 市場機会
- ポーターのファイブフォースモデル
第5章 軟磁性材料市場:戦略的分析
- バリューチェーン分析
- 市場機会の分析
- 製品ライフサイクル
- サプライヤー・流通販売業者の分析
第6章 軟磁性材料市場:タイプ別
- 鉄シリコン合金
- ニッケル鉄合金
- 純鉄
- ソフトフェライト
- アモルファスナノ結晶合金
- その他
第7章 軟磁性材料市場:用途別
- 電気回路
- モーター
- トランスフォーマー
- オルタネーター
- その他
第8章 軟磁性材料市場:エンドユーズ別
- 電気・電子
- 通信
- 自動車
- エネルギー・電力
- その他
第9章 軟磁性材料市場:地域別
- 北米
- 南米
- 欧州
- アジア太平洋
- その他の地域
第10章 軟磁性材料市場:エントロピー
- 新製品の発売
- M&A・協力・JV・提携
第11章 軟磁性材料市場:企業分析
- 市場シェア・企業収益・製品・M&A・展開
Soft Magnetic Materials Market size is forecast to reach $79.17 billion by 2027, after growing at a CAGR of 9.2% during 2022-2027. The use of soft magnetic materials is becoming critical in the various end-user industries and applications as it provides high permeability and helps minimize eddy current losses. Soft magnetic material is popularly used in the motor application as it enhances the field produced by motor winding.
Report Coverage
The report: "Soft Magnetic Materials Market- Forecast (2022-2027)", by IndustryARC, covers an in-depth analysis of the following segments of the Soft Magnetic Materials industry.
By Type: Iron Silicon Alloys, Nickel Iron Alloys, Pure Iron, Soft Ferrites, Amorphous Nano Crystalline Alloys, Others.
By Application: Electric Circuits, Motors, Transformers, Alternators, and Others.
By End Use: Electrical and Electronics, Telecommunication, Automotive, Energy and Power, and Others.
By Geography: North America, South America, Europe, APAC, and RoW.
Key Takeaways
Asia Pacific dominates the Soft Magnetic Materials market owing to presence of iron ore mines in countries such as China and India.
Robust industrialization across Asia-Pacific countries, coupled with geographical advantages such as the presence of iron mines in India and China, is the driving force behind the soft magnetic materials market in this region.
The market drivers and restraints have been assessed to understand their impact over the forecast period. The report further identifies the key opportunities for growth while also detailing the key challenges and possible threats.
The other key areas of focus include the various applications in Soft Magnetic Materials market and their specific segmented revenue.
Soft Magnetic Materials Market Segment Analysis - By Type
Pure Iron held the largest share in the Soft Magnetic Materials market in 2019. The world's leading industries in the manufacture of iron powder specify the use of water atomized high-purity iron powders for high-quality soft magnetic applications. Production costs are significantly high for the manufacture of pure iron; sintered iron with a moderate amount of impurities in the form of solid cores is commonly used for telephone relays and switches, contactors, electromagnets, plungers, pole parts, solenoids and other DC devices. Since pure iron has low resistance, it is not suitable for its magnetic application in AC devices. In general, the magnetic properties of pure iron can be further enhanced as the degree of impurity decreases. The residual non-metallic impurity in iron must be less than the solid solubility limit at room temperature.
Soft Magnetic Materials Market Segment Analysis - By Application
Motors is projected to witness highest share in Soft Magnetic Materials market in 2019. Currently motors are typically made from silicon steels. Metal amorphous nanocomposite materials (MANCs) offer an alternative to silicone steels which, due to their high resistance, do not heat up as much and can thus rotate at much higher speeds. According to the University of Chicago figures, 50 percent of U.S. power goes into the generator. Vehicles like cars and planes rely on power-transforming engines, as do household appliances like vacuums and refrigerators. Since this room is so big, more powerful motors may make a major difference in energy consumption. In 2020, end use industries of soft magnetic materials experienced downturn due to COVID-19 pandemic due to temporary lockdown of all economic activities across globe. This in turn has impacted the demand and supply chain of Soft Magnetic Materials.
Soft Magnetic Materials Market Segment Analysis - By End Use
Electrical and Electronics dominates the Soft Magnetic Materials market consisting share of 10%. Soft magnetic materials are used for two types of AC and DC applications. In DC applications, the material is charged with a particular final purpose to conduct the operation and then demagnetized at the end of the operation. In AC applications, the material will be constantly cycled from being magnetized in one direction to the next, over the time of operation. The use of such materials in electrical applications and the use of such materials in energy generation wind turbines will also contribute to the growth of the industry. In automotive industry soft magnetic materials are used for anti-lock brake systems, fuel injectors, motors, compressors and various rotating devices.
Soft Magnetic Materials Market Segment Analysis - Geography
Asia-Pacific (APAC) dominated the Soft Magnetic Materials market growing at CAGR of 39% followed by North America and Europe. Significant factors contributing to regional market growth include growing the base of automobile producers and rising investment in the production of advanced electronics and telecommunications industries. Increasing demand encourages key players to move their emphasis from developed nations to emerging nations such as China, India and South Korea. China and Japan are the key countries driving the demand for soft magnetic materials in the Asia-Pacific region. The automotive industry in China has seen exponential growth. The North American market is expected to see substantial growth in the forecast period led by technological developments in the field of soft magnetic materials. The European area is expected to see steady growth in the global demand for soft magnetic materials during the forecast period. The European area is the epicenter for major automotive manufacturing firms. The region has experienced rising R&D investment on the production of high energy efficient vehicles. Such efforts are expected to fuel demand for the soft magnetic materials market in the region.
Soft Magnetic Materials Market Drivers
Advancement in Soft Magnetic Material will drive the market
An advanced soft magnetic material has been developed for ac and dc motor applications. In comparison to the conventional method of stacking punched laminations, the engine components are made of a powder metallurgical process. This new material has many production advantages. It also has strong high-frequency magnetic properties, a core loss of 90 W / kg when calculated at 400 Hz and an induction of 1,5 T due to its low eddy current loss. Components made from this new magnetic material have shown comparable performance at 60 Hz and superior performance at frequencies > 60 Hz compared to cold rolled motor lamination steels. When sintered, the fresh pressed material still has outstanding dc properties.
Soft Magnetic Materials Market Challenges
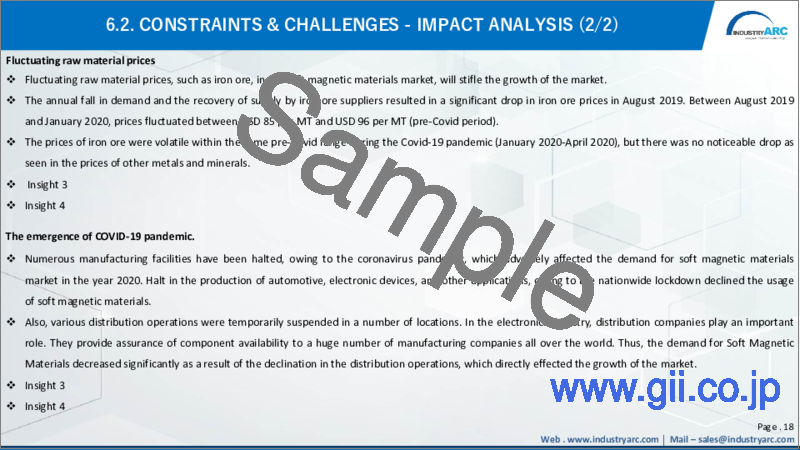
Fluctuations in raw material prices and destabilization of the supply chain can restrict the market
The prices of iron ore saw a substantial decline in August 2019 (already discussed in our previous blog) due to the seasonal decline in demand and the recovery of supply by iron ore majors. Since then, prices have fluctuated between USD 85 per MT and USD 96 per MT between August 2019 and January 2020 (pre-Covid period). During the Covid period (January 2020-April 2020) as well, the prices of iron ore were volatile within the same pre-Covid range, but there was no significant fall as seen in the prices of other metals and minerals.
Market Landscape
Technology launches, acquisitions and R&D activities are key strategies adopted by players in the Soft Magnetic Materials market. In 2019 the Soft Magnetic Materials market has been consolidated by the top five players accounting for xx% of the share. Major players in the Soft Magnetic Materials market rare Toshiba Materials Co., Ltd., GKN Sinter Metals Inc., Sintex a/s, Hitachi Metals, Ltd., Mate Co., Ltd. and Others.
Acquisitions/Technology Launches/ Product Launches
In July 2020, The Fraunhofer Institute for Manufacturing Technology and Advanced Materials (IFAM) in Dresden, Germany, has launched a new research area working group on soft magnetic materials. This research is particularly important for the highly topical areas of renewable energy and electromobility.
Table of Contents
1. Soft Magnetic Materials Market - Market Overview
- 1.1 Definition and Scope
2. Soft Magnetic Materials Market - Executive Summary
- 2.1 Market Revenue, Market Size and Key Trends by Company
- 2.2 Key trends by Type
- 2.3 Key Trends by Application
- 2.4 Key Trends by End Use
- 2.5 Key trends by Geography
3. Soft Magnetic Materials Market - Landscape
- 3.1 Comparative analysis
- 3.1.1 Market Share Analysis- Top Companies
- 3.1.2 Product Benchmarking- Top Companies
- 3.1.3 Top 5 Financials Analysis
- 3.1.4 Patent Analysis- Top Companies
- 3.1.5 Pricing Analysis
4. Soft Magnetic Materials Market - Market Forces
- 4.1 Market Drivers
- 4.2 Market Constraints
- 4.3 Market Opportunities
- 4.4 Porters five force model
- 4.4.1 Bargaining power of suppliers
- 4.4.2 Bargaining powers of customers
- 4.4.3 Threat of new entrants
- 4.4.4 Rivalry among existing players
- 4.4.5 Threat of substitutes
5. Soft Magnetic Materials Market - Strategic Analysis
- 5.1 Value Chain Analysis
- 5.2 Opportunity Analysis
- 5.3 Product Life Cycle
- 5.4 Supplier and Distributor Analysis
6. Soft Magnetic Materials Market - By Type (Market Size -$Million, KT)
- 6.1 Iron Silicon Alloys
- 6.2 Nickel Iron Alloys
- 6.3 Pure Iron
- 6.4 Soft Ferrites
- 6.5 Amorphous Nano Crystalline Alloys
- 6.6 Others
7. Soft Magnetic Materials Market - By Application (Market Size -$Million)
- 7.1 Electric Circuits
- 7.2 Motors
- 7.3 Transformers
- 7.4 Alternator
- 7.5 Others
8. Soft Magnetic Materials Market - By End Use (Market Size -$Million)
- 8.1 Electrical and Electronics
- 8.2 Telecommunication
- 8.3 Automotive
- 8.4 Energy and Power
- 8.5 Others
9. Soft Magnetic Materials Market - By Geography (Market Size -$Million)
- 9.1 North America
- 9.1.1 U.S
- 9.1.2 Canada
- 9.1.3 Mexico
- 9.2 South America
- 9.2.1 Brazil
- 9.2.2 Argentina
- 9.2.3 Colombia
- 9.2.4 Chile
- 9.2.5 Rest of South America
- 9.3 Europe
- 9.3.1 UK
- 9.3.2 Germany
- 9.3.3 France
- 9.3.4 Italy
- 9.3.5 Netherland
- 9.3.6 Spain
- 9.3.7 Russia
- 9.3.8 Belgium
- 9.3.9 Rest of Europe
- 9.4 Asia-Pacific
- 9.4.1 China
- 9.4.2 Japan
- 9.4.3 India
- 9.4.4 South Korea
- 9.4.5 Australia and New Zealand
- 9.4.6 Rest of APAC
- 9.5 Rest of the World
- 9.5.1 Middle East
- 9.5.1.1 Saudi Arabia
- 9.5.1.2 U.A.E
- 9.5.1.3 Israel
- 9.5.1.4 Rest of the Middle East
- 9.5.2 Africa
- 9.5.2.1 South Africa
- 9.5.2.2 Nigeria
- 9.5.2.3 Rest of Africa
- 9.5.1 Middle East
10. Soft Magnetic Materials Market - Entropy
- 10.1 New Product Launches
- 10.2 M&As, Collaborations, JVs and Partnerships
11. Soft Magnetic Materials Market Company Analysis
- 11.1 Market Share, Company Revenue, Products, M&A, Developments
- 11.2 Company 1
- 11.3 Company 2
- 11.4 Company 3
- 11.5 Company 4
- 11.6 Company 5
- 11.7 Company 6
- 11.8 Company 7
- 11.9 Company 8
- 11.10 Company 9
- 11.11 Company 10 and more
"*Financials would be provided on a best efforts basis for private companies"


