|
|
市場調査レポート
商品コード
1212720
体外診断 (IVD) 用医療機器の世界市場:産業分析・成長動向・競合分析 (2023年~2029年)Global In-Vitro Diagnostics (Ivds) Medical Device Industry Research Report, Growth Trends and Competitive Analysis 2023-2029 |
||||||
|
|
|||||||
|
● お客様のご希望に応じて、既存データの加工や未掲載情報(例:国別セグメント)の追加などの対応が可能です。 詳細はお問い合わせください。 |
|||||||


| 体外診断 (IVD) 用医療機器の世界市場:産業分析・成長動向・競合分析 (2023年~2029年) |
|
出版日: 2023年02月07日
発行: QYResearch
ページ情報: 英文 230 Pages
納期: 2~3営業日
|
- 全表示
- 概要
- 図表
- 目次
世界の体外診断 (IVD) 用医療機器の市場規模は、2022年に1,051億3,800万米ドル、2029年には1,301億1,600万米ドルの再調整規模に達し、予測期間中 (2023年~2029年) に5.01%のCAGRで成長すると予測されています。
米国の体外診断 (IVD) 用医療機器の市場規模は、2023年の388億6,000万米ドルから、2029年には479億4,200万米ドルに増加し、予測期間中 (2023年~2029年) に3.56%のCAGRで成長する、と予測されます。
中国の体外診断 (IVD) 用医療機器の市場規模は、2023年の150億8,500万米ドルから、2029年には255億6,900万米ドルに増加し、予測期間中 (2023年~2029年) に9.19%のCAGRで成長する、と予測されています。
欧州の体外診断 (IVD) 用医療機器の市場規模は、2023年の191億2,400万米ドルから、2029年には228億7,000万米ドルに増加し、予測期間中 (2023年~2029年) に3.03%のCAGRで成長する、と推定されます。
当レポートでは、世界の体外診断 (IVD) 用医療機器の市場について分析し、種類別・用途別・地域別 (国別) の市場動向の見通し (2018年~2029年)、主要企業のプロファイルなどについて調査しております。
目次
第1章 分析概要
- 体外診断 (IVD) 用医療機器の定義
- 種類別の市場
- 市場規模・成長率:種類別 (2018年・2022年・2029年)
- 消耗品
- 装置
- 用途別の市場
- 市場規模・成長率:用途別 (2018年・2022年・2029年)
- 病院
- 検査室
- 家庭
- 前提・制約条件
- 分析対象
- 分析期間
第2章 世界の体外診断 (IVD) 用医療機器の販売
- 世界の体外診断 (IVD) 用医療機器の収益:推定・予測 (2018年~2029年)
- 世界の体外診断 (IVD) 用医療機器の収益:地域別 (2018年・2022年・2029年)
- 世界の体外診断 (IVD) 用医療機器の収益:地域別
- 収益:地域別 (2018年~2023年)
- 収益:地域別 (2024年~2029年)
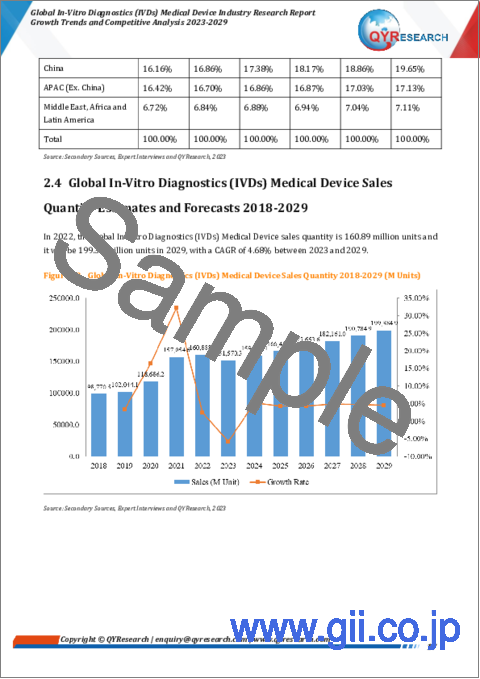
- 世界の体外診断 (IVD) 用医療機器の販売量:推定・予測 (2018年~2029年)
- 世界の体外診断 (IVD) 用医療機器の販売量:地域別 (2018年・2022年・2029年)
- 世界の体外診断 (IVD) 用医療機器の販売量:地域別
- 販売量:地域別 (2018年~2023年)
- 販売量:地域別 (2024年~2029年)
- 北米
- 欧州
- 中国
- アジア太平洋 (中国を除く)
- 中東・アフリカ、ラテンアメリカ
第3章 メーカー別の競合
- 世界の体外診断 (IVD) 用医療機器の販売量:メーカー別
- 世界の体外診断 (IVD) 用医療機器の収益:メーカー別
- 世界の体外診断 (IVD) 用医療機器の販売価格:メーカー別
- 世界の体外診断 (IVD) 用医療機器の主要企業:業界ランキング (2021年・2022年)
- 競合情勢の分析
- 世界の体外診断 (IVD) 用医療機器の主要メーカー:製造拠点・本社
- 世界の体外診断 (IVD) 用医療機器の主要メーカー:主要製品
- 世界の体外診断 (IVD) 用医療機器の主要メーカー:設立時期
- 企業合併・買収 (M&A)、拡張計画
第4章 種類別の推定・予測
- 世界の体外診断 (IVD) 用医療機器の販売量:種類別
- 世界の体外診断 (IVD) 用医療機器の収益:種類別
- 世界の体外診断 (IVD) 用医療機器の価格:種類別
第5章 用途別の推定・予測
- 世界の体外診断 (IVD) 用医療機器の販売量:用途別
- 世界の体外診断 (IVD) 用医療機器の収益:用途別
- 世界の体外診断 (IVD) 用医療機器の価格:用途別
第6章 北米
- 体外診断 (IVD) 用医療機器の販売量:企業別
- 体外診断 (IVD) 用医療機器の市場規模:種類別
- 体外診断 (IVD) 用医療機器の市場規模:用途別
- 体外診断 (IVD) 用医療機器の市場規模:国別
- 米国
- カナダ
第7章 欧州
- 体外診断 (IVD) 用医療機器の販売量:企業別
- 体外診断 (IVD) 用医療機器の市場規模:種類別
- 体外診断 (IVD) 用医療機器の市場規模:用途別
- 体外診断 (IVD) 用医療機器の市場規模:国別
- ドイツ
- フランス
- 英国
- イタリア
- ロシア
第8章 中国
- 体外診断 (IVD) 用医療機器の販売量:企業別
- 体外診断 (IVD) 用医療機器の市場規模:種類別
- 体外診断 (IVD) 用医療機器の市場規模:用途別
第9章 アジア太平洋 (中国以外)
- 体外診断 (IVD) 用医療機器の販売量:企業別
- 体外診断 (IVD) 用医療機器の市場規模:種類別
- 体外診断 (IVD) 用医療機器の市場規模:用途別
- 体外診断 (IVD) 用医療機器の市場規模:地域別
- 日本
- 韓国
- インド
- 東南アジア
- オーストラリア
第10章 中東・アフリカ、ラテンアメリカ
- 体外診断 (IVD) 用医療機器の販売量:企業別
- 体外診断 (IVD) 用医療機器の市場規模:種類別
- 体外診断 (IVD) 用医療機器の市場規模:用途別
- 体外診断 (IVD) 用医療機器の市場規模:国別
- メキシコ
- ブラジル
- 中東
- アフリカ
第11章 企業プロファイル
- Roche
- Abbott
- Danaher
- Siemens Healthineers
- Thermo Fisher Scientific
- Sysmex
- BioMerieux
- Ortho Clinical Diagnostics
- Becton, Dickinson
- Bio-Rad Laboratories
- Hologic
- LifeScan
- Qiagen
- Wuhan Easy Diagnosis
- Wondfo
- KHB
- Hotgen
- Mindray
- Sinocare
- Getein Biotech
第12章 バリューチェーンと販売チャネルの分析
- 体外診断 (IVD) 用医療機器のバリューチェーン分析
- 体外診断 (IVD) 用医療機器の主要原材料
- 体外診断 (IVD) 用医療機器の製造モードとプロセス
- 体外診断 (IVD) 用医療機器の販売とマーケティング
- 体外診断 (IVD) 用医療機器の顧客
第13章 体外診断 (IVD) 用医療機器の市場力学
- 体外診断 (IVD) 用医療機器業界の動向
- 体外診断 (IVD) 用医療機器市場の促進要因
- 体外診断 (IVD) 用医療機器市場の課題
- 体外診断 (IVD) 用医療機器市場の抑制要因
第14章 主な調査結果
第15章 付録
List of Tables
- Table 1. Global In-Vitro Diagnostics (IVDs) Medical Device Market Size Growth Rate (CAGR) by Type, 2018 VS 2022 VS 2029 (US$ Million)
- Table 2. Global In-Vitro Diagnostics (IVDs) Medical Device Market Size Growth Rate (CAGR) by Application, 2018 VS 2022 VS 2029 (US$ Million)
- Table 3. Global In-Vitro Diagnostics (IVDs) Medical Device Revenue by Region: 2018 VS 2022 VS 2029 (US$ Million)
- Table 4. Global In-Vitro Diagnostics (IVDs) Medical Device Revenue by Region (2018-2023) & (US$ Million)
- Table 5. Global In-Vitro Diagnostics (IVDs) Medical Device Revenue Market Share by Region (2018-2023)
- Table 6. Global In-Vitro Diagnostics (IVDs) Medical Device Revenue by Region (2024-2029) & (US$ Million)
- Table 7. Global In-Vitro Diagnostics (IVDs) Medical Device Revenue Market Share by Region (2024-2029)
- Table 8. Global In-Vitro Diagnostics (IVDs) Medical Device Sales Quantity by Region: 2018 VS 2022 VS 2029 (M Units)
- Table 9. Global In-Vitro Diagnostics (IVDs) Medical Device Sales Quantity by Region (2018-2023) & (M Units)
- Table 10. Global In-Vitro Diagnostics (IVDs) Medical Device Sales Quantity Market Share by Region (2018-2023)
- Table 11. Global In-Vitro Diagnostics (IVDs) Medical Device Sales Quantity by Region (2024-2029) & (M Units)
- Table 12. Global In-Vitro Diagnostics (IVDs) Medical Device Sales Quantity Market Share by Region (2024-2029)
- Table 13. Global In-Vitro Diagnostics (IVDs) Medical Device Sales Quantity by Manufacturers (2018-2023) & (M Units)
- Table 14. Global In-Vitro Diagnostics (IVDs) Medical Device Sales Quantity Share by Manufacturers (2018-2023)
- Table 15. Global In-Vitro Diagnostics (IVDs) Medical Device Revenue by Manufacturers (2018-2023) & (US$ Million)
- Table 16. Global In-Vitro Diagnostics (IVDs) Medical Device Revenue Share by Manufacturers (2018-2023)
- Table 17. Global In-Vitro Diagnostics (IVDs) Medical Device Price by Manufacturers 2018-2023 (US$/K Unit)
- Table 18. Global Key Players of In-Vitro Diagnostics (IVDs) Medical Device, Industry Ranking, 2021 VS 2022
- Table 19. Global In-Vitro Diagnostics (IVDs) Medical Device Manufacturers Market Concentration Ratio (CR5 and HHI)
- Table 20. Global In-Vitro Diagnostics (IVDs) Medical Device by Company Type (Tier 1, Tier 2, and Tier 3) & (based on the Revenue in In-Vitro Diagnostics (IVDs) Medical Device as of 2022)
- Table 21. Global Key Manufacturers of In-Vitro Diagnostics (IVDs) Medical Device, Manufacturing Base Distribution and Headquarters
- Table 22. Global Key Manufacturers of In-Vitro Diagnostics (IVDs) Medical Device, Product Offered
- Table 23. Founded Date of Global Key Manufacturers of In-Vitro Diagnostics (IVDs) Medical Device
- Table 24. Mergers & Acquisitions, Expansion Plans
- Table 25. Global In-Vitro Diagnostics (IVDs) Medical Device Sales Quantity by Type (2018-2023) & (M Units)
- Table 26. Global In-Vitro Diagnostics (IVDs) Medical Device Sales Quantity by Type (2024-2029) & (M Units)
- Table 27. Global In-Vitro Diagnostics (IVDs) Medical Device Revenue by Type (2018-2023) & (US$ Million)
- Table 28. Global In-Vitro Diagnostics (IVDs) Medical Device Revenue by Type (2024-2029) & (US$ Million)
- Table 29. Global In-Vitro Diagnostics (IVDs) Medical Device Revenue Share by Type (2018-2023)
- Table 30. Global In-Vitro Diagnostics (IVDs) Medical Device Revenue Share by Type (2024-2029)
- Table 31. In-Vitro Diagnostics (IVDs) Medical Device Price by Type (2018-2023) & (US$/K Unit)
- Table 32. Global In-Vitro Diagnostics (IVDs) Medical Device Price Forecast by Type (2024-2029) & (US$/K Unit)
- Table 33. Global In-Vitro Diagnostics (IVDs) Medical Device Sales Quantity by Application (2018-2023) & (M Units)
- Table 34. Global In-Vitro Diagnostics (IVDs) Medical Device Sales Quantity by Application (2024-2029) & (M Units)
- Table 35. Global In-Vitro Diagnostics (IVDs) Medical Device Sales Quantity Share by Application (2018-2023)
- Table 36. Global In-Vitro Diagnostics (IVDs) Medical Device Sales Quantity Share by Application (2024-2029)
- Table 37. Global In-Vitro Diagnostics (IVDs) Medical Device Revenue by Application (2018-2023) & (US$ Million)
- Table 38. Global In-Vitro Diagnostics (IVDs) Medical Device Revenue by Application (2024-2029) & (US$ Million)
- Table 39. Global In-Vitro Diagnostics (IVDs) Medical Device Revenue Share by Application (2018-2023)
- Table 40. Global In-Vitro Diagnostics (IVDs) Medical Device Revenue Share by Application (2024-2029)
- Table 41. In-Vitro Diagnostics (IVDs) Medical Device Price by Application (2018-2023) & (US$/K Unit)
- Table 42. Global In-Vitro Diagnostics (IVDs) Medical Device Price Forecast by Application (2024-2029) & (US$/K Unit)
- Table 43. North America In-Vitro Diagnostics (IVDs) Medical Device Sales Quantity by Company (2018-2023) & (M Units)
- Table 44. North America In-Vitro Diagnostics (IVDs) Medical Device Revenue by Company (2018-2023) & (US$ Million)
- Table 45. North America In-Vitro Diagnostics (IVDs) Medical Device Sales Quantity by Type (2018-2023) & (M Units)
- Table 46. North America In-Vitro Diagnostics (IVDs) Medical Device Sales Quantity by Type (2024-2029) & (M Units)
- Table 47. North America In-Vitro Diagnostics (IVDs) Medical Device Revenue by Type (2018-2023) & (US$ Million)
- Table 48. North America In-Vitro Diagnostics (IVDs) Medical Device Revenue by Type (2024-2029) & (US$ Million)
- Table 49. North America In-Vitro Diagnostics (IVDs) Medical Device Sales Quantity by Application (2018-2023) & (M Units)
- Table 50. North America In-Vitro Diagnostics (IVDs) Medical Device Sales Quantity by Application (2024-2029) & (M Units)
- Table 51. North America In-Vitro Diagnostics (IVDs) Medical Device Revenue by Application (2018-2023) & (US$ Million)
- Table 52. North America In-Vitro Diagnostics (IVDs) Medical Device Revenue by Application (2024-2029) & (US$ Million)
- Table 53. North America In-Vitro Diagnostics (IVDs) Medical Device Revenue by Country: 2018 VS 2022 VS 2029 (US$ Million)
- Table 54. North America In-Vitro Diagnostics (IVDs) Medical Device Revenue by Country (2018-2023) & (US$ Million)
- Table 55. North America In-Vitro Diagnostics (IVDs) Medical Device Revenue by Country (2024-2029) & (US$ Million)
- Table 56. North America In-Vitro Diagnostics (IVDs) Medical Device Sales Quantity by Country (2018-2023) & (M Units)
- Table 57. North America In-Vitro Diagnostics (IVDs) Medical Device Sales Quantity by Country (2024-2029) & (M Units)
- Table 58. Europe In-Vitro Diagnostics (IVDs) Medical Device Sales Quantity by Company (2018-2023) & (M Units)
- Table 59. Europe In-Vitro Diagnostics (IVDs) Medical Device Revenue by Company (2018-2023) & (US$ Million)
- Table 60. Europe In-Vitro Diagnostics (IVDs) Medical Device Sales by Type (2018-2023) & (M Units)
- Table 61. Europe In-Vitro Diagnostics (IVDs) Medical Device Sales by Type (2024-2029) & (M Units)
- Table 62. Europe In-Vitro Diagnostics (IVDs) Medical Device Revenue by Type (2018-2023) & (US$ Million)
- Table 63. Europe In-Vitro Diagnostics (IVDs) Medical Device Revenue by Type (2024-2029) & (US$ Million)
- Table 64. Europe In-Vitro Diagnostics (IVDs) Medical Device Sales Quantity by Application (2018-2023) & (M Units)
- Table 65. Europe In-Vitro Diagnostics (IVDs) Medical Device Sales Quantity by Application (2024-2029) & (M Units)
- Table 66. Europe In-Vitro Diagnostics (IVDs) Medical Device Revenue by Application (2018-2023) & (US$ Million)
- Table 67. Europe In-Vitro Diagnostics (IVDs) Medical Device Revenue by Application (2024-2029) & (US$ Million)
- Table 68. Europe In-Vitro Diagnostics (IVDs) Medical Device Revenue by Country: 2018 VS 2022 VS 2029 (US$ Million)
- Table 69. Europe In-Vitro Diagnostics (IVDs) Medical Device Revenue by Country (2018-2023) & (US$ Million)
- Table 70. Europe In-Vitro Diagnostics (IVDs) Medical Device Revenue by Country (2024-2029) & (US$ Million)
- Table 71. Europe In-Vitro Diagnostics (IVDs) Medical Device Sales Quantity by Country (2018-2023) & (M Units)
- Table 72. Europe In-Vitro Diagnostics (IVDs) Medical Device Sales Quantity by Country (2024-2029) & (M Units)
- Table 73. China In-Vitro Diagnostics (IVDs) Medical Device Sales Quantity by Company (2018-2023) & (M Units)
- Table 74. China In-Vitro Diagnostics (IVDs) Medical Device Revenue by Company (2018-2023) & (US$ Million)
- Table 75. China In-Vitro Diagnostics (IVDs) Medical Device Sales by Type (2018-2023) & (M Units)
- Table 76. China In-Vitro Diagnostics (IVDs) Medical Device Sales by Type (2024-2029) & (M Units)
- Table 77. China In-Vitro Diagnostics (IVDs) Medical Device Revenue by Type (2018-2023) & (US$ Million)
- Table 78. China In-Vitro Diagnostics (IVDs) Medical Device Revenue by Type (2024-2029) & (US$ Million)
- Table 79. China In-Vitro Diagnostics (IVDs) Medical Device Sales by Application (2018-2023) & (M Units)
- Table 80. China In-Vitro Diagnostics (IVDs) Medical Device Sales by Application (2024-2029) & (M Units)
- Table 81. China In-Vitro Diagnostics (IVDs) Medical Device Revenue by Application (2018-2023) & (US$ Million)
- Table 82. China In-Vitro Diagnostics (IVDs) Medical Device Revenue by Application (2024-2029) & (US$ Million)
- Table 83. APAC In-Vitro Diagnostics (IVDs) Medical Device Sales Quantity by Company (2018-2023) & (M Units)
- Table 84. APAC In-Vitro Diagnostics (IVDs) Medical Device Revenue by Company (2018-2023) & (US$ Million)
- Table 85. APAC In-Vitro Diagnostics (IVDs) Medical Device Sales by Type (2018-2023) & (M Units)
- Table 86. APAC In-Vitro Diagnostics (IVDs) Medical Device Sales by Type (2024-2029) & (M Units)
- Table 87. APAC In-Vitro Diagnostics (IVDs) Medical Device Revenue by Type (2018-2023) & (US$ Million)
- Table 88. APAC In-Vitro Diagnostics (IVDs) Medical Device Revenue by Type (2024-2029) & (US$ Million)
- Table 89. APAC In-Vitro Diagnostics (IVDs) Medical Device Sales by Application (2018-2023) & (M Units)
- Table 90. APAC In-Vitro Diagnostics (IVDs) Medical Device Sales by Application (2024-2029) & (M Units)
- Table 91. APAC In-Vitro Diagnostics (IVDs) Medical Device Revenue by Application (2018-2023) & (US$ Million)
- Table 92. APAC In-Vitro Diagnostics (IVDs) Medical Device Revenue by Application (2024-2029) & (US$ Million)
- Table 93. APAC In-Vitro Diagnostics (IVDs) Medical Device Revenue by Region: 2018 VS 2022 VS 2029 (US$ Million)
- Table 94. APAC In-Vitro Diagnostics (IVDs) Medical Device Revenue by Region (2018-2023) & (US$ Million)
- Table 95. APAC In-Vitro Diagnostics (IVDs) Medical Device Revenue by Region (2024-2029) & (US$ Million)
- Table 96. APAC In-Vitro Diagnostics (IVDs) Medical Device Sales Quantity by Region (2018-2023) & (M Units)
- Table 97. APAC In-Vitro Diagnostics (IVDs) Medical Device Sales Quantity by Region (2024-2029) & (M Units)
- Table 98. Middle East, Africa and Latin America In-Vitro Diagnostics (IVDs) Medical Device Sales Quantity by Company (2018-2023) & (M Units)
- Table 99. Middle East, Africa and Latin America In-Vitro Diagnostics (IVDs) Medical Device Revenue by Company (2018-2023) & (US$ Million)
- Table 100. Middle East, Africa and Latin America In-Vitro Diagnostics (IVDs) Medical Device Sales Quantity by Type (2018-2023) & (M Units)
- Table 101. Middle East, Africa and Latin America In-Vitro Diagnostics (IVDs) Medical Device Sales Quantity by Type (2024-2029) & (M Units)
- Table 102. Middle East, Africa and Latin America In-Vitro Diagnostics (IVDs) Medical Device Revenue by Type (2018-2023) & (US$ Million)
- Table 103. Middle East, Africa and Latin America In-Vitro Diagnostics (IVDs) Medical Device Revenue by Type (2024-2029) & (US$ Million)
- Table 104. Middle East, Africa and Latin America In-Vitro Diagnostics (IVDs) Medical Device Sales Quantity by Application (2018-2023) & (M Units)
- Table 105. Middle East, Africa and Latin America In-Vitro Diagnostics (IVDs) Medical Device Sales Quantity by Application (2024-2029) & (M Units)
- Table 106. Middle East, Africa and Latin America In-Vitro Diagnostics (IVDs) Medical Device Revenue by Application (2018-2023) & (US$ Million)
- Table 107. Middle East, Africa and Latin America In-Vitro Diagnostics (IVDs) Medical Device Revenue by Application (2024-2029) & (US$ Million)
- Table 108. Middle East, Africa and Latin America In-Vitro Diagnostics (IVDs) Medical Device Revenue by Country: 2018 VS 2022 VS 2029 (US$ Million)
- Table 109. Middle East, Africa and Latin America In-Vitro Diagnostics (IVDs) Medical Device Revenue by Country (2018-2023) & (US$ Million)
- Table 110. Middle East, Africa and Latin America In-Vitro Diagnostics (IVDs) Medical Device Revenue by Country (2024-2029) & (US$ Million)
- Table 111. Middle East, Africa and Latin America In-Vitro Diagnostics (IVDs) Medical Device Sales Quantity by Country (2018-2023) & (M Units)
- Table 112. Middle East, Africa and Latin America In-Vitro Diagnostics (IVDs) Medical Device Sales Quantity by Country (2024-2029) & (M Units)
- Table 113. Roche Company Information
- Table 114. Roche Description and Overview
- Table 115. Roche In-Vitro Diagnostics (IVDs) Medical Device Sales Quantity (M Units), Revenue (US$ Million), Average Selling Price (ASP) & (US$/K Unit) and Gross Margin (2018-2023)
- Table 116. Roche In-Vitro Diagnostics (IVDs) Medical Device Products and Services
- Table 117. Roche Recent Developments
- Table 118. Abbott Company Information
- Table 119. Abbott Description and Overview
- Table 120. Abbott In-Vitro Diagnostics (IVDs) Medical Device Sales Quantity (M Units), Revenue (US$ Million), Average Selling Price (ASP) & (US$/K Unit) and Gross Margin (2018-2023)
- Table 121. Abbott In-Vitro Diagnostics (IVDs) Medical Device Products and Services
- Table 122. Abbott Recent Developments
- Table 123. Danaher Company Information
- Table 124. Danaher Description and Overview
- Table 125. Danaher In-Vitro Diagnostics (IVDs) Medical Device Sales Quantity (M Units), Revenue (US$ Million), Average Selling Price (ASP) & (US$/K Unit) and Gross Margin (2018-2023)
- Table 126. Danaher In-Vitro Diagnostics (IVDs) Medical Device Products and Services
- Table 127. Danaher Recent Developments
- Table 128. Siemens Healthineers Company Information
- Table 129. Siemens Healthineers Description and Overview
- Table 130. Siemens Healthineers In-Vitro Diagnostics (IVDs) Medical Device Sales Quantity (M Units), Revenue (US$ Million), Average Selling Price (ASP) & (US$/K Unit) and Gross Margin (2018-2023)
- Table 131. Siemens Healthineers In-Vitro Diagnostics (IVDs) Medical Device Products and Services
- Table 132. Siemens Healthineers Recent Developments
- Table 133. Thermo Fisher Scientific Company Information
- Table 134. Thermo Fisher Scientific Description and Overview
- Table 135. Thermo Fisher Scientific In-Vitro Diagnostics (IVDs) Medical Device Sales Quantity (M Units), Revenue (US$ Million), Average Selling Price (ASP) & (US$/K Unit) and Gross Margin (2018-2023)
- Table 136. Thermo Fisher Scientific In-Vitro Diagnostics (IVDs) Medical Device Products and Services
- Table 137. Thermo Fisher Scientific Recent Developments
- Table 138. Sysmex Company Information
- Table 139. Sysmex Description and Overview
- Table 140. Sysmex In-Vitro Diagnostics (IVDs) Medical Device Sales Quantity (M Units), Revenue (US$ Million), Average Selling Price (ASP) & (US$/K Unit) and Gross Margin (2018-2023)
- Table 141. Sysmex In-Vitro Diagnostics (IVDs) Medical Device Products and Services
- Table 142. BioMerieux Company Information
- Table 143. BioMerieux Description and Overview
- Table 144. BioMerieux In-Vitro Diagnostics (IVDs) Medical Device Sales Quantity (M Units), Revenue (US$ Million), Average Selling Price (ASP) & (US$/K Unit) and Gross Margin (2018-2023)
- Table 145. BioMerieux In-Vitro Diagnostics (IVDs) Medical Device Products and Services
- Table 146. Ortho Clinical Diagnostics Company Information
- Table 147. Ortho Clinical Diagnostics Description and Overview
- Table 148. Ortho Clinical Diagnostics In-Vitro Diagnostics (IVDs) Medical Device Sales Quantity (M Units), Revenue (US$ Million), Average Selling Price (ASP) & (US$/K Unit) and Gross Margin (2018-2023)
- Table 149. Ortho Clinical Diagnostics In-Vitro Diagnostics (IVDs) Medical Device Products and Services
- Table 150. Ortho Clinical Diagnostics Recent Developments
- Table 151. Becton, Dickinson Company Information
- Table 152. Becton, Dickinson Description and Overview
- Table 153. Becton, Dickinson In-Vitro Diagnostics (IVDs) Medical Device Sales Quantity (M Units), Revenue (US$ Million), Average Selling Price (ASP) & (US$/K Unit) and Gross Margin (2018-2023)
- Table 154. Becton, Dickinson In-Vitro Diagnostics (IVDs) Medical Device Products and Services
- Table 155. Becton, Dickinson Recent Developments
- Table 156. Bio-Rad Laboratories Company Information
- Table 157. Bio-Rad Laboratories Description and Overview
- Table 158. Bio-Rad Laboratories In-Vitro Diagnostics (IVDs) Medical Device Sales Quantity (M Units), Revenue (US$ Million), Average Selling Price (ASP) & (US$/K Unit) and Gross Margin (2018-2023)
- Table 159. Bio-Rad Laboratories In-Vitro Diagnostics (IVDs) Medical Device Products and Services
- Table 160. Hologic Company Information
- Table 161. Hologic Description and Overview
- Table 162. Hologic In-Vitro Diagnostics (IVDs) Medical Device Sales Quantity (M Units), Revenue (US$ Million), Average Selling Price (ASP) & (US$/K Unit) and Gross Margin (2018-2023)
- Table 163. Hologic In-Vitro Diagnostics (IVDs) Medical Device Products and Services
- Table 164. Hologic Recent Developments
- Table 165. LifeScan Company Information
- Table 166. LifeScan Description and Overview
- Table 167. LifeScan In-Vitro Diagnostics (IVDs) Medical Device Sales Quantity (M Units), Revenue (US$ Million), Average Selling Price (ASP) & (US$/K Unit) and Gross Margin (2018-2023)
- Table 168. LifeScan In-Vitro Diagnostics (IVDs) Medical Device Products and Services
- Table 169. LifeScan Recent Developments
- Table 170. Qiagen Company Information
- Table 171. Qiagen Description and Overview
- Table 172. Qiagen In-Vitro Diagnostics (IVDs) Medical Device Sales Quantity (M Units), Revenue (US$ Million), Average Selling Price (ASP) & (US$/K Unit) and Gross Margin (2018-2023)
- Table 173. Qiagen In-Vitro Diagnostics (IVDs) Medical Device Products and Services
- Table 174. Wuhan Easy Diagnosis Company Information
- Table 175. Wuhan Easy Diagnosis Description and Overview
- Table 176. Wuhan Easy Diagnosis In-Vitro Diagnostics (IVDs) Medical Device Sales Quantity (M Units), Revenue (US$ Million), Average Selling Price (ASP) & (US$/K Unit) and Gross Margin (2018-2023)
- Table 177. Wuhan Easy Diagnosis In-Vitro Diagnostics (IVDs) Medical Device Products and Services
- Table 178. Wondfo Company Information
- Table 179. Wondfo Description and Overview
- Table 180. Wondfo In-Vitro Diagnostics (IVDs) Medical Device Sales Quantity (M Units), Revenue (US$ Million), Average Selling Price (ASP) & (US$/K Unit) and Gross Margin (2018-2023)
- Table 181. Wondfo In-Vitro Diagnostics (IVDs) Medical Device Products and Services
- Table 182. KHB Company Information
- Table 183. KHB Description and Overview
- Table 184. KHB In-Vitro Diagnostics (IVDs) Medical Device Sales Quantity (M Units), Revenue (US$ Million), Average Selling Price (ASP) & (US$/K Unit) and Gross Margin (2018-2023)
- Table 185. KHB In-Vitro Diagnostics (IVDs) Medical Device Products and Services
- Table 186. Hotgen Company Information
- Table 187. Hotgen Description and Overview
- Table 188. Hotgen In-Vitro Diagnostics (IVDs) Medical Device Sales Quantity (M Units), Revenue (US$ Million), Average Selling Price (ASP) & (US$/K Unit) and Gross Margin (2018-2023)
- Table 189. Hotgen In-Vitro Diagnostics (IVDs) Medical Device Products and Services
- Table 190. Mindray Company Information
- Table 191. Mindray Description and Overview
- Table 192. Mindray In-Vitro Diagnostics (IVDs) Medical Device Sales Quantity (M Units), Revenue (US$ Million), Average Selling Price (ASP) & (US$/K Unit) and Gross Margin (2018-2023)
- Table 193. Mindray In-Vitro Diagnostics (IVDs) Medical Device Products and Services
- Table 194. Sinocare Company Information
- Table 195. Sinocare Description and Overview
- Table 196. Sinocare In-Vitro Diagnostics (IVDs) Medical Device Sales Quantity (M Units), Revenue (US$ Million), Average Selling Price (ASP) & (US$/K Unit) and Gross Margin (2018-2023)
- Table 197. Sinocare In-Vitro Diagnostics (IVDs) Medical Device Products and Services
- Table 198. Getein Biotech Company Information
- Table 199. Getein Biotech Description and Overview
- Table 200. Getein Biotech In-Vitro Diagnostics (IVDs) Medical Device Sales Quantity (M Units), Revenue (US$ Million), Average Selling Price (ASP) & (US$/K Unit) and Gross Margin (2018-2023)
- Table 201. Getein Biotech In-Vitro Diagnostics (IVDs) Medical Device Products and Services
- Table 202. Key Raw Materials Lists
- Table 203. Raw Materials Key Suppliers Lists
- Table 204. In-Vitro Diagnostics (IVDs) Medical Device Distributors List
- Table 205. In-Vitro Diagnostics (IVDs) Medical Device Customers List
- Table 206. In-Vitro Diagnostics (IVDs) Medical Device Market Trends
- Table 207. In-Vitro Diagnostics (IVDs) Medical Device Market Drivers
- Table 208. In-Vitro Diagnostics (IVDs) Medical Device Market Challenges
- Table 209. In-Vitro Diagnostics (IVDs) Medical Device Market Restraints
- Table 210. Research Programs/Design for This Report
- Table 211. Key Data Information from Secondary Sources
- Table 212. Key Data Information from Primary Sources
- Table 213. QYR Business Unit and Senior & Team Lead Analysts
List of Figures
- Figure 1. In-Vitro Diagnostics (IVDs) Medical Device Product Picture
- Figure 2. Global In-Vitro Diagnostics (IVDs) Medical Device Market Size by Type, 2018-2029 (US$ Million)
- Figure 3. Global In-Vitro Diagnostics (IVDs) Medical Device Market Share by Type in 2022
- Figure 4. Global In-Vitro Diagnostics (IVDs) Medical Device Market Share by Type in 2029
- Figure 5. Consumables Product Picture
- Figure 6. Instrument Product Picture
- Figure 7. Global In-Vitro Diagnostics (IVDs) Medical Device Market Size by Application, 2018-2029 (US$ Million)
- Figure 8. Global In-Vitro Diagnostics (IVDs) Medical Device Market Share by Application in 2022
- Figure 9. Global In-Vitro Diagnostics (IVDs) Medical Device Market Share by Application in 2029
- Figure 10. Hospital
- Figure 11. Laboratory
- Figure 12. Household
- Figure 13. In-Vitro Diagnostics (IVDs) Medical Device Report Years Considered
- Figure 14. Global In-Vitro Diagnostics (IVDs) Medical Device Revenue, (US$ Million), 2018 VS 2023 VS 2029
- Figure 15. Global In-Vitro Diagnostics (IVDs) Medical Device Revenue 2018-2029 (US$ Million)
- Figure 16. Global In-Vitro Diagnostics (IVDs) Medical Device Revenue Market Share by Region in Percentage: 2022
- Figure 17. Global In-Vitro Diagnostics (IVDs) Medical Device Revenue Market Share by Region in Percentage: 2029
- Figure 18. Global In-Vitro Diagnostics (IVDs) Medical Device Sales Quantity 2018-2029 (M Units)
- Figure 19. Global In-Vitro Diagnostics (IVDs) Medical Device Sales Quantity Market Share by Region (2018-2023)
- Figure 20. Global In-Vitro Diagnostics (IVDs) Medical Device Sales Quantity Market Share by Region (2024-2029)
- Figure 21. North America In-Vitro Diagnostics (IVDs) Medical Device Sales Quantity YoY (2018-2029) & (M Units)
- Figure 22. North America In-Vitro Diagnostics (IVDs) Medical Device Revenue YoY (2018-2029) & (US$ Million)
- Figure 23. Europe In-Vitro Diagnostics (IVDs) Medical Device Sales Quantity YoY (2018-2029) & (M Units)
- Figure 24. Europe In-Vitro Diagnostics (IVDs) Medical Device Revenue YoY (2018-2029) & (US$ Million)
- Figure 25. China In-Vitro Diagnostics (IVDs) Medical Device Sales Quantity YoY (2018-2029) & (M Units)
- Figure 26. China In-Vitro Diagnostics (IVDs) Medical Device Revenue YoY (2018-2029) & (US$ Million)
- Figure 27. APAC (Ex. China) In-Vitro Diagnostics (IVDs) Medical Device Sales Quantity YoY (2018-2029) & (M Units)
- Figure 28. APAC (Ex. China) In-Vitro Diagnostics (IVDs) Medical Device Revenue YoY (2018-2029) & (US$ Million)
- Figure 29. Middle East, Africa and Latin America In-Vitro Diagnostics (IVDs) Medical Device Sales Quantity YoY (2018-2029) & (M Units)
- Figure 30. Middle East, Africa and Latin America In-Vitro Diagnostics (IVDs) Medical Device Revenue YoY (2018-2029) & (US$ Million)
- Figure 31. The Top Players Market Share by In-Vitro Diagnostics (IVDs) Medical Device Sales in 2022
- Figure 32. The Top Players Market Share by In-Vitro Diagnostics (IVDs) Medical Device Revenue in 2022
- Figure 33. Global In-Vitro Diagnostics (IVDs) Medical Device Revenue Market Share by Type (2018-2029)
- Figure 34. Global In-Vitro Diagnostics (IVDs) Medical Device Sales Quantity Market Share by Application (2018-2029)
- Figure 35. Global In-Vitro Diagnostics (IVDs) Medical Device Revenue Market Share by Application (2018-2029)
- Figure 36. North America In-Vitro Diagnostics (IVDs) Medical Device Sales Quantity Market Share by Company in 2022
- Figure 37. North America In-Vitro Diagnostics (IVDs) Medical Device Revenue Market Share by Company in 2022
- Figure 38. North America In-Vitro Diagnostics (IVDs) Medical Device Revenue Market Share by Type (2018-2029)
- Figure 39. North America In-Vitro Diagnostics (IVDs) Medical Device Sales Quantity Market Share by Application (2018-2029)
- Figure 40. North America In-Vitro Diagnostics (IVDs) Medical Device Revenue Market Share by Application (2018-2029)
- Figure 41. North America In-Vitro Diagnostics (IVDs) Medical Device Revenue Share by Country (2018-2029)
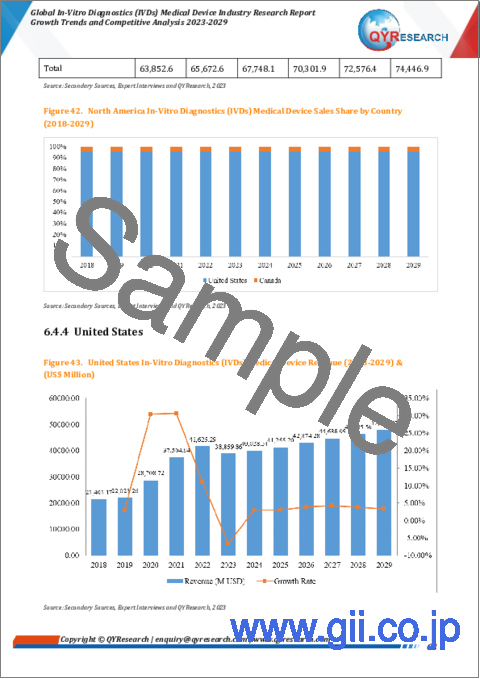
- Figure 42. North America In-Vitro Diagnostics (IVDs) Medical Device Sales Share by Country (2018-2029)
- Figure 43. United States In-Vitro Diagnostics (IVDs) Medical Device Revenue (2018-2029) & (US$ Million)
- Figure 44. Canada In-Vitro Diagnostics (IVDs) Medical Device Revenue (2018-2029) & (US$ Million)
- Figure 45. Europe In-Vitro Diagnostics (IVDs) Medical Device Sales Quantity Market Share by Company in 2022
- Figure 46. Europe In-Vitro Diagnostics (IVDs) Medical Device Revenue Market Share by Company in 2022
- Figure 47. Europe In-Vitro Diagnostics (IVDs) Medical Device Revenue Market Share by Type (2018-2029)
- Figure 48. Europe In-Vitro Diagnostics (IVDs) Medical Device Sales Quantity Market Share by Application (2018-2029)
- Figure 49. Europe In-Vitro Diagnostics (IVDs) Medical Device Revenue Market Share by Application (2018-2029)
- Figure 50. Europe In-Vitro Diagnostics (IVDs) Medical Device Revenue Share by Country (2018-2029)
- Figure 51. Europe In-Vitro Diagnostics (IVDs) Medical Device Sales Quantity Share by Country (2018-2029)
- Figure 52. Germany In-Vitro Diagnostics (IVDs) Medical Device Revenue (2018-2029) & (US$ Million)
- Figure 53. France In-Vitro Diagnostics (IVDs) Medical Device Revenue (2018-2029) & (US$ Million)
- Figure 54. U.K. In-Vitro Diagnostics (IVDs) Medical Device Revenue (2018-2029) & (US$ Million)
- Figure 55. Italy In-Vitro Diagnostics (IVDs) Medical Device Revenue (2018-2029) & (US$ Million)
- Figure 56. Russia In-Vitro Diagnostics (IVDs) Medical Device Revenue (2018-2029) & (US$ Million)
- Figure 57. China In-Vitro Diagnostics (IVDs) Medical Device Sales Quantity Market Share by Company in 2022
- Figure 58. China In-Vitro Diagnostics (IVDs) Medical Device Revenue Market Share by Company in 2022
- Figure 59. China In-Vitro Diagnostics (IVDs) Medical Device Revenue Market Share by Type (2018-2029)
- Figure 60. China In-Vitro Diagnostics (IVDs) Medical Device Sales Market Share by Application (2018-2029)
- Figure 61. China In-Vitro Diagnostics (IVDs) Medical Device Revenue Market Share by Application (2018-2029)
- Figure 62. APAC In-Vitro Diagnostics (IVDs) Medical Device Sales Quantity Market Share by Company in 2022
- Figure 63. APAC In-Vitro Diagnostics (IVDs) Medical Device Revenue Market Share by Company in 2022
- Figure 64. APAC In-Vitro Diagnostics (IVDs) Medical Device Revenue Market Share by Type (2018-2029)
- Figure 65. APAC In-Vitro Diagnostics (IVDs) Medical Device Sales Market Share by Application (2018-2029)
- Figure 66. APAC In-Vitro Diagnostics (IVDs) Medical Device Revenue Market Share by Application (2018-2029)
- Figure 67. APAC In-Vitro Diagnostics (IVDs) Medical Device Revenue Share by Region (2018-2029)
- Figure 68. APAC In-Vitro Diagnostics (IVDs) Medical Device Sales Quantity Share by Region (2018-2029)
- Figure 69. Japan In-Vitro Diagnostics (IVDs) Medical Device Revenue (2018-2029) & (US$ Million)
- Figure 70. South Korea In-Vitro Diagnostics (IVDs) Medical Device Revenue (2018-2029) & (US$ Million)
- Figure 71. India In-Vitro Diagnostics (IVDs) Medical Device Revenue (2018-2029) & (US$ Million)
- Figure 72. Southeast Asia In-Vitro Diagnostics (IVDs) Medical Device Revenue (2018-2029) & (US$ Million)
- Figure 73. Australia In-Vitro Diagnostics (IVDs) Medical Device Revenue (2018-2029) & (US$ Million)
- Figure 74. Middle East, Africa and Latin America In-Vitro Diagnostics (IVDs) Medical Device Sales Quantity Market Share by Company in 2022
- Figure 75. Middle East, Africa and Latin America In-Vitro Diagnostics (IVDs) Medical Device Revenue Market Share by Company in 2022
- Figure 76. Middle East, Africa and Latin America In-Vitro Diagnostics (IVDs) Medical Device Revenue Market Share by Type (2018-2029)
- Figure 77. Middle East, Africa and Latin America In-Vitro Diagnostics (IVDs) Medical Device Sales Quantity Market Share by Application (2018-2029)
- Figure 78. Middle East, Africa and Latin America In-Vitro Diagnostics (IVDs) Medical Device Revenue Market Share by Application (2018-2029)
- Figure 79. Middle East, Africa and Latin America In-Vitro Diagnostics (IVDs) Medical Device Revenue Share by Country (2018-2029)
- Figure 80. Middle East, Africa and Latin America In-Vitro Diagnostics (IVDs) Medical Device Sales Quantity Share by Country (2018-2029)
- Figure 81. Mexico In-Vitro Diagnostics (IVDs) Medical Device Revenue (2018-2029) & (US$ Million)
- Figure 82. Brazil In-Vitro Diagnostics (IVDs) Medical Device Revenue (2018-2029) & (US$ Million)
- Figure 83. Middle East In-Vitro Diagnostics (IVDs) Medical Device Revenue (2018-2029) & (US$ Million)
- Figure 84. Africa In-Vitro Diagnostics (IVDs) Medical Device Revenue (2018-2029) & (US$ Million)
- Figure 85. In-Vitro Diagnostics (IVDs) Medical Device Value Chain
- Figure 86. In-Vitro Diagnostics (IVDs) Medical Device Production Process
- Figure 87. Channels of Distribution
- Figure 88. Distributors Profiles
- Figure 89. Bottom-up and Top-down Approaches for This Report
- Figure 90. Data Triangulation
- Figure 91. Key Executives Interviewed
The global In-Vitro Diagnostics (IVDs) Medical Device market size was US$ 105138 million in 2022 and is forecast to a readjusted size of US$ 130116 million by 2029 with a CAGR of 5.01% during the forecast period 2023-2029.
The United States market for In-Vitro Diagnostics (IVDs) Medical Device is estimated to increase from $ 38860 million in 2023 to reach $ 47942 million by 2029, at a CAGR of 3.56% during the forecast period of 2023 through 2029.
The China market for In-Vitro Diagnostics (IVDs) Medical Device is estimated to increase from $ 15085 million in 2023 to reach $ 25569 million by 2029, at a CAGR of 9.19% during the forecast period of 2023 through 2029.
The Europe market for In-Vitro Diagnostics (IVDs) Medical Device is estimated to increase from $ 19124 million in 2023 to reach $ 22870 million by 2029, at a CAGR of 3.03% during the forecast period of 2023 through 2029.
The global key manufacturers of In-Vitro Diagnostics (IVDs) Medical Device include Roche, Abbott, Danaher, Siemens Healthineers, Thermo Fisher Scientific, Becton Dickinson, BioMerieux, Sysmex, Hologic, etc. In 2022, the global top five players hold a share approximately 57.94% in sales volume, and in term of revenue of In-Vitro Diagnostics (IVDs) Medical Device, the top five companies hold a share nearly 54.93%.
In terms of sales (consumption) side, this report focuses on the sales of In-Vitro Diagnostics (IVDs) Medical Device by regions (Countries), company, by Type and by Application. from 2018 to 2023 and forecast to 2029.
The global In-Vitro Diagnostics (IVDs) Medical Device market is thoroughly, accurately, and comprehensively assessed in the report with a large focus on market dynamics, market competition, regional growth, segmental analysis, and key growth strategies. Buyers of the report will have access to verified market figures, including global market size in terms of revenue and volume. As part of sales analysis, the authors of the report have provided reliable estimations and calculations for global revenue and sales by Type segment of the global In-Vitro Diagnostics (IVDs) Medical Device market. These figures have been provided in terms of both revenue and sales for the period 2018-2029. Additionally, the report provides accurate figures for sales by region in terms of revenue as well as volume for the same period.
By Company
- Roche
- Abbott
- Danaher
- Siemens Healthineers
- Thermo Fisher Scientific
- Sysmex
- BioMerieux
- Ortho Clinical Diagnostics
- Becton Dickinson
- Bio-Rad Laboratories
- Hologic
- LifeScan
- Qiagen
- Wuhan Easy Diagnosis
- Wondfo
- KHB
- Hotgen
- Mindray
- Sinocare
- Getein Biotech
Segment by Type
- Consumables
- Instrument
Segment by Application
- Hospital
- Laboratory
- Household
- Others
Sales by Region
- North America
- United States
- Canada
- China
- APAC (Ex. China)
- Japan
- South Korea
- Australia
- Southeast Asia
- India
- Europe
- Germany
- France
- U.K.
- Italy
- Russia
- Middle East & Africa, Latin America
- Brazil
- Mexico
- Middle East
- Africa
Chapter Outline:
- Chapter 1: Introduces the report scope of the report, executive summary of different market segments (by Type and by Application, etc), including the market size of each market segment, future development potential, and so on. It offers a high-level view of the current state of the market and its likely evolution in the short to mid-term, and long term.
- Chapter 2: Sales (consumption), revenue of In-Vitro Diagnostics (IVDs) Medical Device in global, regional level and country level. It provides a quantitative analysis of the market size and development potential of each region and its main countries and introduces the market development, future development prospects, market space of each country in the world.
- Chapter 3: Detailed analysis of In-Vitro Diagnostics (IVDs) Medical Device manufacturers competitive landscape, price, sales, revenue, market share and industry ranking, latest development plan, merger, and acquisition information, etc.
- Chapter 4: Provides the analysis of various market segments by Type, covering the sales, revenue, average price, and development potential of each market segment, to help readers find the blue ocean market in different market segments.
- Chapter 5: Provides the analysis of various market segments by Application, covering the sales, revenue, average price, and development potential of each market segment, to help readers find the blue ocean market in different downstream markets.
- Chapter 6: North America by company, by Type, by Application and by country, sales, and revenue for each segment.
- Chapter 7: Europe by company, by Type, by Application and by country, sales, and revenue for each segment.
- Chapter 8: China by company, by Type, and by Application, sales, and revenue for each segment.
- Chapter 9: APAC (Ex. China) by company, by Type, by Application and by country, sales, and revenue for each segment.
- Chapter 10: Middle East, Africa, and Latin America by company, by Type, by Application and by country, sales, and revenue for each segment.
- Chapter 11: Provides profiles of key manufacturers, introducing the basic situation of the main companies in the market in detail, including product descriptions and specifications, In-Vitro Diagnostics (IVDs) Medical Device sales, revenue, price, gross margin, and recent development, etc.
- Chapter 12: Analysis of industrial chain, sales channel, key raw materials, distributors, and customers.
- Chapter 13: Introduces the market dynamics, latest developments of the market, the driving factors and restrictive factors of the market, the challenges and risks faced by manufacturers in the industry, and the analysis of relevant policies in the industry.
- Chapter 14: The main points and conclusions of the report.
Table of Contents
1 Report Overview
- 1.1 In-Vitro Diagnostics (IVDs) Medical Device Definition
- 1.2 Market by Type
- 1.2.1 Global In-Vitro Diagnostics (IVDs) Medical Device Market Size Growth Rate by Type, 2018 VS 2022 VS 2029
- 1.2.2 Consumables
- 1.2.3 Instrument
- 1.3 Market by Application
- 1.3.1 Global In-Vitro Diagnostics (IVDs) Medical Device Market Size Growth Rate by Application, 2018 VS 2022 VS 2029
- 1.3.2 Hospital
- 1.3.3 Laboratory
- 1.3.4 Household
- 1.4 Assumptions and Limitations
- 1.5 Study Objectives
- 1.6 Years Considered
2 Global In-Vitro Diagnostics (IVDs) Medical Device Sales
- 2.1 Global In-Vitro Diagnostics (IVDs) Medical Device Revenue Estimates and Forecasts 2018-2029
- 2.2 Global In-Vitro Diagnostics (IVDs) Medical Device Revenue by Region: 2018 VS 2022 VS 2029
- 2.3 Global In-Vitro Diagnostics (IVDs) Medical Device Revenue by Region
- 2.3.1 Global In-Vitro Diagnostics (IVDs) Medical Device Revenue by Region (2018-2023)
- 2.3.2 Global In-Vitro Diagnostics (IVDs) Medical Device Revenue by Region (2024-2029)
- 2.4 Global In-Vitro Diagnostics (IVDs) Medical Device Sales Quantity Estimates and Forecasts 2018-2029
- 2.5 Global In-Vitro Diagnostics (IVDs) Medical Device Sales Quantity by Region: 2018 VS 2022 VS 2029
- 2.6 Global In-Vitro Diagnostics (IVDs) Medical Device Sales Quantity by Region
- 2.6.1 Global In-Vitro Diagnostics (IVDs) Medical Device Sales Quantity by Region (2018-2023)
- 2.6.2 Global In-Vitro Diagnostics (IVDs) Medical Device Sales Quantity by Region (2024-2029)
- 2.7 North America
- 2.8 Europe
- 2.9 China
- 2.10 APAC (Ex. China)
- 2.11 Middle East, Africa and Latin America
3 Competition by Manufacturers
- 3.1 Global In-Vitro Diagnostics (IVDs) Medical Device Sales Quantity by Manufacturers
- 3.1.1 Global In-Vitro Diagnostics (IVDs) Medical Device Sales Quantity by Manufacturers (2018-2023)
- 3.1.2 Global In-Vitro Diagnostics (IVDs) Medical Device Sales Quantity Share by Manufacturers (2018-2023)
- 3.1.3 Global Top Companies by In-Vitro Diagnostics (IVDs) Medical Device Sales in 2022
- 3.2 Global In-Vitro Diagnostics (IVDs) Medical Device Revenue by Manufacturers
- 3.2.1 Global In-Vitro Diagnostics (IVDs) Medical Device Revenue by Manufacturers (2018-2023)
- 3.2.2 Global In-Vitro Diagnostics (IVDs) Medical Device Revenue Share by Manufacturers (2018-2023)
- 3.2.3 Global Top Companies by In-Vitro Diagnostics (IVDs) Medical Device Revenue in 2022
- 3.3 Global In-Vitro Diagnostics (IVDs) Medical Device Sales Price by Manufacturers
- 3.4 Global Key Players of In-Vitro Diagnostics (IVDs) Medical Device, Industry Ranking, 2021 VS 2022
- 3.5 Analysis of Competitive Landscape
- 3.5.1 Manufacturers Market Concentration Ratio (CR5 and HHI)
- 3.5.2 Global In-Vitro Diagnostics (IVDs) Medical Device by Company Type (Tier 1, Tier 2, and Tier 3)
- 3.6 Global Key Manufacturers of In-Vitro Diagnostics (IVDs) Medical Device, Manufacturing Base Distribution and Headquarters
- 3.7 Global Key Manufacturers of In-Vitro Diagnostics (IVDs) Medical Device, Product Offered
- 3.8 Global Key Manufacturers of In-Vitro Diagnostics (IVDs) Medical Device, Founded Date
- 3.9 Mergers & Acquisitions, Expansion Plans
4 Estimates and Forecasts by Type
- 4.1 Global In-Vitro Diagnostics (IVDs) Medical Device Sales Quantity by Type
- 4.1.1 Global In-Vitro Diagnostics (IVDs) Medical Device Historical Sales Quantity by Type (2018-2023)
- 4.1.2 Global In-Vitro Diagnostics (IVDs) Medical Device Forecasted Sales Quantity by Type (2024-2029)
- 4.2 Global In-Vitro Diagnostics (IVDs) Medical Device Revenue by Type
- 4.2.1 Global In-Vitro Diagnostics (IVDs) Medical Device Historical Revenue by Type (2018-2023)
- 4.2.2 Global In-Vitro Diagnostics (IVDs) Medical Device Forecasted Revenue by Type (2024-2029)
- 4.2.3 Global In-Vitro Diagnostics (IVDs) Medical Device Revenue Market Share by Type (2018-2029)
- 4.3 Global In-Vitro Diagnostics (IVDs) Medical Device Price by Type
- 4.3.1 Global In-Vitro Diagnostics (IVDs) Medical Device Price by Type (2018-2023)
- 4.3.2 Global In-Vitro Diagnostics (IVDs) Medical Device Price Forecast by Type (2024-2029)
5 Market Size by Application
- 5.1 Global In-Vitro Diagnostics (IVDs) Medical Device Sales Quantity by Application
- 5.1.1 Global In-Vitro Diagnostics (IVDs) Medical Device Historical Sales Quantity by Application (2018-2023)
- 5.1.2 Global In-Vitro Diagnostics (IVDs) Medical Device Forecasted Sales Quantity by Application (2024-2029)
- 5.1.3 Global In-Vitro Diagnostics (IVDs) Medical Device Sales Quantity Market Share by Application (2018-2029)
- 5.2 Global In-Vitro Diagnostics (IVDs) Medical Device Revenue by Application
- 5.2.1 Global In-Vitro Diagnostics (IVDs) Medical Device Historical Revenue by Application (2018-2023)
- 5.2.2 Global In-Vitro Diagnostics (IVDs) Medical Device Forecasted Revenue by Application (2024-2029)
- 5.2.3 Global In-Vitro Diagnostics (IVDs) Medical Device Revenue Market Share by Application (2018-2029)
- 5.3 Global In-Vitro Diagnostics (IVDs) Medical Device Price by Application
- 5.3.1 Global In-Vitro Diagnostics (IVDs) Medical Device Price by Application (2018-2023)
- 5.3.2 Global In-Vitro Diagnostics (IVDs) Medical Device Price Forecast by Application (2024-2029)
6 North America
- 6.1 North America In-Vitro Diagnostics (IVDs) Medical Device Sales by Company
- 6.1.1 North America In-Vitro Diagnostics (IVDs) Medical Device Sales Quantity by Company (2018-2023)
- 6.1.2 North America In-Vitro Diagnostics (IVDs) Medical Device Revenue by Company (2018-2023)
- 6.2 North America In-Vitro Diagnostics (IVDs) Medical Device Market Size by Type
- 6.2.1 North America In-Vitro Diagnostics (IVDs) Medical Device Sales Quantity by Type (2018-2029)
- 6.2.2 North America In-Vitro Diagnostics (IVDs) Medical Device Revenue by Type (2018-2029)
- 6.3 North America In-Vitro Diagnostics (IVDs) Medical Device Market Size by Application
- 6.3.1 North America In-Vitro Diagnostics (IVDs) Medical Device Sales Quantity by Application (2018-2029)
- 6.3.2 North America In-Vitro Diagnostics (IVDs) Medical Device Revenue by Application (2018-2029)
- 6.4 North America In-Vitro Diagnostics (IVDs) Medical Device Market Size by Country
- 6.4.1 North America In-Vitro Diagnostics (IVDs) Medical Device Revenue by Country: 2018 VS 2022 VS 2029
- 6.4.2 North America In-Vitro Diagnostics (IVDs) Medical Device Revenue by Country (2018-2029)
- 6.4.3 North America In-Vitro Diagnostics (IVDs) Medical Device Sales Quantity by Country (2018-2029)
- 6.4.4 United States
- 6.4.5 Canada
7 Europe
- 7.1 Europe In-Vitro Diagnostics (IVDs) Medical Device Sales by Company
- 7.1.1 Europe In-Vitro Diagnostics (IVDs) Medical Device Sales Quantity by Company (2018-2023)
- 7.1.2 Europe In-Vitro Diagnostics (IVDs) Medical Device Revenue by Company (2018-2023)
- 7.2 Europe In-Vitro Diagnostics (IVDs) Medical Device Market Size by Type
- 7.2.1 Europe In-Vitro Diagnostics (IVDs) Medical Device Sales by Type (2018-2029)
- 7.2.2 Europe In-Vitro Diagnostics (IVDs) Medical Device Revenue by Type (2018-2029)
- 7.3 Europe In-Vitro Diagnostics (IVDs) Medical Device Market Size by Application
- 7.3.1 Europe In-Vitro Diagnostics (IVDs) Medical Device Sales Quantity by Application (2018-2029)
- 7.3.2 Europe In-Vitro Diagnostics (IVDs) Medical Device Revenue by Application (2018-2029)
- 7.4 Europe In-Vitro Diagnostics (IVDs) Medical Device Market Size by Country
- 7.4.1 Europe In-Vitro Diagnostics (IVDs) Medical Device Revenue by Country: 2018 VS 2022 VS 2029
- 7.4.2 Europe In-Vitro Diagnostics (IVDs) Medical Device Revenue by Country (2018-2029)
- 7.4.3 Europe In-Vitro Diagnostics (IVDs) Medical Device Sales Quantity by Country (2018-2029)
- 7.4.4 Germany
- 7.4.5 France
- 7.4.6 U.K.
- 7.4.7 Italy
- 7.4.8 Russia
8 China
- 8.1 China In-Vitro Diagnostics (IVDs) Medical Device Sales by Company
- 8.1.1 China In-Vitro Diagnostics (IVDs) Medical Device Sales Quantity by Company (2018-2023)
- 8.1.2 China In-Vitro Diagnostics (IVDs) Medical Device Revenue by Company (2018-2023)
- 8.2 China In-Vitro Diagnostics (IVDs) Medical Device Market Size by Type
- 8.2.1 China In-Vitro Diagnostics (IVDs) Medical Device Sales by Type (2018-2029)
- 8.2.2 China In-Vitro Diagnostics (IVDs) Medical Device Revenue by Type (2018-2029)
- 8.3 China In-Vitro Diagnostics (IVDs) Medical Device Market Size by Application
- 8.3.1 China In-Vitro Diagnostics (IVDs) Medical Device Sales by Application (2018-2029)
- 8.3.2 China In-Vitro Diagnostics (IVDs) Medical Device Revenue by Application (2018-2029)
9 APAC (Ex. China)
- 9.1 APAC In-Vitro Diagnostics (IVDs) Medical Device Sales by Company
- 9.1.1 APAC In-Vitro Diagnostics (IVDs) Medical Device Sales Quantity by Company (2018-2023)
- 9.1.2 APAC In-Vitro Diagnostics (IVDs) Medical Device Revenue by Company (2018-2023)
- 9.2 APAC In-Vitro Diagnostics (IVDs) Medical Device Market Size by Type
- 9.2.1 APAC In-Vitro Diagnostics (IVDs) Medical Device Sales by Type (2018-2029)
- 9.2.2 APAC In-Vitro Diagnostics (IVDs) Medical Device Revenue by Type (2018-2029)
- 9.3 APAC In-Vitro Diagnostics (IVDs) Medical Device Market Size by Application
- 9.3.1 APAC In-Vitro Diagnostics (IVDs) Medical Device Sales by Application (2018-2029)
- 9.3.2 APAC In-Vitro Diagnostics (IVDs) Medical Device Revenue by Application (2018-2029)
- 9.4 APAC In-Vitro Diagnostics (IVDs) Medical Device Market Size by Region
- 9.4.1 APAC In-Vitro Diagnostics (IVDs) Medical Device Revenue by Region: 2018 VS 2022 VS 2029
- 9.4.2 APAC In-Vitro Diagnostics (IVDs) Medical Device Revenue by Region (2018-2029)
- 9.4.3 APAC In-Vitro Diagnostics (IVDs) Medical Device Sales Quantity by Region (2018-2029)
- 9.4.4 Japan
- 9.4.5 South Korea
- 9.4.6 India
- 9.4.7 Southeast Asia
- 9.4.8 Australia
10 Middle East, Africa and Latin America
- 10.1 Middle East, Africa and Latin America In-Vitro Diagnostics (IVDs) Medical Device Sales by Company
- 10.1.1 Middle East, Africa and Latin America In-Vitro Diagnostics (IVDs) Medical Device Sales Quantity by Company (2018-2023)
- 10.1.2 Middle East, Africa and Latin America In-Vitro Diagnostics (IVDs) Medical Device Revenue by Company (2018-2023)
- 10.2 Middle East, Africa and Latin America In-Vitro Diagnostics (IVDs) Medical Device Market Size by Type
- 10.2.1 Middle East, Africa and Latin America In-Vitro Diagnostics (IVDs) Medical Device Sales Quantity by Type (2018-2029)
- 10.2.2 Middle East, Africa and Latin America In-Vitro Diagnostics (IVDs) Medical Device Revenue by Type (2018-2029)
- 10.3 Middle East, Africa and Latin America In-Vitro Diagnostics (IVDs) Medical Device Market Size by Application
- 10.3.1 Middle East, Africa and Latin America In-Vitro Diagnostics (IVDs) Medical Device Sales Quantity by Application (2018-2029)
- 10.3.2 Middle East, Africa and Latin America In-Vitro Diagnostics (IVDs) Medical Device Revenue by Application (2018-2029)
- 10.4 Middle East, Africa and Latin America In-Vitro Diagnostics (IVDs) Medical Device Market Size by Country
- 10.4.1 Middle East, Africa and Latin America In-Vitro Diagnostics (IVDs) Medical Device Revenue by Country: 2018 VS 2022 VS 2029
- 10.4.2 Middle East, Africa and Latin America In-Vitro Diagnostics (IVDs) Medical Device Revenue by Country (2018-2029)
- 10.4.3 Middle East, Africa and Latin America In-Vitro Diagnostics (IVDs) Medical Device Sales Quantity by Country (2018-2029)
- 10.4.4 Mexico
- 10.4.5 Brazil
- 10.4.6 Middle East
- 10.4.7 Africa
11 Company Profiles
- 11.1 Roche
- 11.1.1 Roche Company Information
- 11.1.2 Roche Overview
- 11.1.3 Roche In-Vitro Diagnostics (IVDs) Medical Device Sales Quantity, Revenue, Price and Gross Margin (2018-2023)
- 11.1.4 Roche In-Vitro Diagnostics (IVDs) Medical Device Products and Services
- 11.1.5 Roche Recent Developments
- 11.2 Abbott
- 11.2.1 Abbott Company Information
- 11.2.2 Abbott Overview
- 11.2.3 Abbott In-Vitro Diagnostics (IVDs) Medical Device Sales Quantity, Revenue, Price and Gross Margin (2018-2023)
- 11.2.4 Abbott In-Vitro Diagnostics (IVDs) Medical Device Products and Services
- 11.2.5 Abbott Recent Developments
- 11.3 Danaher
- 11.3.1 Danaher Company Information
- 11.3.2 Danaher Overview
- 11.3.3 Danaher In-Vitro Diagnostics (IVDs) Medical Device Sales Quantity, Revenue, Price and Gross Margin (2018-2023)
- 11.3.4 Danaher In-Vitro Diagnostics (IVDs) Medical Device Products and Services
- 11.3.5 Danaher Recent Developments
- 11.4 Siemens Healthineers
- 11.4.1 Siemens Healthineers Company Information
- 11.4.2 Siemens Healthineers Overview
- 11.4.3 Siemens Healthineers In-Vitro Diagnostics (IVDs) Medical Device Sales Quantity, Revenue, Price and Gross Margin (2018-2023)
- 11.4.4 Siemens Healthineers In-Vitro Diagnostics (IVDs) Medical Device Products and Services
- 11.4.5 Siemens Healthineers Recent Developments
- 11.5 Thermo Fisher Scientific
- 11.5.1 Thermo Fisher Scientific Company Information
- 11.5.2 Thermo Fisher Scientific Overview
- 11.5.3 Thermo Fisher Scientific In-Vitro Diagnostics (IVDs) Medical Device Sales Quantity, Revenue, Price and Gross Margin (2018-2023)
- 11.5.4 Thermo Fisher Scientific In-Vitro Diagnostics (IVDs) Medical Device Products and Services
- 11.5.5 Thermo Fisher Scientific Recent Developments
- 11.6 Sysmex
- 11.6.1 Sysmex Company Information
- 11.6.2 Sysmex Overview
- 11.6.3 Sysmex In-Vitro Diagnostics (IVDs) Medical Device Sales Quantity, Revenue, Price and Gross Margin (2018-2023)
- 11.6.4 Sysmex In-Vitro Diagnostics (IVDs) Medical Device Products and Services
- 11.7 BioMerieux
- 11.7.1 BioMerieux Company Information
- 11.7.2 BioMerieux Overview
- 11.7.3 BioMerieux In-Vitro Diagnostics (IVDs) Medical Device Sales Quantity, Revenue, Price and Gross Margin (2018-2023)
- 11.7.4 BioMerieux In-Vitro Diagnostics (IVDs) Medical Device Products and Services
- 11.8 Ortho Clinical Diagnostics
- 11.8.1 Ortho Clinical Diagnostics Company Information
- 11.8.2 Ortho Clinical Diagnostics Overview
- 11.8.3 Ortho Clinical Diagnostics In-Vitro Diagnostics (IVDs) Medical Device Sales Quantity, Revenue, Price and Gross Margin (2018-2023)
- 11.8.4 Ortho Clinical Diagnostics In-Vitro Diagnostics (IVDs) Medical Device Products and Services
- 11.8.5 Ortho Clinical Diagnostics Recent Developments
- 11.9 Becton, Dickinson
- 11.9.1 Becton, Dickinson Company Information
- 11.9.2 Becton, Dickinson Overview
- 11.9.3 Becton, Dickinson In-Vitro Diagnostics (IVDs) Medical Device Sales Quantity, Revenue, Price and Gross Margin (2018-2023)
- 11.9.4 Becton, Dickinson In-Vitro Diagnostics (IVDs) Medical Device Products and Services
- 11.9.5 Becton, Dickinson Recent Developments
- 11.10 Bio-Rad Laboratories
- 11.10.1 Bio-Rad Laboratories Company Information
- 11.10.2 Bio-Rad Laboratories Overview
- 11.10.3 Bio-Rad Laboratories In-Vitro Diagnostics (IVDs) Medical Device Sales Quantity, Revenue, Price and Gross Margin (2018-2023)
- 11.10.4 Bio-Rad Laboratories In-Vitro Diagnostics (IVDs) Medical Device Products and Services
- 11.11 Hologic
- 11.11.1 Hologic Company Information
- 11.11.2 Hologic Overview
- 11.11.3 Hologic In-Vitro Diagnostics (IVDs) Medical Device Sales Quantity, Revenue, Price and Gross Margin (2018-2023)
- 11.11.4 Hologic In-Vitro Diagnostics (IVDs) Medical Device Products and Services
- 11.11.5 Hologic Recent Developments
- 11.12 LifeScan
- 11.12.1 LifeScan Company Information
- 11.12.2 LifeScan Overview
- 11.12.3 LifeScan In-Vitro Diagnostics (IVDs) Medical Device Sales Quantity, Revenue, Price and Gross Margin (2018-2023)
- 11.12.4 LifeScan In-Vitro Diagnostics (IVDs) Medical Device Products and Services
- 11.12.5 LifeScan Recent Developments
- 11.13 Qiagen
- 11.13.1 Qiagen Company Information
- 11.13.2 Qiagen Overview
- 11.13.3 Qiagen In-Vitro Diagnostics (IVDs) Medical Device Sales Quantity, Revenue, Price and Gross Margin (2018-2023)
- 11.13.4 Qiagen In-Vitro Diagnostics (IVDs) Medical Device Products and Services
- 11.14 Wuhan Easy Diagnosis
- 11.14.1 Wuhan Easy Diagnosis Company Information
- 11.14.2 Wuhan Easy Diagnosis Overview
- 11.14.3 Wuhan Easy Diagnosis In-Vitro Diagnostics (IVDs) Medical Device Sales Quantity, Revenue, Price and Gross Margin (2018-2023)
- 11.14.4 Wuhan Easy Diagnosis In-Vitro Diagnostics (IVDs) Medical Device Products and Services
- 11.15 Wondfo
- 11.15.1 Wondfo Company Information
- 11.15.2 Wondfo Overview
- 11.15.3 Wondfo In-Vitro Diagnostics (IVDs) Medical Device Sales Quantity, Revenue, Price and Gross Margin (2018-2023)
- 11.15.4 Wondfo In-Vitro Diagnostics (IVDs) Medical Device Products and Services
- 11.16 KHB
- 11.16.1 KHB Company Information
- 11.16.2 KHB Overview
- 11.16.3 KHB In-Vitro Diagnostics (IVDs) Medical Device Sales Quantity, Revenue, Price and Gross Margin (2018-2023)
- 11.16.4 KHB In-Vitro Diagnostics (IVDs) Medical Device Products and Services
- 11.17 Hotgen
- 11.17.1 Hotgen Company Information
- 11.17.2 Hotgen Overview
- 11.17.3 Hotgen In-Vitro Diagnostics (IVDs) Medical Device Sales Quantity, Revenue, Price and Gross Margin (2018-2023)
- 11.17.4 Hotgen In-Vitro Diagnostics (IVDs) Medical Device Products and Services
- 11.18 Mindray
- 11.18.1 Mindray Company Information
- 11.18.2 Mindray Overview
- 11.18.3 Mindray In-Vitro Diagnostics (IVDs) Medical Device Sales Quantity, Revenue, Price and Gross Margin (2018-2023)
- 11.18.4 Mindray In-Vitro Diagnostics (IVDs) Medical Device Products and Services
- 11.19 Sinocare
- 11.19.1 Sinocare Company Information
- 11.19.2 Sinocare Overview
- 11.19.3 Sinocare In-Vitro Diagnostics (IVDs) Medical Device Sales Quantity, Revenue, Price and Gross Margin (2018-2023)
- 11.19.4 Sinocare In-Vitro Diagnostics (IVDs) Medical Device Products and Services
- 11.20 Getein Biotech
- 11.20.1 Getein Biotech Company Information
- 11.20.2 Getein Biotech Overview
- 11.20.3 Getein Biotech In-Vitro Diagnostics (IVDs) Medical Device Sales Quantity, Revenue, Price and Gross Margin (2018-2023)
- 11.20.4 Getein Biotech In-Vitro Diagnostics (IVDs) Medical Device Products and Services
12 Value Chain and Sales Channels Analysis
- 12.1 In-Vitro Diagnostics (IVDs) Medical Device Value Chain Analysis
- 12.2 In-Vitro Diagnostics (IVDs) Medical Device Key Raw Materials
- 12.2.1 Key Raw Materials
- 12.2.2 Raw Materials Key Suppliers
- 12.3 In-Vitro Diagnostics (IVDs) Medical Device Production Mode & Process
- 12.4 In-Vitro Diagnostics (IVDs) Medical Device Sales and Marketing
- 12.4.1 In-Vitro Diagnostics (IVDs) Medical Device Sales Channels
- 12.4.2 In-Vitro Diagnostics (IVDs) Medical Device Distributors
- 12.5 In-Vitro Diagnostics (IVDs) Medical Device Customers
13 In-Vitro Diagnostics (IVDs) Medical Device Market Dynamics
- 13.1 In-Vitro Diagnostics (IVDs) Medical Device Industry Trends
- 13.2 In-Vitro Diagnostics (IVDs) Medical Device Market Drivers
- 13.3 In-Vitro Diagnostics (IVDs) Medical Device Market Challenges
- 13.4 In-Vitro Diagnostics (IVDs) Medical Device Market Restraints
14 Key Findings
15 Appendix
- 15.1 Research Methodology
- 15.1.1 Methodology/Research Approach
- 15.1.2 Data Source
- 15.2 Author Details
- 15.3 Disclaimer