|
|
市場調査レポート
商品コード
1206525
産業用ラベルの世界市場:考察と予測 (2028年まで)Global Industrial Labels Market Insights, Forecast to 2028 |
||||||
|
|
|||||||
|
● お客様のご希望に応じて、既存データの加工や未掲載情報(例:国別セグメント)の追加などの対応が可能です。 詳細はお問い合わせください。 |
|||||||


| 産業用ラベルの世界市場:考察と予測 (2028年まで) |
|
出版日: 2023年01月31日
発行: QYResearch
ページ情報: 英文 166 Pages
納期: 2~3営業日
|
- 全表示
- 概要
- 図表
- 目次
世界の産業用ラベルの市場規模は、COVID-19の大流行により、2022年に423億3,000万米ドル、2028年までに590億5,000万米ドルの再調整サイズに達し、予測期間中 (2022年~2028年) に5.70%のCAGRで成長すると予測されています。
この健康危機による経済変化を十分に考慮し、2021年に世界市場の23.92%を占めた警告/セキュリティラベルは、2028年までに157億3,000万米ドルの規模を占め、2022年から2028年までの間に改訂7.24%のCAGRで成長すると予測されます。輸送・物流分野は、この予測期間を通して5.87%のCAGRに変更されています。
2021年に、中国の産業用ラベルの市場規模は45億米ドル、米国は135億米ドル、欧州は1,233万米ドルでした。2021年の米国の割合は35.14%、中国と欧州はそれぞれ11.71%と32.09%であり、中国の割合は2028年には16.41%に達し、分析期間を通じて11.20%のCAGRをたどると予測されています。アジアではインド、韓国、東南アジアが注目すべき市場であり、今後6年間のCAGRはそれぞれ9.89%、4.12%、8.78%となっています。欧州の産業用ラベル市場では、ドイツが2028年までに49億3,000万米ドルの規模に達すると予測され、予測期間中のCAGRは5.83%となっています。
当レポートでは、世界の産業用ラベルの市場について分析し、種類別・用途別・地域別 (国別) の市場動向の見通し (2017年~2028年)、主要企業のプロファイルなどについて調査しております。
目次
第1章 調査範囲
- 産業用ラベル:製品概略
- 種類別の市場
- 市場規模・成長率:種類別 (2017年・2021年・2028年)
- 警告/セキュリティラベル
- ブランディングラベル
- 耐候性ラベル
- 設備資産ラベル
- 用途別の市場
- 市場規模・成長率:用途別 (2017年・2021年・2028年)
- 運輸・物流
- 自動車産業
- 電子産業
- 耐久消費財
- 分析対象
- 分析期間
第2章 世界の産業用ラベルの生産
- 世界の産業用ラベルの生産能力 (2017年~2028年)
- 世界の産業用ラベルの生産:地域別 (2017年・2021年・2028年)
- 世界の産業用ラベルの生産:地域別
- 過去の生産:地域別 (2017年~2022年)
- 生産の予測:地域別 (2023年~2028年)
- 北米
- 欧州
- 中国
- 日本
第3章 世界の産業用ラベルの販売量・販売額:推定・予測
- 世界の産業用ラベルの販売:推定・予測 (2017年~2028年)
- 世界の産業用ラベルの収益:推定・予測 (2017年~2028年)
- 世界の産業用ラベルの収益:地域別 (2017年・2021年・2028年)
- 主要地域の産業用ラベルの販売
- 主要地域の産業用ラベルの収益
- 北米
- 欧州
- アジア太平洋
- ラテンアメリカ
- 中東・アフリカ
第4章 メーカー別の競合
- 世界の産業用ラベルの生産能力:メーカー別
- 世界の産業用ラベルの販売:メーカー別
- 世界の産業用ラベルの収益:メーカー別
- 世界の産業用ラベルの販売価格:メーカー別 (2017年~2022年)
- 競合情勢の分析
- 企業合併・買収 (M&A)、拡張計画
第5章 種類別の市場規模
- 世界の産業用ラベルの販売:種類別
- 世界の産業用ラベルの収益:種類別
- 世界の産業用ラベルの価格:種類別
第6章 用途別の市場規模
- 世界の産業用ラベルの販売:用途別
- 世界の産業用ラベルの収益:用途別
- 世界の産業用ラベルの価格:用途別
第7章 北米
- 産業用ラベルの市場規模:種類別
- 産業用ラベルの市場規模:用途別
- 産業用ラベルの販売:国別
- 米国
- カナダ
第8章 欧州
- 産業用ラベルの市場規模:種類別
- 産業用ラベルの市場規模:用途別
- 産業用ラベルの市場規模:国別
- ドイツ
- 英国
- フランス
- ロシア
- イタリア
第9章 アジア太平洋
- 産業用ラベルの市場規模:種類別
- 産業用ラベルの市場規模:用途別
- 産業用ラベルの市場規模:地域別
- 中国
- 日本
- 韓国
- オーストラリア
- インド
- 東南アジア
- 台湾
第10章 ラテンアメリカ
- 産業用ラベルの市場規模:種類別
- 産業用ラベルの市場規模:用途別
- 産業用ラベルの市場規模:国別
- メキシコ
- ブラジル
第11章 中東・アフリカ
- 産業用ラベルの市場規模:種類別
- 産業用ラベルの市場規模:用途別
- 産業用ラベルの市場規模:国別
- 湾岸協力会議 (GCC) 諸国
- トルコ
- アフリカ
第12章 企業プロファイル
- 3M
- Avery Dennison
- Brady
- CCL Industries
- UPM Raflatac
- CILS International
- NFI Corp
- Tesa SE
- Nitto
- HERMA
- Cymmetrik
- Weber Packaging Solutions
- ImageTek Labels
- Resource Label
- SATO
第13章 産業チェーンと販売チャネルの分析
- 産業用ラベルの産業チェーンの分析
- 産業用ラベルの主要原材料
- 産業用ラベルの製造モードとプロセス
- 産業用ラベルの販売とマーケティング
- 産業用ラベルの顧客
第14章 産業用ラベルの市場力学
- 産業用ラベル業界の動向
- 産業用ラベル市場の促進要因
- 産業用ラベル市場の課題
- 産業用ラベル市場の抑制要因
第15章 世界の産業用ラベル市場:主な調査結果
第16章 付録
List of Tables
- Table 1. Global Industrial Labels Market Size Growth Rate by Type, 2017 VS 2021 VS 2028 (US$ Million)
- Table 2. Global Industrial Labels Market Size Growth Rate by Application, 2017 VS 2021 VS 2028 (US$ Million)
- Table 3. Global Industrial Labels Production by Region: 2017 VS 2021 VS 2028 (M Sq.m)
- Table 4. Global Industrial Labels Production by Region (2017-2022) & (M Sq.m)
- Table 5. Global Industrial Labels Production Market Share by Region (2017-2022)
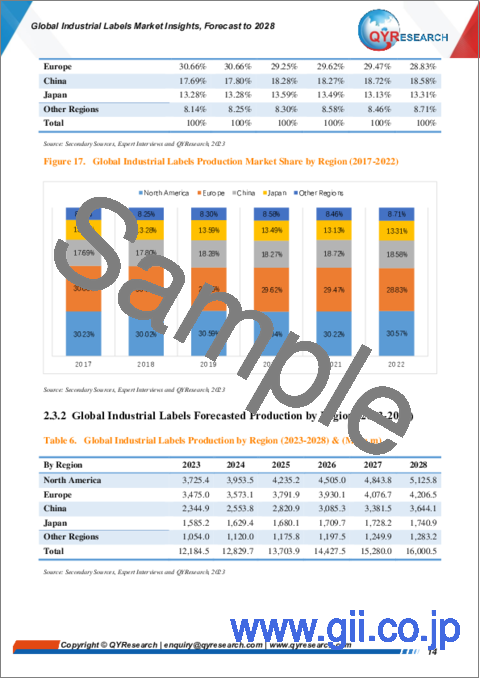
- Table 6. Global Industrial Labels Production by Region (2023-2028) & (M Sq.m)
- Table 7. Global Industrial Labels Production Market Share by Region (2023-2028)
- Table 8. Global Industrial Labels Revenue by Region: 2017 VS 2021 VS 2028 (US$ Million)
- Table 9. Global Industrial Labels Sales by Region (2017-2022) & (M Sq.m)
- Table 10. Global Industrial Labels Sales Market Share by Region (2017-2022)
- Table 11. Global Industrial Labels Sales by Region (2023-2028) & (M Sq.m)
- Table 12. Global Industrial Labels Sales Market Share by Region (2023-2028)
- Table 13. Global Industrial Labels Revenue by Region (2017-2022) & (US$ Million)
- Table 14. Global Industrial Labels Revenue Market Share by Region (2017-2022)
- Table 15. Global Industrial Labels Revenue by Region (2023-2028) & (US$ Million)
- Table 16. Global Industrial Labels Revenue Market Share by Region (2023-2028)
- Table 17. Global Industrial Labels Production Capacity by Manufacturers (2017-2022) & (M Sq.m)
- Table 18. Global Industrial Labels Capacity Market Share by Manufacturers (2017-2022)
- Table 19. Global Industrial Labels Sales by Manufacturers (2017-2022) & (M Sq.m)
- Table 20. Global Industrial Labels Sales Share by Manufacturers (2017-2022)
- Table 21. Global Industrial Labels Revenue by Manufacturers (2017-2022) & (US$ Million)
- Table 22. Global Industrial Labels Revenue Market Share by Manufacturers (2017-2022)
- Table 23. Industrial Labels Price by Manufacturers (2017-2022) & (US$/K Sq.m)
- Table 24. Global Industrial Labels Manufacturers Market Concentration Ratio (CR5 and HHI)
- Table 25. Global Industrial Labels by Company Type (Tier 1, Tier 2, and Tier 3) & (based on the Revenue in Industrial Labels as of 2020)
- Table 26. Industrial Labels Manufacturing Base Distribution and Headquarters
- Table 27. Manufacturers Industrial Labels Product Offered
- Table 28. Mergers & Acquisitions, Expansion Plans
- Table 29. Global Industrial Labels Sales by Type (2017-2022) & (M Sq.m)
- Table 30. Global Industrial Labels Sales by Type (2023-2028) & (M Sq.m)
- Table 31. Global Industrial Labels Sales Share by Type (2017-2022)
- Table 32. Global Industrial Labels Sales Share by Type (2023-2028)
- Table 33. Global Industrial Labels Revenue by Type (2017-2022) & (US$ Million)
- Table 34. Global Industrial Labels Revenue by Type (2023-2028) & (US$ Million)
- Table 35. Global Industrial Labels Revenue Share by Type (2017-2022)
- Table 36. Global Industrial Labels Revenue Share by Type (2023-2028)
- Table 37. Industrial Labels Price by Type (2017-2022) & (US$/K Sq.m)
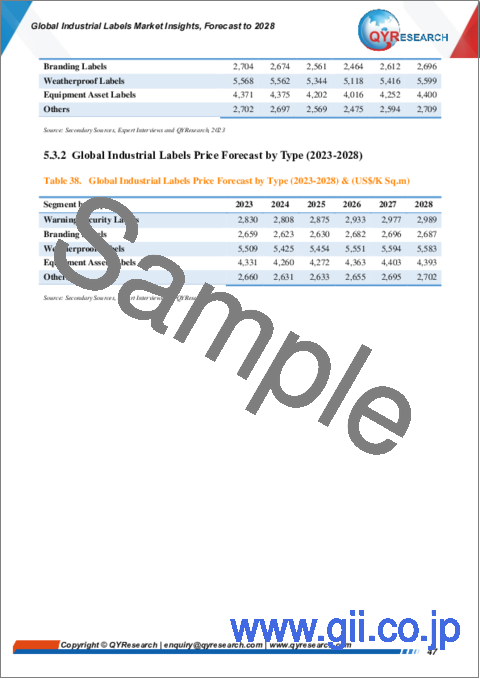
- Table 38. Global Industrial Labels Price Forecast by Type (2023-2028) & (US$/K Sq.m)
- Table 39. Global Industrial Labels Sales by Application (2017-2022) & (M Sq.m)
- Table 40. Global Industrial Labels Sales by Application (2023-2028) & (M Sq.m)
- Table 41. Global Industrial Labels Sales Share by Application (2017-2022)
- Table 42. Global Industrial Labels Sales Share by Application (2023-2028)
- Table 43. Global Industrial Labels Revenue by Application (2017-2022) & (US$ Million)
- Table 44. Global Industrial Labels Revenue by Application (2023-2028) & (US$ Million)
- Table 45. Global Industrial Labels Revenue Share by Application (2017-2022)
- Table 46. Global Industrial Labels Revenue Share by Application (2023-2028)
- Table 47. Industrial Labels Price by Application (2017-2022) & (US$/K Sq.m)
- Table 48. Global Industrial Labels Price Forecast by Application (2023-2028) & (US$/K Sq.m)
- Table 49. North America Industrial Labels Sales by Type (2017-2022) & (M Sq.m)
- Table 50. North America Industrial Labels Sales by Type (2023-2028) & (M Sq.m)
- Table 51. North America Industrial Labels Revenue by Type (2017-2022) & (US$ Million)
- Table 52. North America Industrial Labels Revenue by Type (2023-2028) & (US$ Million)
- Table 53. North America Industrial Labels Sales by Application (2017-2022) & (M Sq.m)
- Table 54. North America Industrial Labels Sales by Application (2023-2028) & (M Sq.m)
- Table 55. North America Industrial Labels Revenue by Application (2017-2022) & (US$ Million)
- Table 56. North America Industrial Labels Revenue by Application (2023-2028) & (US$ Million)
- Table 57. North America Industrial Labels Sales by Country (2017-2022) & (M Sq.m)
- Table 58. North America Industrial Labels Sales by Country (2023-2028) & (M Sq.m)
- Table 59. North America Industrial Labels Revenue by Country (2017-2022) & (US$ Million)
- Table 60. North America Industrial Labels Revenue by Country (2023-2028) & (US$ Million)
- Table 61. Europe Industrial Labels Sales by Type (2017-2022) & (M Sq.m)
- Table 62. Europe Industrial Labels Sales by Type (2023-2028) & (M Sq.m)
- Table 63. Europe Industrial Labels Revenue by Type (2017-2022) & (US$ Million)
- Table 64. Europe Industrial Labels Revenue by Type (2023-2028) & (US$ Million)
- Table 65. Europe Industrial Labels Sales by Application (2017-2022) & (M Sq.m)
- Table 66. Europe Industrial Labels Sales by Application (2023-2028) & (M Sq.m)
- Table 67. Europe Industrial Labels Revenue by Application (2017-2022) & (US$ Million)
- Table 68. Europe Industrial Labels Revenue by Application (2023-2028) & (US$ Million)
- Table 69. Europe Industrial Labels Sales by Country (2017-2022) & (M Sq.m)
- Table 70. Europe Industrial Labels Sales by Country (2023-2028) & (M Sq.m)
- Table 71. Europe Industrial Labels Revenue by Country (2017-2022) & (US$ Million)
- Table 72. Europe Industrial Labels Revenue by Country (2023-2028) & (US$ Million)
- Table 73. Asia Pacific Industrial Labels Sales by Type (2017-2022) & (M Sq.m)
- Table 74. Asia Pacific Industrial Labels Sales by Type (2023-2028) & (M Sq.m)
- Table 75. Asia Pacific Industrial Labels Revenue by Type (2017-2022) & (US$ Million)
- Table 76. Asia Pacific Industrial Labels Revenue by Type (2023-2028) & (US$ Million)
- Table 77. Asia Pacific Industrial Labels Sales by Application (2017-2022) & (M Sq.m)
- Table 78. Asia Pacific Industrial Labels Sales by Application (2023-2028) & (M Sq.m)
- Table 79. Asia Pacific Industrial Labels Revenue by Application (2017-2022) & (US$ Million)
- Table 80. Asia Pacific Industrial Labels Revenue by Application (2023-2028) & (US$ Million)
- Table 81. Asia Pacific Industrial Labels Sales by Region (2017-2022) & (M Sq.m)
- Table 82. Asia Pacific Industrial Labels Sales by Region (2023-2028) & (M Sq.m)
- Table 83. Asia Pacific Industrial Labels Revenue by Region (2017-2022) & (US$ Million)
- Table 84. Asia Pacific Industrial Labels Revenue by Region (2023-2028) & (US$ Million)
- Table 85. Latin America Industrial Labels Sales by Type (2017-2022) & (M Sq.m)
- Table 86. Latin America Industrial Labels Sales by Type (2023-2028) & (M Sq.m)
- Table 87. Latin America Industrial Labels Revenue by Type (2017-2022) & (US$ Million)
- Table 88. Latin America Industrial Labels Revenue by Type (2023-2028) & (US$ Million)
- Table 89. Latin America Industrial Labels Sales by Application (2017-2022) & (M Sq.m)
- Table 90. Latin America Industrial Labels Sales by Application (2023-2028) & (M Sq.m)
- Table 91. Latin America Industrial Labels Revenue by Application (2017-2022) & (US$ Million)
- Table 92. Latin America Industrial Labels Revenue by Application (2023-2028) & (US$ Million)
- Table 93. Latin America Industrial Labels Sales by Country (2017-2022) & (M Sq.m)
- Table 94. Latin America Industrial Labels Sales by Country (2023-2028) & (M Sq.m)
- Table 95. Latin America Industrial Labels Revenue by Country (2017-2022) & (US$ Million)
- Table 96. Latin America Industrial Labels Revenue by Country (2023-2028) & (US$ Million)
- Table 97. Middle East and Africa Industrial Labels Sales by Type (2017-2022) & (M Sq.m)
- Table 98. Middle East and Africa Industrial Labels Sales by Type (2023-2028) & (M Sq.m)
- Table 99. Middle East and Africa Industrial Labels Revenue by Type (2017-2022) & (US$ Million)
- Table 100. Middle East and Africa Industrial Labels Revenue by Type (2023-2028) & (US$ Million)
- Table 101. Middle East and Africa Industrial Labels Sales by Application (2017-2022) & (M Sq.m)
- Table 102. Middle East and Africa Industrial Labels Sales by Application (2023-2028) & (M Sq.m)
- Table 103. Middle East and Africa Industrial Labels Revenue by Application (2017-2022) & (US$ Million)
- Table 104. Middle East and Africa Industrial Labels Revenue by Application (2023-2028) & (US$ Million)
- Table 105. Middle East and Africa Industrial Labels Sales by Region (2017-2022) & (M Sq.m)
- Table 106. Middle East and Africa Industrial Labels Sales by Region (2023-2028) & (M Sq.m)
- Table 107. Middle East and Africa Industrial Labels Revenue by Region (2017-2022) & (US$ Million)
- Table 108. Middle East and Africa Industrial Labels Revenue by Region (2023-2028) & (US$ Million)
- Table 109. 3M Corporation Information
- Table 110. 3M Description and Major Businesses
- Table 111. 3M Industrial Labels Sales (M Sq.m), Revenue (US$ Million), Price (US$/K Sq.m) and Gross Margin (2017-2022)
- Table 112. 3M Industrial Labels Product Model Numbers, Pictures, Descriptions and Specifications
- Table 113. Avery Dennison Corporation Information
- Table 114. Avery Dennison Description and Major Businesses
- Table 115. Avery Dennison Industrial Labels Sales (M Sq.m), Revenue (US$ Million), Price (US$/K Sq.m) and Gross Margin (2017-2022)
- Table 116. Avery Dennison Industrial Labels Product Model Numbers, Pictures, Descriptions and Specifications
- Table 117. Brady Corporation Information
- Table 118. Brady Description and Major Businesses
- Table 119. Brady Industrial Labels Sales (M Sq.m), Revenue (US$ Million), Price (US$/K Sq.m) and Gross Margin (2017-2022)
- Table 120. Brady Industrial Labels Product Model Numbers, Pictures, Descriptions and Specifications
- Table 121. CCL Industries Corporation Information
- Table 122. CCL Industries Description and Major Businesses
- Table 123. CCL Industries Industrial Labels Sales (M Sq.m), Revenue (US$ Million), Price (US$/K Sq.m) and Gross Margin (2017-2022)
- Table 124. CCL Industries Industrial Labels Product Model Numbers, Pictures, Descriptions and Specifications
- Table 125. UPM Raflatac Corporation Information
- Table 126. UPM Raflatac Description and Major Businesses
- Table 127. UPM Raflatac Industrial Labels Sales (M Sq.m), Revenue (US$ Million), Price (US$/K Sq.m) and Gross Margin (2017-2022)
- Table 128. UPM Raflatac Industrial Labels Product Model Numbers, Pictures, Descriptions and Specifications
- Table 129. CILS International Corporation Information
- Table 130. CILS International Description and Major Businesses
- Table 131. CILS International Industrial Labels Sales (M Sq.m), Revenue (US$ Million), Price (US$/K Sq.m) and Gross Margin (2017-2022)
- Table 132. CILS International Industrial Labels Product Model Numbers, Pictures, Descriptions and Specifications
- Table 133. NFI Corp Corporation Information
- Table 134. NFI Corp Description and Major Businesses
- Table 135. NFI Corp Industrial Labels Sales (M Sq.m), Revenue (US$ Million), Price (US$/K Sq.m) and Gross Margin (2017-2022)
- Table 136. NFI Corp Industrial Labels Product Model Numbers, Pictures, Descriptions and Specifications
- Table 137. Tesa SE Corporation Information
- Table 138. Tesa SE Description and Major Businesses
- Table 139. Tesa SE Industrial Labels Sales (M Sq.m), Revenue (US$ Million), Price (US$/K Sq.m) and Gross Margin (2017-2022)
- Table 140. Tesa SE Industrial Labels Product Model Numbers, Pictures, Descriptions and Specifications
- Table 141. Nitto Corporation Information
- Table 142. Nitto Description and Major Businesses
- Table 143. Nitto Industrial Labels Sales (M Sq.m), Revenue (US$ Million), Price (US$/K Sq.m) and Gross Margin (2017-2022)
- Table 144. Nitto Industrial Labels Product Model Numbers, Pictures, Descriptions and Specifications
- Table 145. HERMA Corporation Information
- Table 146. HERMA Description and Major Businesses
- Table 147. HERMA Industrial Labels Sales (M Sq.m), Revenue (US$ Million), Price (US$/K Sq.m) and Gross Margin (2017-2022)
- Table 148. HERMA Industrial Labels Product Model Numbers, Pictures, Descriptions and Specifications
- Table 149. Cymmetrik Corporation Information
- Table 150. Cymmetrik Description and Major Businesses
- Table 151. Cymmetrik Industrial Labels Sales (M Sq.m), Revenue (US$ Million), Price (US$/K Sq.m) and Gross Margin (2017-2022)
- Table 152. Cymmetrik Industrial Labels Product Model Numbers, Pictures, Descriptions and Specifications
- Table 153. Weber Packaging Solutions Corporation Information
- Table 154. Weber Packaging Solutions Description and Major Businesses
- Table 155. Weber Packaging Solutions Industrial Labels Sales (M Sq.m), Revenue (US$ Million), Price (US$/K Sq.m) and Gross Margin (2017-2022)
- Table 156. Weber Packaging Solutions Industrial Labels Product Model Numbers, Pictures, Descriptions and Specifications
- Table 157. ImageTek Labels Corporation Information
- Table 158. ImageTek Labels Description and Major Businesses
- Table 159. ImageTek Labels Industrial Labels Sales (M Sq.m), Revenue (US$ Million), Price (US$/K Sq.m) and Gross Margin (2017-2022)
- Table 160. ImageTek Labels Industrial Labels Product Model Numbers, Pictures, Descriptions and Specifications
- Table 161. Resource Label Corporation Information
- Table 162. Resource Label Description and Major Businesses
- Table 163. Resource Label Industrial Labels Sales (M Sq.m), Revenue (US$ Million), Price (US$/K Sq.m) and Gross Margin (2017-2022)
- Table 164. Resource Label Industrial Labels Product Model Numbers, Pictures, Descriptions and Specifications
- Table 165. SATO Corporation Information
- Table 166. SATO Description and Major Businesses
- Table 167. SATO Industrial Labels Sales (M Sq.m), Revenue (US$ Million), Price (US$/K Sq.m) and Gross Margin (2017-2022)
- Table 168. SATO Industrial Labels Product Model Numbers, Pictures, Descriptions and Specifications
- Table 169. Key Raw Materials Lists
- Table 170. Raw Materials Key Suppliers Lists
- Table 171. Industrial Labels Distributors List
- Table 172. Industrial Labels Customers List
- Table 173. Industrial Labels Market Trends
- Table 174. Industrial Labels Market Drivers
- Table 175. Industrial Labels Market Challenges
- Table 176. Research Programs/Design for This Report
- Table 177. Key Data Information from Secondary Sources
- Table 178. Key Data Information from Primary Sources
List of Figures
- Figure 1. Industrial Labels Product Picture
- Figure 2. Global Industrial Labels Market Size Growth Rate by Type, 2017 VS 2021 VS 2028 (US$ Million)
- Figure 3. Global Industrial Labels Market Share by Type: 2021 & 2028
- Figure 4. Warning/Security Labels Product Picture
- Figure 5. Branding Labels Product Picture
- Figure 6. Weatherproof Labels Product Picture
- Figure 7. Equipment Asset Labels Product Picture
- Figure 8. Global Industrial Labels Market Size Growth Rate by Application, 2017 VS 2021 VS 2028 (US$ Million)
- Figure 9. Global Industrial Labels Market Share by Application in 2021 & 2028
- Figure 10. Transportation & Logistics
- Figure 11. Automobile Industry
- Figure 12. Electronic Industry
- Figure 13. Consumer Products
- Figure 14. Industrial Labels Report Years Considered
- Figure 15. Global Industrial Labels Capacity, Production and Utilization (2017-2028) & (M Sq.m)
- Figure 16. Global Industrial Labels Production Market Share by Region in Percentage: 2021 Versus 2028
- Figure 17. Global Industrial Labels Production Market Share by Region (2017-2022)
- Figure 18. Global Industrial Labels Production Market Share by Region (2023-2028)
- Figure 19. Industrial Labels Production Growth Rate in North America (2017-2028) & (M Sq.m)
- Figure 20. Industrial Labels Production Growth Rate in Europe (2017-2028) & (M Sq.m)
- Figure 21. Industrial Labels Production Growth Rate in China (2017-2028) & (M Sq.m)
- Figure 22. Industrial Labels Production Growth Rate in Japan (2017-2028) & (M Sq.m)
- Figure 23. Global Industrial Labels Sales 2017-2028 (M Sq.m)
- Figure 24. Global Industrial Labels Revenue, (US$ Million), 2017 VS 2022 VS 2028
- Figure 25. Global Industrial Labels Revenue 2017-2028 (US$ Million)
- Figure 26. Global Industrial Labels Revenue Market Share by Region in Percentage: 2021 Versus 2028
- Figure 27. Global Industrial Labels Sales Market Share by Region (2017-2022)
- Figure 28. Global Industrial Labels Sales Market Share by Region (2023-2028)
- Figure 29. North America Industrial Labels Sales YoY (2017-2028) & (M Sq.m)
- Figure 30. North America Industrial Labels Revenue YoY (2017-2028) & (US$ Million)
- Figure 31. Europe Industrial Labels Sales YoY (2017-2028) & (M Sq.m)
- Figure 32. Europe Industrial Labels Revenue YoY (2017-2028) & (US$ Million)
- Figure 33. Asia-Pacific Industrial Labels Sales YoY (2017-2028) & (M Sq.m)
- Figure 34. Asia-Pacific Industrial Labels Revenue YoY (2017-2028) & (US$ Million)
- Figure 35. Latin America Industrial Labels Sales YoY (2017-2028) & (M Sq.m)
- Figure 36. Latin America Industrial Labels Revenue YoY (2017-2028) & (US$ Million)
- Figure 37. Middle East & Africa Industrial Labels Sales YoY (2017-2028) & (M Sq.m)
- Figure 38. Middle East & Africa Industrial Labels Revenue YoY (2017-2028) & (US$ Million)
- Figure 39. The Industrial Labels Market Share of Top 3 and Top 6 Largest Manufacturers Around the World in 2021
- Figure 40. The Top 3 and 6 Largest Manufacturers of Industrial Labels in the World: Market Share by Industrial Labels Revenue in 2021
- Figure 41. Global Industrial Labels Sales Market Share by Type (2017-2028)
- Figure 42. Global Industrial Labels Revenue Market Share by Type (2017-2028)
- Figure 43. Global Industrial Labels Sales Market Share by Application (2017-2028)
- Figure 44. Global Industrial Labels Revenue Market Share by Application (2017-2028)
- Figure 45. North America Industrial Labels Sales Market Share by Type (2017-2028)
- Figure 46. North America Industrial Labels Revenue Market Share by Type (2017-2028)
- Figure 47. North America Industrial Labels Sales Market Share by Application (2017-2028)
- Figure 48. North America Industrial Labels Revenue Market Share by Application (2017-2028)
- Figure 49. North America Industrial Labels Sales Share by Country (2017-2028)
- Figure 50. North America Industrial Labels Revenue Share by Country (2017-2028)
- Figure 51. United States Industrial Labels Revenue (2017-2028) & (US$ Million)
- Figure 52. Canada Industrial Labels Revenue (2017-2028) & (US$ Million)
- Figure 53. Europe Industrial Labels Sales Market Share by Type (2017-2028)
- Figure 54. Europe Industrial Labels Revenue Market Share by Type (2017-2028)
- Figure 55. Europe Industrial Labels Sales Market Share by Application (2017-2028)
- Figure 56. Europe Industrial Labels Revenue Market Share by Application (2017-2028)
- Figure 57. Europe Industrial Labels Sales Share by Country (2017-2028)
- Figure 58. Europe Industrial Labels Revenue Share by Country (2017-2028)
- Figure 59. Germany Industrial Labels Revenue (2017-2028) & (US$ Million)
- Figure 60. U.K. Industrial Labels Revenue (2017-2028) & (US$ Million)
- Figure 61. France Industrial Labels Revenue (2017-2028) & (US$ Million)
- Figure 62. Russia Industrial Labels Revenue (2017-2028) & (US$ Million)
- Figure 63. Italy Industrial Labels Revenue (2017-2028) & (US$ Million)
- Figure 64. Asia Pacific Industrial Labels Sales Market Share by Type (2017-2028)
- Figure 65. Asia Pacific Industrial Labels Revenue Market Share by Type (2017-2028)
- Figure 66. Asia Pacific Industrial Labels Sales Market Share by Application (2017-2028)
- Figure 67. Asia Pacific Industrial Labels Revenue Market Share by Application (2017-2028)
- Figure 68. Asia Pacific Industrial Labels Sales Share by Region (2017-2028)
- Figure 69. Asia Pacific Industrial Labels Revenue Share by Region (2017-2028)
- Figure 70. China Industrial Labels Revenue (2017-2028) & (US$ Million)
- Figure 71. Japan Industrial Labels Revenue (2017-2028) & (US$ Million)
- Figure 72. South Korea Industrial Labels Revenue (2017-2028) & (US$ Million)
- Figure 73. Australia Industrial Labels Revenue (2017-2028) & (US$ Million)
- Figure 74. India Industrial Labels Revenue (2017-2028) & (US$ Million)
- Figure 75. Southeast Asia Industrial Labels Revenue (2017-2028) & (US$ Million)
- Figure 76. China Taiwan Industrial Labels Revenue (2017-2028) & (US$ Million)
- Figure 77. Latin America Industrial Labels Sales Market Share by Type (2017-2028)
- Figure 78. Latin America Industrial Labels Revenue Market Share by Type (2017-2028)
- Figure 79. Latin America Industrial Labels Sales Market Share by Application (2017-2028)
- Figure 80. Latin America Industrial Labels Revenue Market Share by Application (2017-2028)
- Figure 81. Latin America Industrial Labels Sales Share by Country (2017-2028)
- Figure 82. Latin America Industrial Labels Revenue Share by Country (2017-2028)
- Figure 83. Mexico Industrial Labels Revenue (2017-2028) & (US$ Million)
- Figure 84. Brazil Industrial Labels Revenue (2017-2028) & (US$ Million)
- Figure 85. Middle East and Africa Industrial Labels Sales Market Share by Type (2017-2028)
- Figure 86. Middle East and Africa Industrial Labels Revenue Market Share by Type (2017-2028)
- Figure 87. Middle East and Africa Industrial Labels Sales Market Share by Application (2017-2028)
- Figure 88. Middle East and Africa Industrial Labels Revenue Market Share by Application (2017-2028)
- Figure 89. Middle East and Africa Industrial Labels Sales Share by Region (2017-2028)
- Figure 90. Middle East and Africa Industrial Labels Revenue Share by Region (2017-2028)
- Figure 91. GCC Countries Industrial Labels Revenue (2017-2028) & (US$ Million)
- Figure 92. Turkey Industrial Labels Revenue (2017-2028) & (US$ Million)
- Figure 93. Africa Industrial Labels Revenue (2017-2028) & (US$ Million)
- Figure 94. Industrial Labels Value Chain
- Figure 95. Industrial Labels Production Process
- Figure 96. Channels of Distribution
- Figure 97. Distributors Profiles
- Figure 98. Bottom-up and Top-down Approaches for This Report
- Figure 99. Data Triangulation
- Figure 100. Key Executives Interviewed
Market Analysis and Insights:
Due to the COVID-19 pandemic, the global Industrial Labels market size is estimated to be worth US$ 42.33 Billion in 2022 and is forecast to a readjusted size of US$ 59.05 Billion by 2028 with a CAGR of 5.70% during the forecast period 2022-2028. Fully considering the economic change by this health crisis, Warning/Security Labels accounting for 23.92% of the Industrial Labels global market in 2021, is projected to value US$ 15.73 Billion by 2028, growing at a revised 7.24% CAGR from 2022 to 2028. While Transportation & Logistics segment is altered to an 5.87% CAGR throughout this forecast period.
China Industrial Labels market size was US$ 4.50 Billion in 2021, while the US and Europe Industrial Labels were US$ 13.50 Billion and US$ 12.33 million, severally. The proportion of the US was 35.14% in 2021, while China and Europe are 11.71% and 32.09% respectively, and it is predicted that China proportion will reach 16.41% in 2028, trailing a CAGR of 11.20% through the analysis period. India, South Korea, and Southeast Asia are noteworthy markets in Asia, with CAGR 9.89%, 4.12%, and 8.78% respectively for the next 6-year period. As for the Europe Industrial Labels landscape, Germany is projected to reach US$ 4.93 Billion by 2028 trailing a CAGR of 5.83% over the forecast period.
The global key manufacturers of Industrial Labels include 3M, CCL Industries, Avery Dennison, UPM Raflatac, CILS International, Brady, NFI Corp, Tesa SE, and Nitto, etc. In 2021, the global top five players hold a share approximately 31.32% in terms of revenue.
In terms of production side, this report researches the Industrial Labels capacity, production, growth rate, market share by manufacturers and by region (region level and country level), from 2017 to 2022, and forecast to 2028.
In terms of sales side, this report focuses on the sales of Industrial Labels by region (region level and country level), by company, by Type and by Application. from 2017 to 2022 and forecast to 2028.
Scope and Segment:
Industrial Labels market is segmented by Type, and by Application. Players, stakeholders, and other participants in the global Industrial Labels market will be able to gain the upper hand as they use the report as a powerful resource. The segmental analysis focuses on production capacity, revenue and forecast by Type, and by Application for the period 2017-2028.
By Company
- 3M
- CCL Industries
- Avery Dennison
- UPM Raflatac
- CILS International
- Brady
- NFI Corp
- Tesa SE
- Nitto
Segment by Type
- Warning/Security Labels
- Branding Labels
- Weatherproof Labels
- Equipment Asset Labels
- Others
Segment by Application
- Transportation & Logistics
- Automobile Industry
- Electronic Industry
- Consumer Durables
- Others
Production by Region
- North America
- Europe
- China
- Japan
Sales by Region
- North America
- United States
- Canada
- Asia-Pacific
- China
- Japan
- South Korea
- India
- Australia
- China Taiwan
- Indonesia
- Thailand
- Malaysia
- Europe
- Germany
- France
- U.K.
- Italy
- Russia
- Latin America
- Mexico
- Brazil
- Middle East & Africa
- GCC Countries
- Turkey
- Africa
Table of Contents
1 Study Coverage
- 1.1 Industrial Labels Product Introduction
- 1.2 Market by Type
- 1.2.1 Global Industrial Labels Market Size by Type, 2017 VS 2021 VS 2028
- 1.2.2 Warning/Security Labels
- 1.2.3 Branding Labels
- 1.2.4 Weatherproof Labels
- 1.2.5 Equipment Asset Labels
- 1.3 Market by Application
- 1.3.1 Global Industrial Labels Market Size by Application, 2017 VS 2021 VS 2028
- 1.3.2 Transportation & Logistics
- 1.3.3 Automobile Industry
- 1.3.4 Electronic Industry
- 1.3.5 Consumer Durables
- 1.4 Study Objectives
- 1.5 Years Considered
2 Global Industrial Labels Production
- 2.1 Global Industrial Labels Production Capacity (2017-2028)
- 2.2 Global Industrial Labels Production by Region: 2017 VS 2021 VS 2028
- 2.3 Global Industrial Labels Production by Region
- 2.3.1 Global Industrial Labels Historic Production by Region (2017-2022)
- 2.3.2 Global Industrial Labels Forecasted Production by Region (2023-2028)
- 2.4 North America
- 2.5 Europe
- 2.6 China
- 2.7 Japan
3 Global Industrial Labels Sales in Volume & Value Estimates and Forecasts
- 3.1 Global Industrial Labels Sales Estimates and Forecasts 2017-2028
- 3.2 Global Industrial Labels Revenue Estimates and Forecasts 2017-2028
- 3.3 Global Industrial Labels Revenue by Region: 2017 VS 2021 VS 2028
- 3.4 Global Top Industrial Labels Regions by Sales
- 3.4.1 Global Top Industrial Labels Regions by Sales (2017-2022)
- 3.4.2 Global Top Industrial Labels Regions by Sales (2023-2028)
- 3.5 Global Top Industrial Labels Regions by Revenue
- 3.5.1 Global Top Industrial Labels Regions by Revenue (2017-2022)
- 3.5.2 Global Top Industrial Labels Regions by Revenue (2023-2028)
- 3.6 North America
- 3.7 Europe
- 3.8 Asia-Pacific
- 3.9 Latin America
- 3.10 Middle East & Africa
4 Competition by Manufacturers
- 4.1 Global Industrial Labels Production Capacity by Manufacturers
- 4.2 Global Industrial Labels Sales by Manufacturers
- 4.2.1 Global Industrial Labels Sales by Manufacturers (2017-2022)
- 4.2.2 Global Industrial Labels Sales Market Share by Manufacturers (2017-2022)
- 4.2.3 Global Top 3 and Top 6 Largest Manufacturers of Industrial Labels in 2021
- 4.3 Global Industrial Labels Revenue by Manufacturers
- 4.3.1 Global Industrial Labels Revenue by Manufacturers (2017-2022)
- 4.3.2 Global Industrial Labels Revenue Market Share by Manufacturers (2017-2022)
- 4.3.3 Global Top 3 and Top 6 Companies by Industrial Labels Revenue in 2021
- 4.4 Global Industrial Labels Sales Price by Manufacturers (2017-2022)
- 4.5 Analysis of Competitive Landscape
- 4.5.1 Manufacturers Market Concentration Ratio (CR5 and HHI)
- 4.5.2 Global Industrial Labels Market Share by Company Type (Tier 1, Tier 2, and Tier 3)
- 4.5.3 Global Industrial Labels Manufacturers Geographical Distribution
- 4.6 Mergers & Acquisitions, Expansion Plans
5 Market Size by Type
- 5.1 Global Industrial Labels Sales by Type
- 5.1.1 Global Industrial Labels Historical Sales by Type (2017-2022)
- 5.1.2 Global Industrial Labels Forecasted Sales by Type (2023-2028)
- 5.1.3 Global Industrial Labels Sales Market Share by Type (2017-2028)
- 5.2 Global Industrial Labels Revenue by Type
- 5.2.1 Global Industrial Labels Historical Revenue by Type (2017-2022)
- 5.2.2 Global Industrial Labels Forecasted Revenue by Type (2023-2028)
- 5.2.3 Global Industrial Labels Revenue Market Share by Type (2017-2028)
- 5.3 Global Industrial Labels Price by Type
- 5.3.1 Global Industrial Labels Price by Type (2017-2022)
- 5.3.2 Global Industrial Labels Price Forecast by Type (2023-2028)
6 Market Size by Application
- 6.1 Global Industrial Labels Sales by Application
- 6.1.1 Global Industrial Labels Historical Sales by Application (2017-2022)
- 6.1.2 Global Industrial Labels Forecasted Sales by Application (2023-2028)
- 6.1.3 Global Industrial Labels Sales Market Share by Application (2017-2028)
- 6.2 Global Industrial Labels Revenue by Application
- 6.2.1 Global Industrial Labels Historical Revenue by Application (2017-2022)
- 6.2.2 Global Industrial Labels Forecasted Revenue by Application (2023-2028)
- 6.2.3 Global Industrial Labels Revenue Market Share by Application (2017-2028)
- 6.3 Global Industrial Labels Price by Application
- 6.3.1 Global Industrial Labels Price by Application (2017-2022)
- 6.3.2 Global Industrial Labels Price Forecast by Application (2023-2028)
7 North America
- 7.1 North America Industrial Labels Market Size by Type
- 7.1.1 North America Industrial Labels Sales by Type (2017-2028)
- 7.1.2 North America Industrial Labels Revenue by Type (2017-2028)
- 7.2 North America Industrial Labels Market Size by Application
- 7.2.1 North America Industrial Labels Sales by Application (2017-2028)
- 7.2.2 North America Industrial Labels Revenue by Application (2017-2028)
- 7.3 North America Industrial Labels Sales by Country
- 7.3.1 North America Industrial Labels Sales by Country (2017-2028)
- 7.3.2 North America Industrial Labels Revenue by Country (2017-2028)
- 7.3.3 United States
- 7.3.4 Canada
8 Europe
- 8.1 Europe Industrial Labels Market Size by Type
- 8.1.1 Europe Industrial Labels Sales by Type (2017-2028)
- 8.1.2 Europe Industrial Labels Revenue by Type (2017-2028)
- 8.2 Europe Industrial Labels Market Size by Application
- 8.2.1 Europe Industrial Labels Sales by Application (2017-2028)
- 8.2.2 Europe Industrial Labels Revenue by Application (2017-2028)
- 8.3 Europe Industrial Labels Market Size by Country
- 8.3.1 Europe Industrial Labels Sales by Country (2017-2028)
- 8.3.2 Europe Industrial Labels Revenue by Country (2017-2028)
- 8.3.3 Germany
- 8.3.4 U.K.
- 8.3.5 France
- 8.3.6 Russia
- 8.3.7 Italy
9 Asia Pacific
- 9.1 Asia Pacific Industrial Labels Market Size by Type
- 9.1.1 Asia Pacific Industrial Labels Sales by Type (2017-2028)
- 9.1.2 Asia Pacific Industrial Labels Revenue by Type (2017-2028)
- 9.2 Asia Pacific Industrial Labels Market Size by Application
- 9.2.1 Asia Pacific Industrial Labels Sales by Application (2017-2028)
- 9.2.2 Asia Pacific Industrial Labels Revenue by Application (2017-2028)
- 9.3 Asia Pacific Industrial Labels Market Size by Region
- 9.3.1 Asia Pacific Industrial Labels Sales by Region (2017-2028)
- 9.3.2 Asia Pacific Industrial Labels Revenue by Region (2017-2028)
- 9.3.3 China
- 9.3.4 Japan
- 9.3.5 South Korea
- 9.3.6 Australia
- 9.3.7 India
- 9.3.8 Southeast Asia
- 9.3.9 China Taiwan
10 Latin America
- 10.1 Latin America Industrial Labels Market Size by Type
- 10.1.1 Latin America Industrial Labels Sales by Type (2017-2028)
- 10.1.2 Latin America Industrial Labels Revenue by Type (2017-2028)
- 10.2 Latin America Industrial Labels Market Size by Application
- 10.2.1 Latin America Industrial Labels Sales by Application (2017-2028)
- 10.2.2 Latin America Industrial Labels Revenue by Application (2017-2028)
- 10.3 Latin America Industrial Labels Market Size by Country
- 10.3.1 Latin America Industrial Labels Sales by Country (2017-2028)
- 10.3.2 Latin America Industrial Labels Revenue by Country (2017-2028)
- 10.3.3 Mexico
- 10.3.4 Brazil
11 Middle East and Africa
- 11.1 Middle East and Africa Industrial Labels Market Size by Type
- 11.1.1 Middle East and Africa Industrial Labels Sales by Type (2017-2028)
- 11.1.2 Middle East and Africa Industrial Labels Revenue by Type (2017-2028)
- 11.2 Middle East and Africa Industrial Labels Market Size by Application
- 11.2.1 Middle East and Africa Industrial Labels Sales by Application (2017-2028)
- 11.2.2 Middle East and Africa Industrial Labels Revenue by Application (2017-2028)
- 11.3 Middle East and Africa Industrial Labels Market Size by Region
- 11.3.1 Middle East and Africa Industrial Labels Sales by Region (2017-2028)
- 11.3.2 Middle East and Africa Industrial Labels Revenue by Region (2017-2028)
- 11.3.3 GCC Countries
- 11.3.4 Turkey
- 11.3.5 Africa
12 Corporate Profile
- 12.1 3M
- 12.1.1 3M Corporation Information
- 12.1.2 3M Overview
- 12.1.3 3M Industrial Labels Sales, Price, Revenue and Gross Margin (2017-2022)
- 12.1.4 3M Industrial Labels Product Model Numbers, Pictures, Descriptions and Specifications
- 12.2 Avery Dennison
- 12.2.1 Avery Dennison Corporation Information
- 12.2.2 Avery Dennison Overview
- 12.2.3 Avery Dennison Industrial Labels Sales, Price, Revenue and Gross Margin (2017-2022)
- 12.2.4 Avery Dennison Industrial Labels Product Model Numbers, Pictures, Descriptions and Specifications
- 12.3 Brady
- 12.3.1 Brady Corporation Information
- 12.3.2 Brady Overview
- 12.3.3 Brady Industrial Labels Sales, Price, Revenue and Gross Margin (2017-2022)
- 12.3.4 Brady Industrial Labels Product Model Numbers, Pictures, Descriptions and Specifications
- 12.4 CCL Industries
- 12.4.1 CCL Industries Corporation Information
- 12.4.2 CCL Industries Overview
- 12.4.3 CCL Industries Industrial Labels Sales, Price, Revenue and Gross Margin (2017-2022)
- 12.4.4 CCL Industries Industrial Labels Product Model Numbers, Pictures, Descriptions and Specifications
- 12.5 UPM Raflatac
- 12.5.1 UPM Raflatac Corporation Information
- 12.5.2 UPM Raflatac Overview
- 12.5.3 UPM Raflatac Industrial Labels Sales, Price, Revenue and Gross Margin (2017-2022)
- 12.5.4 UPM Raflatac Industrial Labels Product Model Numbers, Pictures, Descriptions and Specifications
- 12.6 CILS International
- 12.6.1 CILS International Corporation Information
- 12.6.2 CILS International Overview
- 12.6.3 CILS International Industrial Labels Sales, Price, Revenue and Gross Margin (2017-2022)
- 12.6.4 CILS International Industrial Labels Product Model Numbers, Pictures, Descriptions and Specifications
- 12.7 NFI Corp
- 12.7.1 NFI Corp Corporation Information
- 12.7.2 NFI Corp Overview
- 12.7.3 NFI Corp Industrial Labels Sales, Price, Revenue and Gross Margin (2017-2022)
- 12.7.4 NFI Corp Industrial Labels Product Model Numbers, Pictures, Descriptions and Specifications
- 12.8 Tesa SE
- 12.8.1 Tesa SE Corporation Information
- 12.8.2 Tesa SE Overview
- 12.8.3 Tesa SE Industrial Labels Sales, Price, Revenue and Gross Margin (2017-2022)
- 12.8.4 Tesa SE Industrial Labels Product Model Numbers, Pictures, Descriptions and Specifications
- 12.9 Nitto
- 12.9.1 Nitto Corporation Information
- 12.9.2 Nitto Overview
- 12.9.3 Nitto Industrial Labels Sales, Price, Revenue and Gross Margin (2017-2022)
- 12.9.4 Nitto Industrial Labels Product Model Numbers, Pictures, Descriptions and Specifications
- 12.10 HERMA
- 12.10.1 HERMA Corporation Information
- 12.10.2 HERMA Overview
- 12.10.3 HERMA Industrial Labels Sales, Price, Revenue and Gross Margin (2017-2022)
- 12.10.4 HERMA Industrial Labels Product Model Numbers, Pictures, Descriptions and Specifications
- 12.11 Cymmetrik
- 12.11.1 Cymmetrik Corporation Information
- 12.11.2 Cymmetrik Overview
- 12.11.3 Cymmetrik Industrial Labels Sales, Price, Revenue and Gross Margin (2017-2022)
- 12.11.4 Cymmetrik Industrial Labels Product Model Numbers, Pictures, Descriptions and Specifications
- 12.12 Weber Packaging Solutions
- 12.12.1 Weber Packaging Solutions Corporation Information
- 12.12.2 Weber Packaging Solutions Overview
- 12.12.3 Weber Packaging Solutions Industrial Labels Sales, Price, Revenue and Gross Margin (2017-2022)
- 12.12.4 Weber Packaging Solutions Industrial Labels Product Model Numbers, Pictures, Descriptions and Specifications
- 12.13 ImageTek Labels
- 12.13.1 ImageTek Labels Corporation Information
- 12.13.2 ImageTek Labels Overview
- 12.13.3 ImageTek Labels Industrial Labels Sales, Price, Revenue and Gross Margin (2017-2022)
- 12.13.4 ImageTek Labels Industrial Labels Product Model Numbers, Pictures, Descriptions and Specifications
- 12.14 Resource Label
- 12.14.1 Resource Label Corporation Information
- 12.14.2 Resource Label Overview
- 12.14.3 Resource Label Industrial Labels Sales, Price, Revenue and Gross Margin (2017-2022)
- 12.14.4 Resource Label Industrial Labels Product Model Numbers, Pictures, Descriptions and Specifications
- 12.15 SATO
- 12.15.1 SATO Corporation Information
- 12.15.2 SATO Overview
- 12.15.3 SATO Industrial Labels Sales, Price, Revenue and Gross Margin (2017-2022)
- 12.15.4 SATO Industrial Labels Product Model Numbers, Pictures, Descriptions and Specifications
13 Industry Chain and Sales Channels Analysis
- 13.1 Industrial Labels Industry Chain Analysis
- 13.2 Industrial Labels Key Raw Materials
- 13.2.1 Key Raw Materials
- 13.2.2 Raw Materials Key Suppliers
- 13.3 Industrial Labels Production Mode & Process
- 13.4 Industrial Labels Sales and Marketing
- 13.4.1 Industrial Labels Sales Channels
- 13.4.2 Industrial Labels Distributors
- 13.5 Industrial Labels Customers
14 Industrial Labels Market Dynamics
- 14.1.1 Industrial Labels Industry Trends
- 14.1.2 Industrial Labels Market Drivers
- 14.1.3 Industrial Labels Market Challenges
- 14.1.4 Industrial Labels Market Restraints
15 Key Findings in the Global Industrial Labels Study
16 Appendix
- 16.1 Research Methodology
- 16.1.1 Methodology/Research Approach
- 16.1.2 Data Source
- 16.2 Author Details
- 16.3 Disclaimer 146