|
|
市場調査レポート
商品コード
1123687
スカンジナビア諸国の狩猟用遠赤外画像装置の市場:考察と予測 (2028年まで)Scandinavian Thermal Infrared Imagers for Hunting Market Insights, Forecast to 2028 |
||||||
|
|
|||||||
|
● お客様のご希望に応じて、既存データの加工や未掲載情報(例:国別セグメント)の追加などの対応が可能です。 詳細はお問い合わせください。 |
|||||||


| スカンジナビア諸国の狩猟用遠赤外画像装置の市場:考察と予測 (2028年まで) |
|
出版日: 2022年09月08日
発行: QYResearch
ページ情報: 英文 78 Pages
納期: 2~3営業日
|
- 全表示
- 概要
- 図表
- 目次
COVID-19の大流行により、スカンジナビア諸国の狩猟用熱赤外画像装置の市場規模は、2022年に4,156万米ドルと推定され、レビュー期間中に4.10%のCAGRで成長し、2028年までに改訂5,290万米ドルの規模に達すると予測されています。
目次
第1章 調査範囲
- 狩猟用遠赤外画像装置:製品概略
- 種類別の市場
- 販売チャネル別の市場
- 分析対象
- 分析期間
第2章 エグゼクティブサマリー
- スカンジナビア諸国の狩猟用遠赤外画像装置の販売:推定・予測 (2017年~2028年)
- スカンジナビア諸国の狩猟用遠赤外画像装置の収益:推定・予測 (2017年~2028年)
- スカンジナビア諸国の狩猟用遠赤外画像装置の収益:地域別 (2017年・2021年・2028年)
- スカンジナビア諸国の狩猟用遠赤外画像装置の販売:国別
- スカンジナビア諸国の狩猟用遠赤外画像装置の収益:国別
- ノルウェー
- スウェーデン
- デンマーク
- フィンランド
第3章 メーカー別の競合
- スカンジナビア諸国の狩猟用遠赤外画像装置の販売:メーカー別
- スカンジナビア諸国の狩猟用遠赤外画像装置の収益:メーカー別
- スカンジナビア諸国の狩猟用遠赤外画像装置の販売価格:メーカー別 (2020年~2022年)
- 競合情勢の分析
- 企業合併・買収 (M&A)、拡張計画
- ノルウェーの狩猟用遠赤外画像装置の収益:メーカー別
- スウェーデンの狩猟用遠赤外画像装置の収益:メーカー別
- デンマークの狩猟用遠赤外画像装置の収益:メーカー別
- フィンランドの狩猟用遠赤外画像装置の収益:メーカー別
第4章 種類別の市場規模
- スカンジナビア諸国の狩猟用遠赤外画像装置の販売:種類別
- スカンジナビア諸国の狩猟用遠赤外画像装置の収益:種類別
- スカンジナビア諸国の狩猟用遠赤外画像装置の価格:種類別
第5章 販売チャネル別の市場規模
- スカンジナビア諸国の狩猟用遠赤外画像装置の販売:販売チャネル別
- スカンジナビア諸国の狩猟用遠赤外画像装置の収益:販売チャネル別
- スカンジナビア諸国の狩猟用遠赤外画像装置の価格:販売チャネル別
第6章 企業プロファイル
- Raytron Technology
- Teledyne FLIR
- HikMicro
- Yukon Advanced Optics Worldwide (Pulsar)
- Pard
第7章 付録
LIST OF TABLES
- Table 1. Scandinavian Thermal Infrared Imagers for Hunting Market Size Growth Rate by Type, 2017 VS 2021 VS 2028 (US$ Million)
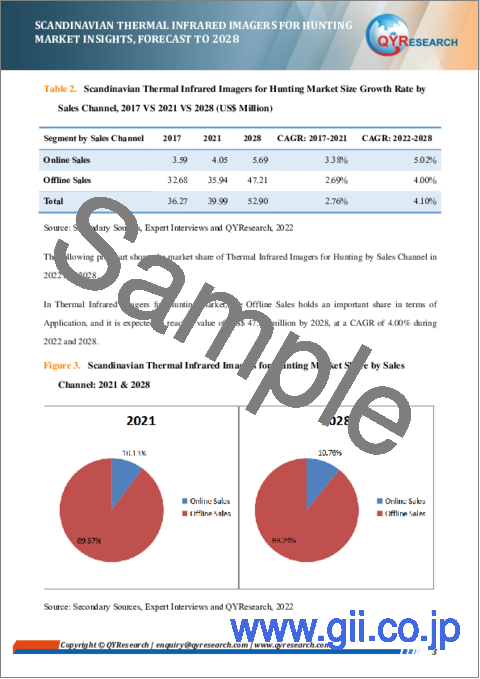
- Table 2. Scandinavian Thermal Infrared Imagers for Hunting Market Size Growth Rate by Sales Channel, 2017 VS 2021 VS 2028 (US$ Million)
- Table 3. Scandinavian Thermal Infrared Imagers for Hunting Revenue by Country: 2017 VS 2021 VS 2028 (US$ Million)
- Table 4. Scandinavian Thermal Infrared Imagers for Hunting Sales by Country (2017-2022) & (Units)
- Table 5. Scandinavian Thermal Infrared Imagers for Hunting Sales Market Share by Country (2017-2022)
- Table 6. Scandinavian Thermal Infrared Imagers for Hunting Sales by Country (2023-2028) & (Units)
- Table 7. Scandinavian Thermal Infrared Imagers for Hunting Sales Market Share by Country (2023-2028)
- Table 8. Scandinavian Thermal Infrared Imagers for Hunting Revenue by Country (2017-2022) & (US$ Million)
- Table 9. Scandinavian Thermal Infrared Imagers for Hunting Revenue Market Share by Country (2017-2022)
- Table 10. Scandinavian Thermal Infrared Imagers for Hunting Revenue by Country (2023-2028) & (US$ Million)
- Table 11. Scandinavian Thermal Infrared Imagers for Hunting Revenue Market Share by Country (2023-2028)
- Table 12. Scandinavian Thermal Infrared Imagers for Hunting Sales by Manufacturers (2020-2022) & (Units)
- Table 13. Scandinavian Thermal Infrared Imagers for Hunting Sales Share by Manufacturers (2020-2022)
- Table 14. Scandinavian Thermal Infrared Imagers for Hunting Revenue by Manufacturers (2020-2022) & (US$ Million)
- Table 15. Scandinavian Thermal Infrared Imagers for Hunting Revenue Market Share by Manufacturers (2020-2022)
- Table 16. Thermal Infrared Imagers for Hunting Price by Manufacturers (2020-2022) & (US$/Unit)
- Table 17. Scandinavian Thermal Infrared Imagers for Hunting Manufacturers Market Concentration Ratio (CR5 and HHI)
- Table 18. Scandinavian Thermal Infrared Imagers for Hunting by Company Type (Tier 1, Tier 2, and Tier 3) & (based on the Revenue in Thermal Infrared Imagers for Hunting as of 2021)
- Table 19. Norway Thermal Infrared Imagers for Hunting Revenue by Manufacturers (2020-2022) & (US$ Million)
- Table 20. Sweden Thermal Infrared Imagers for Hunting Revenue by Manufacturers (2020-2022) & (US$ Million)
- Table 21. Denmark Thermal Infrared Imagers for Hunting Revenue by Manufacturers (2020-2022) & (US$ Million)
- Table 22. Finland Thermal Infrared Imagers for Hunting Revenue by Manufacturers (2020-2022) & (US$ Million)
- Table 23. Scandinavian Thermal Infrared Imagers for Hunting Sales by Type (2017-2022) & (Units)
- Table 24. Scandinavian Thermal Infrared Imagers for Hunting Sales by Type (2023-2028) & (Units)
- Table 25. Scandinavian Thermal Infrared Imagers for Hunting Sales Share by Type (2017-2022)
- Table 26. Scandinavian Thermal Infrared Imagers for Hunting Sales Share by Type (2023-2028)
- Table 27. Scandinavian Thermal Infrared Imagers for Hunting Revenue by Type (2017-2022) & (US$ Million)
- Table 28. Scandinavian Thermal Infrared Imagers for Hunting Revenue by Type (2023-2028) & (US$ Million)
- Table 29. Scandinavian Thermal Infrared Imagers for Hunting Revenue Share by Type (2017-2022)
- Table 30. Scandinavian Thermal Infrared Imagers for Hunting Revenue Share by Type (2023-2028)
- Table 31. Thermal Infrared Imagers for Hunting Price by Type (2017-2022) & (US$/Unit)
- Table 32. Scandinavian Thermal Infrared Imagers for Hunting Price Forecast by Type (2023-2028) & (US$/Unit)
- Table 33. Scandinavian Thermal Infrared Imagers for Hunting Sales by Sales Channel (2017-2022) & (Units)
- Table 34. Scandinavian Thermal Infrared Imagers for Hunting Sales by Sales Channel (2023-2028) & (Units)
- Table 35. Scandinavian Thermal Infrared Imagers for Hunting Sales Share by Sales Channel (2017-2022)
- Table 36. Scandinavian Thermal Infrared Imagers for Hunting Sales Share by Sales Channel (2023-2028)
- Table 37. Scandinavian Thermal Infrared Imagers for Hunting Revenue by Sales Channel (2017-2022) & (US$ Million)
- Table 38. Scandinavian Thermal Infrared Imagers for Hunting Revenue by Sales Channel (2023-2028) & (US$ Million)
- Table 39. Scandinavian Thermal Infrared Imagers for Hunting Revenue Share by Sales Channel (2017-2022)
- Table 40. Scandinavian Thermal Infrared Imagers for Hunting Revenue Share by Sales Channel (2023-2028)
- Table 41. Thermal Infrared Imagers for Hunting Price by Sales Channel (2017-2022) & (US$/Unit)
- Table 42. Scandinavian Thermal Infrared Imagers for Hunting Price Forecast by Sales Channel (2023-2028) & (US$/Unit)
- Table 43. Raytron Technology Corporation Information
- Table 44. Raytron Technology Description and Major Businesses
- Table 45. Raytron Technology Thermal Infrared Imagers for Hunting Sales (Units), Revenue (US$ Million), Price (US$/Unit) and Gross Margin (2020-2022)
- Table 46. Raytron Technology Thermal Infrared Imagers for Hunting Product Model Numbers, Pictures, Descriptions and Specifications
- Table 47. Teledyne FLIR Corporation Information
- Table 48. Teledyne FLIR Description and Major Businesses
- Table 49. Teledyne FLIR Thermal Infrared Imagers for Hunting Sales (Units), Revenue (US$ Million), Price (US$/Unit) and Gross Margin (2020-2022)
- Table 50. Teledyne FLIR Thermal Infrared Imagers for Hunting Product Model Numbers, Pictures, Descriptions and Specifications
- Table 51. HikMicro Corporation Information
- Table 52. HikMicro Description and Major Businesses
- Table 53. HikMicro Thermal Infrared Imagers for Hunting Sales (Units), Revenue (US$ Million), Price (US$/Unit) and Gross Margin (2020-2022)
- Table 54. HikMicro Thermal Infrared Imagers for Hunting Product Model Numbers, Pictures, Descriptions and Specifications
- Table 55. Yukon Advanced Optics Worldwide (Pulsar) Corporation Information
- Table 56. Yukon Advanced Optics Worldwide (Pulsar) Description and Major Businesses
- Table 57. Yukon Advanced Optics Worldwide (Pulsar) Thermal Infrared Imagers for Hunting Sales (Units), Revenue (US$ Million), Price (US$/Unit) and Gross Margin (2020-2022)
- Table 58. Yukon Advanced Optics Worldwide (Pulsar) Thermal Infrared Imagers for Hunting Product Model Numbers, Pictures, Descriptions and Specifications
- Table 59. Pard Corporation Information
- Table 60. Pard Description and Major Businesses
- Table 61. Pard Thermal Infrared Imagers for Hunting Sales (Units), Revenue (US$ Million), Price (US$/Unit) and Gross Margin (2020-2022)
- Table 62. Pard Thermal Infrared Imagers for Hunting Product Model Numbers, Pictures, Descriptions and Specifications
- Table 63. Research Programs/Design for This Report
- Table 64. Key Data Information from Secondary Sources
- Table 65. Key Data Information from Primary Sources
List of Figures
- Figure 1. Thermal Infrared Imagers for Hunting Product Picture
- Figure 2. Scandinavian Thermal Infrared Imagers for Hunting Market Share by Type: 2021 & 2028
- Figure 3. Scandinavian Thermal Infrared Imagers for Hunting Market Share by Sales Channel: 2021 & 2028
- Figure 4. Thermal Infrared Imagers for Hunting Report Years Considered
- Figure 5. Scandinavian Thermal Infrared Imagers for Hunting Sales 2017-2028 (Units)
- Figure 6. Scandinavian Thermal Infrared Imagers for Hunting Revenue, (US$ Million), 2017 VS 2021 VS 2028
- Figure 7. Scandinavian Thermal Infrared Imagers for Hunting Revenue 2017-2028 (US$ Million)
- Figure 8. Scandinavian Thermal Infrared Imagers for Hunting Revenue Market Share by Country in Percentage: 2021 Versus 2028
- Figure 9. Norway Thermal Infrared Imagers for Hunting Sales YoY (2017-2028) & (Units)
- Figure 10. Norway Thermal Infrared Imagers for Hunting Revenue YoY (2017-2028) & (US$ Million)
- Figure 11. Sweden Thermal Infrared Imagers for Hunting Sales YoY (2017-2028) & (Units)
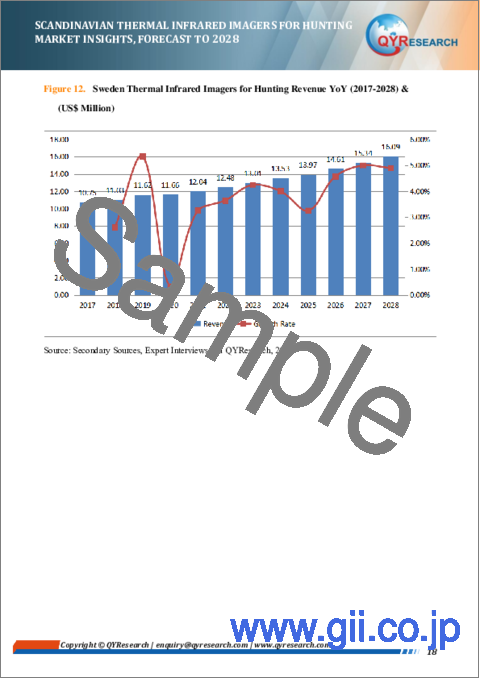
- Figure 12. Sweden Thermal Infrared Imagers for Hunting Revenue YoY (2017-2028) & (US$ Million)
- Figure 13. Denmark Thermal Infrared Imagers for Hunting Sales YoY (2017-2028) & (Units)
- Figure 14. Denmark Thermal Infrared Imagers for Hunting Revenue YoY (2017-2028) & (US$ Million)
- Figure 15. Finland Thermal Infrared Imagers for Hunting Sales YoY (2017-2028) & (Units)
- Figure 16. Finland Thermal Infrared Imagers for Hunting Revenue YoY (2017-2028) & (US$ Million)
- Figure 17. Bottom-up and Top-down Approaches for This Report
- Figure 18. Data Triangulation
- Figure 19. Key Executives Interviewed 62
Market Analysis and Insights:
Due to the COVID-19 pandemic, the Scandinavian Thermal Infrared Imagers for Hunting market size is estimated to be worth US$ 41.56 million in 2022 and is forecast to a readjusted size of US$ 52.9 million by 2028 with a CAGR of 4.10% during the review period.
In Scandinavian, the key manufacturers of Thermal Infrared Imagers for Hunting include Pulsar, Iray, Pard, HikMicro/Hikvisio, and etc. In 2021, the Scandinavian top five players have a share approximately 77.54% in terms of revenue.
Scope and Segment:
Thermal Infrared Imagers for Hunting market is segmented by Type, and by Sales Channel. Players, stakeholders, and other participants in the Scandinavian Thermal Infrared Imagers for Hunting market will be able to gain the upper hand as they use the report as a powerful resource. The segmental analysis focuses on sales, revenue and forecast by Type, and by Sales Channel for the period 2017-2028.
By Company
- Raytron Technology
- Teledyne FLIR
- HikMicro/Hikvisio
- Yukon Advanced Optics Worldwide (Pulsar)
- Pard
Segment by Type
- Uncooled Thermal Infrared Imagers
- Cooled Thermal Infrared Imagers
Segment by Sales Channel
- Online Sales
- Offline Sales
Segment by Country/Region
- Norway
- Sweden
- Denmark
- Finland
TABLE OF CONTENTS
1 STUDY COVERAGE
- 1.1 Thermal Infrared Imagers for Hunting Product Introduction
- 1.2 Market by Type
- 1.3 Market by Sales Channel
- 1.4 Study Objectives
- 1.5 Years Considered
2 EXECUTIVE SUMMARY
- 2.1 Scandinavian Thermal Infrared Imagers for Hunting Sales Estimates and Forecasts 2017-2028
- 2.2 Scandinavian Thermal Infrared Imagers for Hunting Revenue Estimates and Forecasts 2017-2028
- 2.3 Scandinavian Thermal Infrared Imagers for Hunting Revenue by Country: 2017 VS 2021 VS 2028
- 2.4 Scandinavian Thermal Infrared Imagers for Hunting Sales by Country
- 2.4.1 Scandinavian Thermal Infrared Imagers for Hunting Sales by Country (2017-2022)
- 2.4.2 Scandinavian Sales Thermal Infrared Imagers for Hunting by Country (2023-2028)
- 2.5 Scandinavian Thermal Infrared Imagers for Hunting Revenue by Country
- 2.5.1 Scandinavian Thermal Infrared Imagers for Hunting Revenue by Country (2017-2022)
- 2.5.2 Scandinavian Thermal Infrared Imagers for Hunting Revenue by Country (2023-2028)
- 2.6 Norway
- 2.7 Sweden
- 2.8 Denmark
- 2.9 Finland
3 COMPETITION BY MANUFACTURERS
- 3.1 Scandinavian Thermal Infrared Imagers for Hunting Sales by Manufacturers
- 3.1.1 Scandinavian Thermal Infrared Imagers for Hunting Sales by Manufacturers (2020-2022)
- 3.1.2 Scandinavian Thermal Infrared Imagers for Hunting Sales Market Share by Manufacturers (2020-2022)
- 3.2 Scandinavian Thermal Infrared Imagers for Hunting Revenue by Manufacturers
- 3.2.1 Scandinavian Thermal Infrared Imagers for Hunting Revenue by Manufacturers (2020-2022)
- 3.2.2 Scandinavian Thermal Infrared Imagers for Hunting Revenue Market Share by Manufacturers (2020-2022)
- 3.3 Scandinavian Thermal Infrared Imagers for Hunting Sales Price by Manufacturers (2020-2022)
- 3.4 Analysis of Competitive Landscape
- 3.4.1 Manufacturers Market Concentration Ratio (CR5 and HHI)
- 3.4.2 Scandinavian Thermal Infrared Imagers for Hunting Market Share by Company Type (Tier 1, Tier 2, and Tier 3)
- 3.5 Norway Thermal Infrared Imagers for Hunting Revenue by Manufacturers
- 3.6 Sweden Thermal Infrared Imagers for Hunting Revenue by Manufacturers
- 3.7 Denmark Thermal Infrared Imagers for Hunting Revenue by Manufacturers
- 3.8 Finland Thermal Infrared Imagers for Hunting Revenue by Manufacturers
4 MARKET SIZE BY TYPE
- 4.1 Scandinavian Thermal Infrared Imagers for Hunting Sales by Type
- 4.1.1 Scandinavian Thermal Infrared Imagers for Hunting Historical Sales by Type (2017-2022)
- 4.1.2 Scandinavian Thermal Infrared Imagers for Hunting Forecasted Sales by Type (2023-2028)
- 4.1.3 Scandinavian Thermal Infrared Imagers for Hunting Sales Market Share by Type (2017-2028)
- 4.2 Scandinavian Thermal Infrared Imagers for Hunting Revenue by Type
- 4.2.1 Scandinavian Thermal Infrared Imagers for Hunting Historical Revenue by Type (2017-2022)
- 4.2.2 Scandinavian Thermal Infrared Imagers for Hunting Forecasted Revenue by Type (2023-2028)
- 4.2.3 Scandinavian Thermal Infrared Imagers for Hunting Revenue Market Share by Type (2017-2028)
- 4.3 Scandinavian Thermal Infrared Imagers for Hunting Price by Type
- 4.3.1 Scandinavian Thermal Infrared Imagers for Hunting Price by Type (2017-2022)
- 4.3.2 Scandinavian Thermal Infrared Imagers for Hunting Price Forecast by Type (2023-2028)
5 MARKET SIZE BY SALES CHANNEL
- 5.1 Scandinavian Thermal Infrared Imagers for Hunting Sales by Sales Channel
- 5.1.1 Scandinavian Thermal Infrared Imagers for Hunting Historical Sales by Sales Channel (2017-2022)
- 5.1.2 Scandinavian Thermal Infrared Imagers for Hunting Forecasted Sales by Sales Channel (2023-2028)
- 5.1.3 Scandinavian Thermal Infrared Imagers for Hunting Sales Market Share by Sales Channel (2017-2028)
- 5.2 Scandinavian Thermal Infrared Imagers for Hunting Revenue by Sales Channel
- 5.2.1 Scandinavian Thermal Infrared Imagers for Hunting Historical Revenue by Sales Channel (2017-2022)
- 5.2.2 Scandinavian Thermal Infrared Imagers for Hunting Forecasted Revenue by Sales Channel (2023-2028)
- 5.2.3 Scandinavian Thermal Infrared Imagers for Hunting Revenue Market Share by Sales Channel (2017-2028)
- 5.3 Scandinavian Thermal Infrared Imagers for Hunting Price by Sales Channel
- 5.3.1 Scandinavian Thermal Infrared Imagers for Hunting Price by Sales Channel (2017-2022)
- 5.3.2 Scandinavian Thermal Infrared Imagers for Hunting Price Forecast by Sales Channel (2023-2028)
6 CORPORATE PROFILE
- 6.1 Raytron Technology
- 6.1.1 Raytron Technology Corporation Information
- 6.1.2 Raytron Technology Overview
- 6.1.3 Raytron Technology in Scandinavian: Thermal Infrared Imagers for Hunting Sales, Price, Revenue and Gross Margin (2020-2022)
- 6.1.4 Raytron Technology Thermal Infrared Imagers for Hunting Product Model Numbers, Pictures, Descriptions and Specifications
- 6.2 Teledyne FLIR
- 6.2.1 Teledyne FLIR Corporation Information
- 6.2.2 Teledyne FLIR Overview
- 6.2.3 Teledyne FLIR in Scandinavian: Thermal Infrared Imagers for Hunting Sales, Price, Revenue and Gross Margin (2020-2022)
- 6.2.4 Teledyne FLIR Thermal Infrared Imagers for Hunting Product Model Numbers, Pictures, Descriptions and Specifications
- 6.3 HikMicro
- 6.3.1 HikMicro Corporation Information
- 6.3.2 HikMicro Overview
- 6.3.3 HikMicro in Scandinavian: Thermal Infrared Imagers for Hunting Sales, Price, Revenue and Gross Margin (2020-2022)
- 6.3.4 HikMicro Thermal Infrared Imagers for Hunting Product Model Numbers, Pictures, Descriptions and Specifications
- 6.4 Yukon Advanced Optics Worldwide (Pulsar)
- 6.4.1 Yukon Advanced Optics Worldwide (Pulsar) Corporation Information
- 6.4.2 Yukon Advanced Optics Worldwide (Pulsar) Overview
- 6.4.3 Yukon Advanced Optics Worldwide (Pulsar) in Scandinavian: Thermal Infrared Imagers for Hunting Sales, Price, Revenue and Gross Margin (2020-2022)
- 6.4.4 Yukon Advanced Optics Worldwide (Pulsar) Thermal Infrared Imagers for Hunting Product Model Numbers, Pictures, Descriptions and Specifications
- 6.5 Pard
- 6.5.1 Pard Corporation Information
- 6.5.2 Pard Overview
- 6.5.3 Pard in Scandinavian: Thermal Infrared Imagers for Hunting Sales, Price, Revenue and Gross Margin (2020-2022)
- 6.5.4 Pard Thermal Infrared Imagers for Hunting Product Model Numbers, Pictures, Descriptions and Specifications
7 APPENDIX
- 7.1 Research Methodology
- 7.1.1 Methodology/Research Approach
- 7.1.2 Data Source
- 7.2 Author Details
- 7.3 Disclaimer