|
|
市場調査レポート
商品コード
1108367
エポキシ樹脂成形材料の世界市場の分析 (2022年)Global Epoxy Molding Compounds Market Research Report 2022 |
||||||
|
|
|||||||
|
● お客様のご希望に応じて、既存データの加工や未掲載情報(例:国別セグメント)の追加などの対応が可能です。 詳細はお問い合わせください。 |
|||||||


| エポキシ樹脂成形材料の世界市場の分析 (2022年) |
|
出版日: 2022年08月01日
発行: QYResearch
ページ情報: 英文 127 Pages
納期: 2~3営業日
|
- 全表示
- 概要
- 図表
- 目次
エポキシ樹脂成形材料の世界市場は、2021年には21億7,804万米ドルとなり、2022年から2028年の間に年平均4.46%で成長し、2028年末には30億5,910万米ドルに達すると予測されています。
目次
第1章 エポキシ樹脂成形材料:市場概要
- エポキシ樹脂成形材料:製品の概要と範囲
- 種類別のセグメント
- 市場規模・成長率の分析:種類別 (2022年・2028年)
- 固体EMC
- 液体EMC
- 用途別のセグメント
- 世界市場の成長見通し
- 世界のエポキシ樹脂成形材料の収益:推定・予測 (2017年~2028年)
- 世界のエポキシ樹脂成形材料の生産能力:推定・予測 (2017年~2028年)
- 世界のエポキシ樹脂成形材料の生産:推定・予測 (2017年~2028年)
第2章 メーカー別の市場競争
- 世界のエポキシ樹脂成形材料の生産能力・市場シェア:メーカー別 (2017年~2022年)
- 世界のエポキシ樹脂成形材料の収益・市場シェア:メーカー別 (2017年~2022年)
- 市場シェア:企業の種類別 (ティア1、ティア2、ティア3)
- 世界のエポキシ樹脂成形材料の平均価格:メーカー別 (2017年~2022年)
- エポキシ樹脂成形材料メーカーの製造拠点・提供エリア・製品種類
- エポキシ樹脂成形材料市場の競争状況と動向
第3章 種類別のセグメント
- エポキシ樹脂成形材料の生産・市場シェア:種類別 (2017年~2022年)
- エポキシ樹脂成形材料の収益・市場シェア:種類別 (2017年~2022年)
- エポキシ樹脂成形材料の価格:種類別 (2017年~2022年)
第4章 用途別のセグメント
- エポキシ樹脂成形材料の生産・市場シェア:用途別 (2017年~2022年)
- エポキシ樹脂成形材料の収益・市場シェア:用途別 (2017年~2022年)
- エポキシ樹脂成形材料の価格:用途別 (2017年~2022年)
第5章 仕様別のセグメント
- エポキシ樹脂成形材料の生産・市場シェア:仕様別 (2017年~2022年)
- エポキシ樹脂成形材料の収益・市場シェア:仕様別 (2017年~2022年)
- エポキシ樹脂成形材料の価格:仕様別 (2017年~2022年)
第6章 製品別のセグメント
- エポキシ樹脂成形材料の生産・市場シェア:製品別 (2017年~2022年)
- エポキシ樹脂成形材料の収益・市場シェア:製品別 (2017年~2022年)
- エポキシ樹脂成形材料の価格:製品別 (2017年~2022年)
第7章 主要企業のプロファイル
- SUMITOMO BAKELITE
- 企業情報
- 製品ポートフォリオ
- 生産能力・収益・価格・粗利益 (2017年~2022年)
- 主要事業・市場
- SHOWA DENKO
- CHANG CHUN GROUP
- HYSOL HUAWEI ELECTRONICS
- PANASONIC
- KYOCERA
- KCC
- SAMSUNG SDI
- ETERNAL MATERIALS
- JIANGSU ZHONGPENG NEW MATERIAL
- SHIN-ETSU CHEMICAL
- NAGASE CHEMTEX CORPORATION
- TIANJIN KAIHUA INSULATING MATERIAL
- HHCK
- SCIENCHEM
- BEIJING SINO-TECH ELECTRONIC MATERIAL
第8章 エポキシ樹脂成形材料の製造コストの分析
- エポキシ樹脂成形材料の主要原材料の分析
- 製造コストの構造比率
- エポキシ樹脂成形材料の製造プロセスの分析
- エポキシ樹脂成形材料の産業チェーンの分析
第9章 種類別・用途別の予測
- 世界の生産・収益・価格予測:種類別 (2023年~2028年)
- 世界の生産・収益・価格予測:用途別 (2023年~2028年)
- 世界の生産・収益・価格予測:仕様別 (2023年~2028年)
- 世界の生産・収益・価格予測:製品別 (2023年~2028年)
第10章 調査結果と結論
第11章 調査手法とデータソース
LIST OF TABLES
- Table 1. Global Epoxy Molding Compounds Market Size by Type (K MT) & (US$ Million) & (2022 VS 2028)
- Table 2. Global Epoxy Molding Compounds Market Size by Application (K MT) & (US$ Million) & (2022 VS 2028)
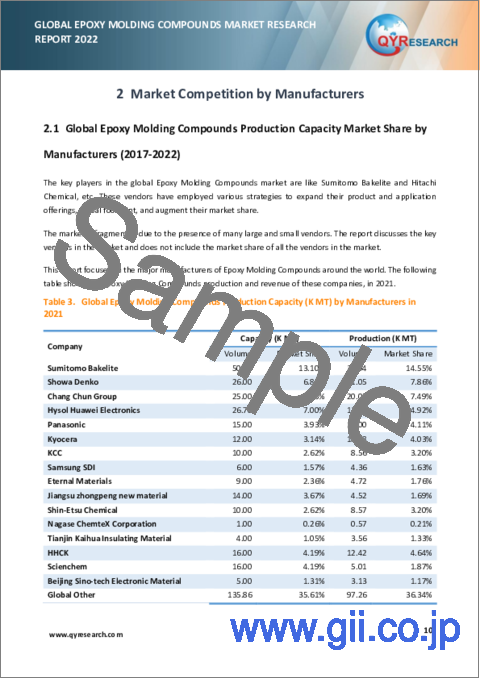
- Table 3. Global Epoxy Molding Compounds Production Capacity (K MT) by Manufacturers in 2021
- Table 4. Global Epoxy Molding Compounds Production by Manufacturers (2017-2022) & (K MT)
- Table 5. Global Epoxy Molding Compounds Production Market Share by Manufacturers (2017-2022)
- Table 6. Global Epoxy Molding Compounds Revenue by Manufacturers (2017-2022) & (US$ Million)
- Table 7. Global Epoxy Molding Compounds Revenue Share by Manufacturers (2017-2022)
- Table 8. Company Type (Tier 1, Tier 2, and Tier 3) & (based on the Revenue in Epoxy Molding Compounds as of 2021)
- Table 9. Global Market Epoxy Molding Compounds Average Price (USD/MT) of Key Manufacturers (2017-2022)
- Table 10. Manufacturers Epoxy Molding Compounds Production Sites and Area Served
- Table 11. Global Epoxy Molding Compounds Manufacturers Market Concentration Ratio (CR5 and HHI)
- Table 12. Mergers & Acquisitions, Expansion Plans
- Table 13. Global Epoxy Molding Compounds Production (K MT) by Type (2017-2022)
- Table 14. Global Epoxy Molding Compounds Production Market Share by Type (2017-2022)
- Table 15. Global Epoxy Molding Compounds Revenue (US$ Million) by Type (2017-2022)
- Table 16. Global Epoxy Molding Compounds Revenue Share by Type (2017-2022)
- Table 17. Global Epoxy Molding Compounds Price (USD/MT) by Type (2017-2022)
- Table 18. Global Epoxy Molding Compounds Production (K MT) by Application (2017-2022)
- Table 19. Global Epoxy Molding Compounds Production Market Share by Application (2017-2022)
- Table 20. Global Epoxy Molding Compounds Revenue (US$ Million) by Application (2017-2022)
- Table 21. Global Epoxy Molding Compounds Revenue Share by Application (2017-2022)
- Table 22. Global Epoxy Molding Compounds Price (USD/MT) by Application (2017-2022)
- Table 23. Global Epoxy Molding Compound Comparison by Specification (2017-2022)
- Table 24. Global Epoxy Molding Compounds Production (K MT) by Specification (2017-2022)
- Table 25. Global Epoxy Molding Compounds Production Market Share by Specification (2017-2022)
- Table 26. Global Epoxy Molding Compounds Revenue (US$ Million) by Specification (2017-2022)
- Table 27. Global Epoxy Molding Compounds Revenue Share by Specification (2017-2022)
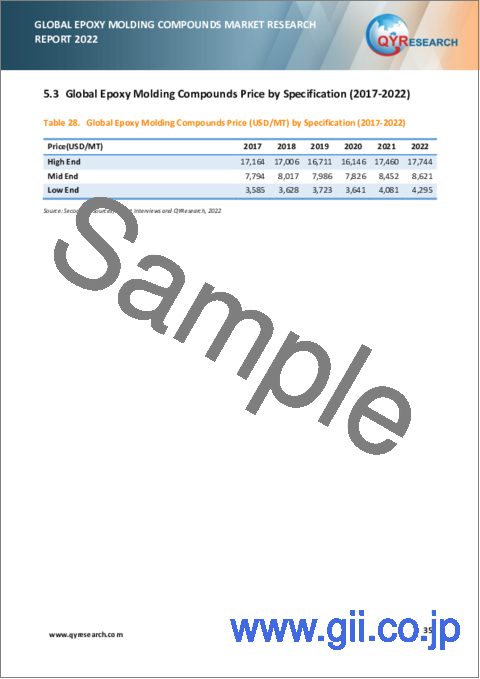
- Table 28. Global Epoxy Molding Compounds Price (USD/MT) by Specification (2017-2022)
- Table 29. Global Epoxy Molding Compounds Production (K MT) by Product (2017-2022)
- Table 30. Global Epoxy Molding Compounds Production Market Share by Product (2017-2022)
- Table 31. Global Epoxy Molding Compounds Revenue (US$ Million) by Product (2017-2022)
- Table 32. Global Epoxy Molding Compounds Revenue Share by Product (2017-2022)
- Table 33. Global Epoxy Molding Compounds Price (USD/MT) by Product (2017-2022)
- Table 34. Sumitomo Bakelite Epoxy Molding Compounds Corporation Information
- Table 35. Sumitomo Bakelite Epoxy Molding Compounds Specification and Application
- Table 36. Sumitomo Bakelite Epoxy Molding Compounds Production Capacity (K MT), Revenue (US$ Million), Price (USD/MT) and Gross Margin (2017-2022)
- Table 37. Showa Denko Epoxy Molding Compounds Corporation Information
- Table 38. Showa Denko Epoxy Molding Compounds Specification and Application
- Table 39. Showa Denko Epoxy Molding Compounds Production Capacity (K MT), Revenue (US$ Million), Price (USD/MT) and Gross Margin (2017-2022)
- Table 40. Chang Chun Group Epoxy Molding Compounds Corporation Information
- Table 41. Chang Chun Group Epoxy Molding Compounds Specification and Application
- Table 42. Chang Chun Group Epoxy Molding Compounds Production Capacity (K MT), Revenue (US$ Million), Price (USD/MT) and Gross Margin (2017-2022)
- Table 43. Hysol Huawei Electronics Epoxy Molding Compounds Corporation Information
- Table 44. Hysol Huawei Electronics Epoxy Molding Compounds Specification and Application
- Table 45. Hysol Huawei Electronics Epoxy Molding Compounds Production Capacity (K MT), Revenue (US$ Million), Price (USD/MT) and Gross Margin (2017-2022)
- Table 46. Panasonic Epoxy Molding Compounds Corporation Information
- Table 47. Panasonic Epoxy Molding Compounds Specification and Application
- Table 48. Panasonic Epoxy Molding Compounds Production Capacity (K MT), Revenue (US$ Million), Price (USD/MT) and Gross Margin (2017-2022)
- Table 49. Kyocera Epoxy Molding Compounds Corporation Information
- Table 50. Kyocera Epoxy Molding Compounds Specification and Application
- Table 51. Kyocera Epoxy Molding Compounds Production Capacity (K MT), Revenue (US$ Million), Price (USD/MT) and Gross Margin (2017-2022)
- Table 52. KCC Epoxy Molding Compounds Corporation Information
- Table 53. KCC Epoxy Molding Compounds Specification and Application
- Table 54. KCC Epoxy Molding Compounds Production Capacity (K MT), Revenue (US$ Million), Price (USD/MT) and Gross Margin (2017-2022)
- Table 55. Samsung SDI Epoxy Molding Compounds Corporation Information
- Table 56. Samsung SDI Epoxy Molding Compounds Specification and Application
- Table 57. Samsung SDI Epoxy Molding Compounds Production Capacity (K MT), Revenue (US$ Million), Price (USD/MT) and Gross Margin (2017-2022)
- Table 58. Eternal Materials Epoxy Molding Compounds Corporation Information
- Table 59. Eternal Materials Epoxy Molding Compounds Specification and Application
- Table 60. Eternal Materials Epoxy Molding Compounds Production Capacity (K MT), Revenue (US$ Million), Price (USD/MT) and Gross Margin (2017-2022)
- Table 61. Jiangsu Zhongpeng New Material Epoxy Molding Compounds Corporation Information
- Table 62. Jiangsu Zhongpeng New Material Epoxy Molding Compounds Specification and Application
- Table 63. Jiangsu Zhongpeng New Material Epoxy Molding Compounds Production Capacity (K MT), Revenue (US$ Million), Price (USD/MT) and Gross Margin (2017-2022)
- Table 64. Shin-Etsu Chemical Epoxy Molding Compounds Corporation Information
- Table 65. Shin-Etsu Chemical Epoxy Molding Compounds Specification and Application
- Table 66. Shin-Etsu Chemical Epoxy Molding Compounds Production Capacity (K MT), Revenue (US$ Million), Price (USD/MT) and Gross Margin (2017-2022)
- Table 67. Nagase ChemteX Corporation Epoxy Molding Compounds Corporation Information
- Table 68. Nagase ChemteX Corporation Epoxy Molding Compounds Specification and Application
- Table 69. Nagase ChemteX Corporation Epoxy Molding Compounds Production Capacity (K MT), Revenue (US$ Million), Price (USD/MT) and Gross Margin (2017-2022)
- Table 70. Tianjin Kaihua Insulating Material Epoxy Molding Compounds Corporation Information
- Table 71. Tianjin Kaihua Insulating Material Epoxy Molding Compounds Specification and Application
- Table 72. Tianjin Kaihua Insulating Material Epoxy Molding Compounds Production Capacity (K MT), Revenue (US$ Million), Price (USD/MT) and Gross Margin (2017-2022)
- Table 73. HHCK Epoxy Molding Compounds Corporation Information
- Table 74. HHCK Epoxy Molding Compounds Specification and Application
- Table 75. HHCK Epoxy Molding Compounds Production Capacity (K MT), Revenue (US$ Million), Price (USD/MT) and Gross Margin (2017-2022)
- Table 76. Scienchem Epoxy Molding Compounds Corporation Information
- Table 77. Scienchem Epoxy Molding Compounds Specification and Application
- Table 78. Scienchem Epoxy Molding Compounds Production Capacity (K MT), Revenue (US$ Million), Price (USD/MT) and Gross Margin (2017-2022)
- Table 79. Beijing Sino-tech Electronic Material Epoxy Molding Compounds Corporation Information
- Table 80. Beijing Sino-tech Electronic Material Epoxy Molding Compounds Specification and Application
- Table 81. Beijing Sino-tech Electronic Material Epoxy Molding Compounds Production Capacity (K MT), Revenue (US$ Million), Price (USD/MT) and Gross Margin (2017-2022)
- Table 82. Production Base and Market Concentration Rate of Raw Material
- Table 83. Key Suppliers of Raw Materials
- Table 84. Cost Analysis of EMC, with comparison of filler maker
- Table 85. Operation profit of EMC, with comparison of filler maker's OP
- Table 86. Global Epoxy Molding Compounds Production Forecast by Type (2023-2028) & (K MT)
- Table 87. Global Epoxy Molding Compounds Revenue Forecast by Type (2023-2028) & (US$ Million)
- Table 88. Global Epoxy Molding Compounds Price Forecast by Type (2023-2028) & (USD/MT)
- Table 89. Global Epoxy Molding Compounds Production Forecast by Application (2023-2028) & (K MT)
- Table 90. Global Epoxy Molding Compounds Revenue Forecast by Application (2023-2028) & (US$ Million)
- Table 91. Global Epoxy Molding Compounds Price Forecast by Application (2023-2028) & (USD/MT)
- Table 92. Global Epoxy Molding Compounds Production Forecast by Specification (2023-2028) & (K MT)
- Table 93. Global Epoxy Molding Compounds Revenue Forecast by Specification (2023-2028) & (US$ Million)
- Table 94. Global Epoxy Molding Compounds Price Forecast by Specification (2023-2028) & (USD/MT)
- Table 95. Global Epoxy Molding Compounds Production Forecast by Product (2023-2028) & (K MT)
- Table 96. Global Epoxy Molding Compounds Revenue Forecast by Product (2023-2028) & (US$ Million)
- Table 97. Global Epoxy Molding Compounds Price Forecast by Product (2023-2028) & (USD/MT)
- Table 98. Research Programs/Design for This Report
- Table 99. Key Data Information from Secondary Sources
- Table 100. Key Data Information from Primary Sources
List of Figures
- Figure 1. Product Picture of Epoxy Molding Compounds
- Figure 2. Global Epoxy Molding Compounds Market Share by Type: 2022 VS 2028
- Figure 3. Solid EMC Product Picture
- Figure 4. Liquid EMC Product Picture
- Figure 5. Liquid EMC Product Picture
- Figure 6. Global Epoxy Molding Compounds Market Share by Application: 2022 VS 2028
- Figure 7. Global Epoxy Molding Compounds Revenue (US$ Million), 2017 VS 2022 VS 2028
- Figure 8. Global Epoxy Molding Compounds Revenue (US$ Million) (2017-2028)
- Figure 9. Global Epoxy Molding Compounds Production Capacity (K MT) & (2017-2028)
- Figure 10. Global Epoxy Molding Compounds Production (K MT) & (2017-2028)
- Figure 11. Epoxy Molding Compounds Production Share by Manufacturers in 2021
- Figure 12. Global Epoxy Molding Compounds Revenue Share by Manufacturers in 2021
- Figure 13. The Global 5 and 10 Largest Players: Market Share by Epoxy Molding Compounds Revenue in 2021
- Figure 14. Production Market Share of Epoxy Molding Compounds by Type (2017-2022)
- Figure 15. Production Market Share of Epoxy Molding Compounds by Type in 2021
- Figure 16. Revenue Share of Epoxy Molding Compounds by Type (2017-2022)
- Figure 17. Revenue Market Share of Epoxy Molding Compounds by Type in 2021
- Figure 18. Production Market Share of Epoxy Molding Compounds by Application (2017-2022)
- Figure 19. Production Market Share of Epoxy Molding Compounds by Application in 2021
- Figure 20. Revenue Share of Epoxy Molding Compounds by Application (2017-2022)
- Figure 21. Revenue Market Share of Epoxy Molding Compounds by Application in 2021
- Figure 22. Production Market Share of Epoxy Molding Compounds by Specification (2017-2022)
- Figure 23. Production Market Share of Epoxy Molding Compounds by Specification in 2021
- Figure 24. Revenue Share of Epoxy Molding Compounds by Specification (2017-2022)
- Figure 25. Revenue Market Share of Epoxy Molding Compounds by Specification in 2021
- Figure 26. Production Market Share of Epoxy Molding Compounds by Product (2017-2022)
- Figure 27. Production Market Share of Epoxy Molding Compounds by Product in 2021
- Figure 28. Revenue Share of Epoxy Molding Compounds by Product (2017-2022)
- Figure 29. Revenue Market Share of Epoxy Molding Compounds by Product in 2021
- Figure 30. Manufacturing Cost Structure of Epoxy Molding Compounds
- Figure 31. Cost of Filler in EMC
- Figure 32. Manufacturing Process Analysis of Epoxy Molding Compounds
- Figure 33. Epoxy Molding Compounds Industrial Chain Analysis
- Figure 34. Global Epoxy Molding Compounds Production Market Share Forecast by Type (2023-2028)
- Figure 35. Global Epoxy Molding Compounds Revenue Market Share Forecast by Type (2023-2028)
- Figure 36. Global Epoxy Molding Compounds Production Market Share Forecast by Application (2023-2028)
- Figure 37. Global Epoxy Molding Compounds Revenue Market Share Forecast by Application (2023-2028)
- Figure 38. Global Epoxy Molding Compounds Production Market Share Forecast by Specification (2023-2028)
- Figure 39. Global Epoxy Molding Compounds Revenue Market Share Forecast by Specification (2023-2028)
- Figure 40. Global Epoxy Molding Compounds Production Market Share Forecast by Product (2023-2028)
- Figure 41. Global Epoxy Molding Compounds Revenue Market Share Forecast by Product (2023-2028)
- Figure 42. Bottom-up and Top-down Approaches for This Report
- Figure 43. Data Triangulation 106
The global Epoxy Molding Compounds market was valued at USD 2,178.04 million in 2021 and is expected to reach USD 3,059.10 million by the end of 2028, growing at a CAGR of 4.46% between 2022 and 2028.
Drivers and Restrains:
The research report has incorporated the analysis of different factors that augment the market's growth. It constitutes trends, restraints, and drivers that transform the market in either a positive or negative manner. This section also provides the scope of different segments and applications that can potentially influence the market in the future. The detailed information is based on current trends and historic milestones. This section also provides an analysis of the volume of production about the global market and about each type from 2017 to 2028. This section mentions the volume of production by region from 2017 to 2028. Pricing analysis is included in the report according to each type from the year 2017 to 2028, manufacturer from 2017 to 2022, region from 2017 to 2022, and global price from 2017 to 2028.
A thorough evaluation of the restrains included in the report portrays the contrast to drivers and gives room for strategic planning. Factors that overshadow the market growth are pivotal as they can be understood to devise different bends for getting hold of the lucrative opportunities that are present in the ever-growing market. Additionally, insights into market expert's opinions have been taken to understand the market better.
Segment Analysis:
The research report includes specific segments by region (country), by manufacturers, by Type and by Application. Each type provides information about the production during the forecast period of 2017 to 2028. by Application segment also provides consumption during the forecast period of 2017 to 2028. Understanding the segments helps in identifying the importance of different factors that aid the market growth.
By Company
- Sumitomo Bakelite
- Hitachi Chemical
- Chang Chun Group
- Hysol Huawei Electronics
- Panasonic
- Kyocera
- KCC
- Samsung SDI
- Eternal Materials
- Jiangsu Zhongpeng New Material
- Shin-Etsu Chemical
- Nagase ChemteX Corporation
- Tianjin Kaihua Insulating Material
- HHCK
- Scienchem
- Beijing Sino-tech Electronic Material
Segment by Type
- Solid EMC
- Liquid EMC
Segment by Application
- Memory
- Non-memory
- Discrete
- Power Module
Production by Region
- North America
- Europe
- China
- Japan
- South Korea
Consumption by Region
- North America
- U.S.
- Canada
- Asia-Pacific
- China
- Japan
- South Korea
- China Taiwan
- Southeast Asia
- India
- Australia
- Europe
- Germany
- France
- U.K.
- Italy
- Russia
- Rest of Europe
- South America
- Mexico
- Brazil
- Rest of South America
TABLE OF CONTENTS
1 EPOXY MOLDING COMPOUNDS MARKET OVERVIEW
- 1.1 PRODUCT OVERVIEW AND SCOPE OF EPOXY MOLDING COMPOUNDS
- 1.2 EPOXY MOLDING COMPOUNDS SEGMENT BY TYPE
- 1.2.1 GLOBAL EPOXY MOLDING COMPOUNDS MARKET SIZE GROWTH RATE ANALYSIS BY TYPE: 2022 VS 2028
- 1.2.2 SOLID EMC
- 1.2.3 LIQUID EMC
- 1.3 EPOXY MOLDING COMPOUNDS SEGMENT BY APPLICATION
- 1.4 GLOBAL MARKET GROWTH PROSPECTS
- 1.4.1 GLOBAL EPOXY MOLDING COMPOUNDS REVENUE ESTIMATES AND FORECASTS (2017-2028)
- 1.4.2 GLOBAL EPOXY MOLDING COMPOUNDS PRODUCTION CAPACITY ESTIMATES AND FORECASTS (2017-2028)
- 1.4.3 GLOBAL EPOXY MOLDING COMPOUNDS PRODUCTION ESTIMATES AND FORECASTS (2017-2028)
2 MARKET COMPETITION BY MANUFACTURERS
- 2.1 GLOBAL EPOXY MOLDING COMPOUNDS PRODUCTION CAPACITY MARKET SHARE BY MANUFACTURERS (2017-2022)
- 2.2 GLOBAL EPOXY MOLDING COMPOUNDS REVENUE MARKET SHARE BY MANUFACTURERS (2017-2022)
- 2.3 EPOXY MOLDING COMPOUNDS MARKET SHARE BY COMPANY TYPE (TIER 1, TIER 2, AND TIER 3)
- 2.4 GLOBAL EPOXY MOLDING COMPOUNDS AVERAGE PRICE BY MANUFACTURERS (2017-2022)
- 2.5 MANUFACTURERS EPOXY MOLDING COMPOUNDS PRODUCTION SITES, AREA SERVED, PRODUCT TYPE
- 2.6 EPOXY MOLDING COMPOUNDS MARKET COMPETITIVE SITUATION AND TRENDS
- 2.6.1 EPOXY MOLDING COMPOUNDS MARKET CONCENTRATION RATE
- 2.6.2 GLOBAL 5 AND 10 LARGEST EPOXY MOLDING COMPOUNDS PLAYERS MARKET SHARE BY REVENUE
- 2.6.3 MERGERS & ACQUISITIONS, EXPANSION
3 SEGMENT BY TYPE
- 3.1 GLOBAL EPOXY MOLDING COMPOUNDS PRODUCTION MARKET SHARE BY TYPE (2017-2022)
- 3.2 GLOBAL EPOXY MOLDING COMPOUNDS REVENUE MARKET SHARE BY TYPE (2017-2022)
- 3.3 GLOBAL EPOXY MOLDING COMPOUNDS PRICE BY TYPE (2017-2022)
4 SEGMENT BY APPLICATION
- 4.1 GLOBAL EPOXY MOLDING COMPOUNDS PRODUCTION MARKET SHARE BY APPLICATION (2017-2022)
- 4.2 GLOBAL EPOXY MOLDING COMPOUNDS REVENUE MARKET SHARE BY APPLICATION (2017-2022)
- 4.3 GLOBAL EPOXY MOLDING COMPOUNDS PRICE BY APPLICATION (2017-2022)
5 SEGMENT BY SPECIFICATION
- 5.1 GLOBAL EPOXY MOLDING COMPOUNDS PRODUCTION MARKET SHARE BY SPECIFICATION (2017-2022)
- 5.2 GLOBAL EPOXY MOLDING COMPOUNDS REVENUE MARKET SHARE BY SPECIFICATION (2017-2022)
- 5.3 GLOBAL EPOXY MOLDING COMPOUNDS PRICE BY SPECIFICATION (2017-2022)
6 SEGMENT BY PRODUCT
- 6.1 GLOBAL EPOXY MOLDING COMPOUNDS PRODUCTION MARKET SHARE BY PRODUCT (2017-2022)
- 6.2 GLOBAL EPOXY MOLDING COMPOUNDS REVENUE MARKET SHARE BY PRODUCT (2017-2022)
- 6.3 GLOBAL EPOXY MOLDING COMPOUNDS PRICE BY PRODUCT (2017-2022)
7 KEY COMPANIES PROFILED
- 7.1 SUMITOMO BAKELITE
- 7.1.1 SUMITOMO BAKELITE EPOXY MOLDING COMPOUNDS CORPORATION INFORMATION
- 7.1.2 SUMITOMO BAKELITE EPOXY MOLDING COMPOUNDS PRODUCT PORTFOLIO
- 7.1.3 SUMITOMO BAKELITE EPOXY MOLDING COMPOUNDS PRODUCTION CAPACITY, REVENUE, PRICE AND GROSS MARGIN (2017-2022)
- 7.1.4 SUMITOMO BAKELITE MAIN BUSINESS AND MARKETS SERVED
- 7.2 SHOWA DENKO
- 7.2.1 SHOWA DENKO EPOXY MOLDING COMPOUNDS CORPORATION INFORMATION
- 7.2.2 SHOWA DENKO EPOXY MOLDING COMPOUNDS PRODUCT PORTFOLIO
- 7.2.3 SHOWA DENKO EPOXY MOLDING COMPOUNDS PRODUCTION CAPACITY, REVENUE, PRICE AND GROSS MARGIN (2017-2022)
- 7.2.4 SHOWA DENKO MAIN BUSINESS AND MARKETS SERVED
- 7.2.5 COMPANY NEWS
- 7.3 CHANG CHUN GROUP
- 7.3.1 CHANG CHUN GROUP EPOXY MOLDING COMPOUNDS CORPORATION INFORMATION
- 7.3.2 CHANG CHUN GROUP EPOXY MOLDING COMPOUNDS PRODUCT PORTFOLIO
- 7.3.3 CHANG CHUN GROUP EPOXY MOLDING COMPOUNDS PRODUCTION CAPACITY, REVENUE, PRICE AND GROSS MARGIN (2017-2022)
- 7.3.4 CHANG CHUN GROUP MAIN BUSINESS AND MARKETS SERVED
- 7.4 HYSOL HUAWEI ELECTRONICS
- 7.4.1 HYSOL HUAWEI ELECTRONICS EPOXY MOLDING COMPOUNDS CORPORATION INFORMATION
- 7.4.2 HYSOL HUAWEI ELECTRONICS EPOXY MOLDING COMPOUNDS PRODUCT PORTFOLIO
- 7.4.3 HYSOL HUAWEI ELECTRONICS EPOXY MOLDING COMPOUNDS PRODUCTION CAPACITY, REVENUE, PRICE AND GROSS MARGIN (2017-2022)
- 7.4.4 HYSOL HUAWEI ELECTRONICS MAIN BUSINESS AND MARKETS SERVED
- 7.5 PANASONIC
- 7.5.1 PANASONIC EPOXY MOLDING COMPOUNDS CORPORATION INFORMATION
- 7.5.2 PANASONIC EPOXY MOLDING COMPOUNDS PRODUCT PORTFOLIO
- 7.5.3 PANASONIC EPOXY MOLDING COMPOUNDS PRODUCTION CAPACITY, REVENUE, PRICE AND GROSS MARGIN (2017-2022)
- 7.5.4 PANASONIC MAIN BUSINESS AND MARKETS SERVED
- 7.6 KYOCERA
- 7.6.1 KYOCERA EPOXY MOLDING COMPOUNDS CORPORATION INFORMATION
- 7.6.2 KYOCERA EPOXY MOLDING COMPOUNDS PRODUCT PORTFOLIO
- 7.6.3 KYOCERA EPOXY MOLDING COMPOUNDS PRODUCTION CAPACITY, REVENUE, PRICE AND GROSS MARGIN (2017-2022)
- 7.6.4 KYOCERA MAIN BUSINESS AND MARKETS SERVED
- 7.7 KCC
- 7.7.1 KCC EPOXY MOLDING COMPOUNDS CORPORATION INFORMATION
- 7.7.2 KCC EPOXY MOLDING COMPOUNDS PRODUCT PORTFOLIO
- 7.7.3 KCC EPOXY MOLDING COMPOUNDS PRODUCTION CAPACITY, REVENUE, PRICE AND GROSS MARGIN (2017-2022)
- 7.7.4 KCC MAIN BUSINESS AND MARKETS SERVED
- 7.8 SAMSUNG SDI
- 7.8.1 SAMSUNG SDI EPOXY MOLDING COMPOUNDS CORPORATION INFORMATION
- 7.8.2 SAMSUNG SDI EPOXY MOLDING COMPOUNDS PRODUCT PORTFOLIO
- 7.8.3 SAMSUNG SDI EPOXY MOLDING COMPOUNDS PRODUCTION CAPACITY, REVENUE, PRICE AND GROSS MARGIN (2017-2022)
- 7.8.4 SAMSUNG SDI MAIN BUSINESS AND MARKETS SERVED
- 7.8.5 COMPANY NEWS
- 7.9 ETERNAL MATERIALS
- 7.9.1 ETERNAL MATERIALS EPOXY MOLDING COMPOUNDS CORPORATION INFORMATION
- 7.9.2 ETERNAL MATERIALS EPOXY MOLDING COMPOUNDS PRODUCT PORTFOLIO
- 7.9.3 ETERNAL MATERIALS EPOXY MOLDING COMPOUNDS PRODUCTION CAPACITY, REVENUE, PRICE AND GROSS MARGIN (2017-2022)
- 7.9.4 ETERNAL MATERIALS MAIN BUSINESS AND MARKETS SERVED
- 7.10 JIANGSU ZHONGPENG NEW MATERIAL
- 7.10.1 JIANGSU ZHONGPENG NEW MATERIAL EPOXY MOLDING COMPOUNDS CORPORATION INFORMATION
- 7.10.2 JIANGSU ZHONGPENG NEW MATERIAL EPOXY MOLDING COMPOUNDS PRODUCT PORTFOLIO
- 7.10.3 JIANGSU ZHONGPENG NEW MATERIAL EPOXY MOLDING COMPOUNDS PRODUCTION CAPACITY, REVENUE, PRICE AND GROSS MARGIN (2017-2022)
- 7.10.4 JIANGSU ZHONGPENG NEW MATERIAL MAIN BUSINESS AND MARKETS SERVED
- 7.11 SHIN-ETSU CHEMICAL
- 7.11.1 SHIN-ETSU CHEMICAL EPOXY MOLDING COMPOUNDS CORPORATION INFORMATION
- 7.11.2 SHIN-ETSU CHEMICAL EPOXY MOLDING COMPOUNDS PRODUCT PORTFOLIO
- 7.11.3 SHIN-ETSU CHEMICAL EPOXY MOLDING COMPOUNDS PRODUCTION CAPACITY, REVENUE, PRICE AND GROSS MARGIN (2017-2022)
- 7.11.4 SHIN-ETSU CHEMICAL MAIN BUSINESS AND MARKETS SERVED
- 7.12 NAGASE CHEMTEX CORPORATION
- 7.12.1 NAGASE CHEMTEX CORPORATION EPOXY MOLDING COMPOUNDS CORPORATION INFORMATION
- 7.12.2 NAGASE CHEMTEX CORPORATION EPOXY MOLDING COMPOUNDS PRODUCT PORTFOLIO
- 7.12.3 NAGASE CHEMTEX CORPORATION EPOXY MOLDING COMPOUNDS PRODUCTION CAPACITY, REVENUE, PRICE AND GROSS MARGIN (2017-2022)
- 7.12.4 NAGASE CHEMTEX CORPORATION MAIN BUSINESS AND MARKETS SERVED
- 7.13 TIANJIN KAIHUA INSULATING MATERIAL
- 7.13.1 TIANJIN KAIHUA INSULATING MATERIAL EPOXY MOLDING COMPOUNDS CORPORATION INFORMATION
- 7.13.2 TIANJIN KAIHUA INSULATING MATERIAL EPOXY MOLDING COMPOUNDS PRODUCT PORTFOLIO
- 7.13.3 TIANJIN KAIHUA INSULATING MATERIAL EPOXY MOLDING COMPOUNDS PRODUCTION CAPACITY, REVENUE, PRICE AND GROSS MARGIN (2017-2022)
- 7.13.4 TIANJIN KAIHUA INSULATING MATERIAL MAIN BUSINESS AND MARKETS SERVED
- 7.14 HHCK
- 7.14.1 HHCK EPOXY MOLDING COMPOUNDS CORPORATION INFORMATION
- 7.14.2 HHCK EPOXY MOLDING COMPOUNDS PRODUCT PORTFOLIO
- 7.14.3 HHCK EPOXY MOLDING COMPOUNDS PRODUCTION CAPACITY, REVENUE, PRICE AND GROSS MARGIN (2017-2022)
- 7.14.4 HHCK MAIN BUSINESS AND MARKETS SERVED
- 7.15 SCIENCHEM
- 7.15.1 SCIENCHEM EPOXY MOLDING COMPOUNDS CORPORATION INFORMATION
- 7.15.2 SCIENCHEM EPOXY MOLDING COMPOUNDS PRODUCT PORTFOLIO
- 7.15.3 SCIENCHEM EPOXY MOLDING COMPOUNDS PRODUCTION CAPACITY, REVENUE, PRICE AND GROSS MARGIN (2017-2022)
- 7.15.4 SCIENCHEM MAIN BUSINESS AND MARKETS SERVED
- 7.16 BEIJING SINO-TECH ELECTRONIC MATERIAL
- 7.16.1 BEIJING SINO-TECH ELECTRONIC MATERIAL EPOXY MOLDING COMPOUNDS CORPORATION INFORMATION
- 7.16.2 BEIJING SINO-TECH ELECTRONIC MATERIAL EPOXY MOLDING COMPOUNDS PRODUCT PORTFOLIO
- 7.16.3 BEIJING SINO-TECH ELECTRONIC MATERIAL EPOXY MOLDING COMPOUNDS PRODUCTION CAPACITY, REVENUE, PRICE AND GROSS MARGIN (2017-2022)
- 7.16.4 BEIJING SINO-TECH ELECTRONIC MATERIAL MAIN BUSINESS AND MARKETS SERVED
8 EPOXY MOLDING COMPOUNDS MANUFACTURING COST ANALYSIS
- 8.1 EPOXY MOLDING COMPOUNDS KEY RAW MATERIALS ANALYSIS
- 8.1.1 KEY RAW MATERIALS
- 8.1.2 KEY SUPPLIERS OF RAW MATERIALS
- 8.2 PROPORTION OF MANUFACTURING COST STRUCTURE
- 8.3 MANUFACTURING PROCESS ANALYSIS OF EPOXY MOLDING COMPOUNDS
- 8.4 EPOXY MOLDING COMPOUNDS INDUSTRIAL CHAIN ANALYSIS
9 FORECAST BY TYPE AND BY APPLICATION
- 9.1 GLOBAL PRODUCTION, REVENUE AND PRICE FORECAST BY TYPE (2023-2028)
- 9.1.1 GLOBAL FORECASTED PRODUCTION OF EPOXY MOLDING COMPOUNDS BY TYPE (2023-2028)
- 9.1.2 GLOBAL FORECASTED REVENUE OF EPOXY MOLDING COMPOUNDS BY TYPE (2023-2028)
- 9.1.3 GLOBAL FORECASTED PRICE OF EPOXY MOLDING COMPOUNDS BY TYPE (2023-2028)
- 9.2 GLOBAL PRODUCTION, REVENUE AND PRICE FORECAST BY APPLICATION (2023-2028)
- 9.2.1 GLOBAL FORECASTED PRODUCTION OF EPOXY MOLDING COMPOUNDS BY APPLICATION (2023-2028)
- 9.2.2 GLOBAL FORECASTED REVENUE OF EPOXY MOLDING COMPOUNDS BY APPLICATION (2023-2028)
- 9.2.3 GLOBAL FORECASTED PRICE OF EPOXY MOLDING COMPOUNDS BY APPLICATION (2023-2028)
- 9.3 GLOBAL PRODUCTION, REVENUE AND PRICE FORECAST BY SPECIFICATION (2023-2028)
- 9.3.1 GLOBAL FORECASTED PRODUCTION OF EPOXY MOLDING COMPOUNDS BY SPECIFICATION (2023-2028)
- 9.3.2 GLOBAL FORECASTED REVENUE OF EPOXY MOLDING COMPOUNDS BY SPECIFICATION (2023-2028)
- 9.3.3 GLOBAL FORECASTED PRICE OF EPOXY MOLDING COMPOUNDS BY SPECIFICATION (2023-2028)
- 9.4 GLOBAL PRODUCTION, REVENUE AND PRICE FORECAST BY PRODUCT (2023-2028)
- 9.4.1 GLOBAL FORECASTED PRODUCTION OF EPOXY MOLDING COMPOUNDS BY PRODUCT (2023-2028)
- 9.4.2 GLOBAL FORECASTED REVENUE OF EPOXY MOLDING COMPOUNDS BY PRODUCT (2023-2028)
- 9.4.3 GLOBAL FORECASTED PRICE OF EPOXY MOLDING COMPOUNDS BY PRODUCT (2023-2028)
10 RESEARCH FINDINGS AND CONCLUSION
11 METHODOLOGY AND DATA SOURCE
- 11.1 METHODOLOGY/RESEARCH APPROACH
- 11.1.1 RESEARCH PROGRAMS/DESIGN
- 11.1.2 MARKET SIZE ESTIMATION
- 11.1.3 MARKET BREAKDOWN AND DATA TRIANGULATION
- 11.2 DATA SOURCE
- 11.2.1 SECONDARY SOURCES
- 11.2.2 PRIMARY SOURCES
- 11.3 AUTHOR LIST
- 11.4 DISCLAIMER