|
|
市場調査レポート
商品コード
1078328
プラチナインゴットの世界市場:2022年Global Platinum Ingots Market Research Report 2022 |
||||||
|
|
|||||||
|
● お客様のご希望に応じて、既存データの加工や未掲載情報(例:国別セグメント)の追加などの対応が可能です。 詳細はお問い合わせください。 |
|||||||


| プラチナインゴットの世界市場:2022年 |
|
出版日: 2022年05月26日
発行: QYResearch
ページ情報: 英文 118 Pages
納期: 2~3営業日
|
- 全表示
- 概要
- 図表
- 目次
世界のプラチナインゴットの市場規模は、2022年の推定63億2,300万米ドルから、2028年までに84億3,100万米ドルに達し、2022年~2028年の予測期間中のCAGRで4.48%の成長が予測されています。
当レポートでは、世界のプラチナインゴット市場について調査分析し、市場の成長に影響を与える要因分析、セグメント別の市場分析、生産予測と消費予測 (2017年~2028年) に焦点を当てて、最新の情報を提供しています。
目次
第1章 プラチナインゴット市場概要
- プラチナインゴットの製品概要と範囲
- プラチナインゴットのセグメント:タイプ別
- プラチナインゴットのセグメント:用途別
- 世界のプラチナインゴットの市場規模の成長率分析:用途別
- 自動車用触媒
- ジュエリー
- 工業
- 投資
- 世界市場の成長の見通し
- 世界の市場規模:地域別
第2章 市場競合:メーカー別
- 世界のプラチナインゴットの生産能力の市場シェア:メーカー別
- 世界のプラチナインゴットの収益の市場シェア:メーカー別
- プラチナインゴットの市場シェア:企業タイプ別 (ティア1、ティア2、ティア3)
- 世界のプラチナインゴットの平均価格:メーカー別
- プラチナインゴットのメーカーの生産拠点・提供エリア・製品タイプ
- プラチナインゴット市場の競合状況と動向
第3章 生産能力:地域別
- 世界のプラチナインゴットの生産の市場シェア:地域別
- 世界のプラチナインゴットの収益の市場シェア:地域別
- 世界のプラチナインゴットの生産・収益・価格・売上総利益
- 南アフリカのプラチナインゴットの生産
- ロシアのプラチナインゴットの生産
- ジンバブエのプラチナインゴットの生産
- カナダのプラチナインゴットの生産
- 米国のプラチナインゴットの生産
第4章 プラチナインゴットの消費:地域別
- 世界のプラチナインゴットの消費:地域別
- 北米
- 欧州
- アジア太平洋地域
- ラテンアメリカ
第5章 セグメント:タイプ別
- 世界のプラチナインゴットの生産の市場シェア:タイプ別
- 世界のプラチナインゴットの収益の市場シェア:タイプ別
- 世界のプラチナインゴットの価格:タイプ別
第6章 セグメント:用途別
- 世界のプラチナインゴットの生産の市場シェア:用途別
- 世界のプラチナインゴットの収益の市場シェア:用途別
- 世界のプラチナインゴットの価格:用途別
第7章 主要企業プロファイル
- ANGLO AMERICAN PLATINUM (ANGPY)
- IMPALA PLATINUM
- SBYSF
- NORTHAM PLATINUM
- NORNICKEL
- HERAEUS
- AMERICAN ELEMENTS
- SINO-PLATINUM METALS
- JIANGSU BGRIMM METAL RECYCLING
第8章 プラチナインゴットの製造コスト分析
- プラチナインゴットの主要原材料分析
- プラチナインゴットの製造プロセス分析
- プラチナインゴットの業界チェーン分析
第9章 マーケティングチャネル・ディストリビューター・顧客
- マーケティングチャネル
- プラチナインゴットのディストリビューターリスト
- プラチナインゴットの顧客
第10章 プラチナインゴットの市場力学
- プラチナインゴットの業界動向と促進要因
- プラチナインゴットの市場課題と抑制要因
第11章 生産・供給予測
- 世界のプラチナインゴットの生産予測:地域別
- 南アフリカのプラチナインゴットの生産・収益予測
- ロシアのプラチナインゴットの生産・収益予測
- ジンバブエのプラチナインゴットの生産・収益予測
- カナダのプラチナインゴットの生産・収益予測
- 米国のプラチナインゴットの生産・収益予測
第12章 消費・需要予測
- 世界のプラチナインゴットの需要分析予測
- 北米のプラチナインゴットの消費予測:国別
- 欧州のプラチナインゴットの消費予測:国別
- アジア太平洋地域のプラチナインゴットの消費予測:地域別
- ラテンアメリカのプラチナインゴットの消費予測:国別
第13章 予測:タイプ別・用途別
- 世界の生産・収益・価格予測:タイプ別
- 世界の生産・収益・価格予測:用途別
第14章 調査結果と結論
第15章 調査手法とデータソース
LIST OF TABLES
- Table 1. Global Platinum Ingots Market Size by Type (K oz) & (US$ Million) & (2022 VS 2028)
- Table 2. Global Platinum Ingots Market Size by Application (K oz) & (US$ Million) & (2022 VS 2028)
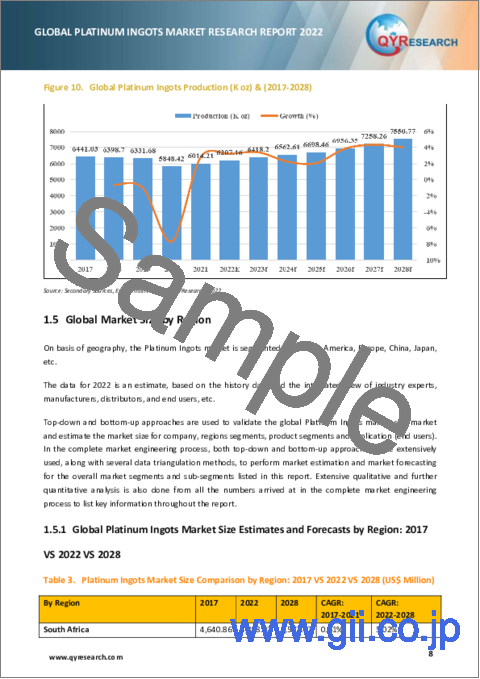
- Table 3. Platinum Ingots Market Size Comparison by Region: 2017 VS 2022 VS 2028 (US$ Million)
- Table 4. Platinum Ingots Market Size Comparison by Region: 2017 VS 2022 VS 2028 (US$ Million)
- Table 5. Global Platinum Ingots Production Capacity (K oz) by Manufacturers in 2021
- Table 6. Global Platinum Ingots Production by Manufacturers (2017-2022) & (K oz)
- Table 7. Global Platinum Ingots Production Market Share by Manufacturers (2017-2022)
- Table 8. Global Platinum Ingots Revenue by Manufacturers (2017-2022) & (US$ Million)
- Table 9. Global Platinum Ingots Revenue Share by Manufacturers (2017-2022)
- Table 10. Company Type (Tier 1, Tier 2, and Tier 3) & (based on the Revenue in Platinum Ingots as of 2021)
- Table 11. Global Market Platinum Ingots Average Price (USD/oz) of Key Manufacturers (2017-2022)
- Table 12. Manufacturers Platinum Ingots Production Sites and Area Served
- Table 13. Manufacturers Platinum Ingots Product Type
- Table 14. Global Platinum Ingots Manufacturers Market Concentration Ratio (CR5 and HHI)
- Table 15. Mergers & Acquisitions, Expansion Plans
- Table 16. Global Platinum Ingots Production (K oz) by Region (2017-2022)
- Table 17. Global Platinum Ingots Production (K oz) Share by Region (2017-2022)
- Table 18. Global Platinum Ingots Revenue (US$ Million) by Region (2017-2022)
- Table 19. Global Platinum Ingots Revenue Market Share by Region (2017-2022)
- Table 20. Global Platinum Ingots Production Capacity (K oz), Revenue (US$ Million), Price (USD/oz) and Gross Margin (2017-2022)
- Table 21. South Africa Platinum Ingots Production (K oz), Revenue (US$ Million), Price (USD/oz) and Gross Margin (2017-2022)
- Table 22. Russia Platinum Ingots Production (K oz), Revenue (US$ Million), Price (USD/oz) and Gross Margin (2017-2022)
- Table 23. Zimbabwe Platinum Ingots Production (K oz), Revenue (US$ Million), Price (USD/oz) and Gross Margin (2017-2022)
- Table 24. Canada Platinum Ingots Production (K oz), Revenue (US$ Million), Price (USD/oz) and Gross Margin (2017-2022)
- Table 25. U.S. Platinum Ingots Production (K oz), Revenue (US$ Million), Price (USD/oz) and Gross Margin (2017-2022)
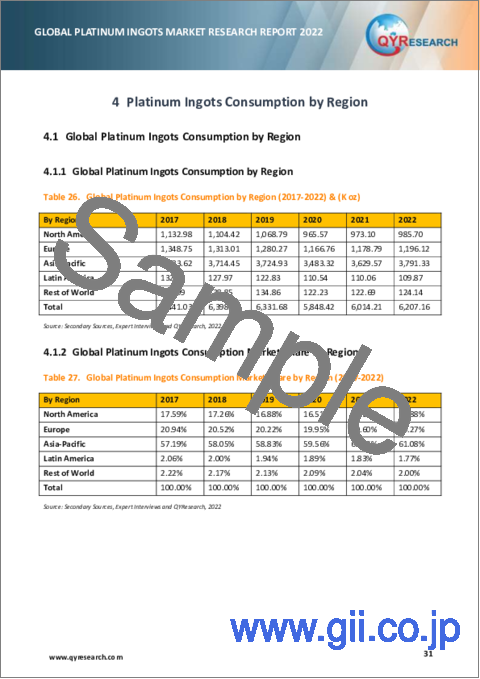
- Table 26. Global Platinum Ingots Consumption by Region (2017-2022) & (K oz)
- Table 27. Global Platinum Ingots Consumption Market Share by Region (2017-2022)
- Table 28. North America Platinum Ingots Consumption by Country (2017-2022) & (K oz)
- Table 29. Europe Platinum Ingots Consumption by Country (2017-2022) & (K oz)
- Table 30. Asia Pacific Platinum Ingots Consumption by Region (2017-2022) & (K oz)
- Table 31. Latin America Platinum Ingots Consumption by Country (2017-2022) & (K oz)
- Table 32. Global Platinum Ingots Production (K oz) by Type (2017-2022)
- Table 33. Global Platinum Ingots Production Market Share by Type (2017-2022)
- Table 34. Global Platinum Ingots Revenue (US$ Million) by Type (2017-2022)
- Table 35. Global Platinum Ingots Revenue Share by Type (2017-2022)
- Table 36. Global Platinum Ingots Price (USD/oz) by Type (2017-2022)
- Table 37. Global Platinum Ingots Production (K oz) by Application (2017-2022)
- Table 38. Global Platinum Ingots Production Market Share by Application (2017-2022)
- Table 39. Global Platinum Ingots Revenue (US$ Million) by Application (2017-2022)
- Table 40. Global Platinum Ingots Revenue Share by Application (2017-2022)
- Table 41. Global Platinum Ingots Price (USD/oz) by Application (2017-2022)
- Table 42. Anglo American Platinum (ANGPY) Platinum Ingots Corporation Information
- Table 43. Anglo American Platinum (ANGPY) Platinum Ingots Global Market Share, Revenue (US$ Million), Price (USD/oz) and Gross Margin (2017-2022)
- Table 44. Anglo American Platinum (ANGPY) Recent Developments/Updates
- Table 45. Impala Platinum Platinum Ingots Corporation Information
- Table 46. Impala Platinum Platinum Ingots Global Market Share, Revenue (US$ Million), Price (USD/oz) and Gross Margin (2017-2022)
- Table 47. Impala Platinum Recent Developments/Updates
- Table 48. SBYSF Platinum Ingots Corporation Information
- Table 49. SBYSF Platinum Ingots Global Market Share, Revenue (US$ Million), Price (USD/oz) and Gross Margin (2017-2022)
- Table 50. SBYSF Recent Developments/Updates
- Table 51. Northam Platinum Platinum Ingots Corporation Information
- Table 52. Northam Platinum Platinum Ingots Global Market Share, Revenue (US$ Million), Price (USD/oz) and Gross Margin (2017-2022)
- Table 53. Northam Platinum Recent Developments/Updates
- Table 54. Nornickel Platinum Ingots Corporation Information
- Table 55. Nornickel Platinum Ingots Specification and Application
- Table 56. Nornickel Platinum Ingots Global Market Share, Revenue (US$ Million), Price (USD/oz) and Gross Margin (2017-2022)
- Table 57. Nornickel Recent Developments/Updates
- Table 58. Heraeus Platinum Ingots Corporation Information
- Table 59. Heraeus Platinum Ingots Specification and Application
- Table 60. Heraeus Platinum Ingots Global Market Share, Revenue (US$ Million), Price (USD/oz) and Gross Margin (2017-2022)
- Table 61. American Elements Platinum Ingots Corporation Information
- Table 62. American Elements Platinum Ingots Specification and Application
- Table 63. American Elements Platinum Ingots Global Market Share, Revenue (US$ Million), Price (USD/oz) and Gross Margin (2017-2022)
- Table 64. Sino-Platinum Metals Platinum Ingots Corporation Information
- Table 65. Sino-Platinum Metals Platinum Ingots Specification and Application
- Table 66. Sino-Platinum Metals Platinum Ingots Global Market Share, Revenue (US$ Million), Price (USD/oz) and Gross Margin (2017-2022)
- Table 67. Jiangsu BGRIMM Metal Recycling Platinum Ingots Corporation Information
- Table 68. Jiangsu BGRIMM Metal Recycling Platinum Ingots Global Market Share, Revenue (US$ Million), Price (USD/oz) and Gross Margin (2017-2022)
- Table 69. Key Suppliers of Raw Materials
- Table 70. Platinum Ingots Distributors List
- Table 71. Global Platinum Ingots Production (K oz) Forecast by Region (2023-2028)
- Table 72. North America Platinum Ingots Consumption Forecast by Country (2023-2028) & (K oz)
- Table 73. Europe Platinum Ingots Consumption Forecast by Country (2023-2028) & (K oz)
- Table 74. Asia Pacific Platinum Ingots Consumption Forecast by Region (2023-2028) & (K oz)
- Table 75. Latin America Platinum Ingots Consumption Forecast by Country (2023-2028) & (K oz)
- Table 76. Global Platinum Ingots Production Forecast by Type (2023-2028) & (K oz)
- Table 77. Global Platinum Ingots Revenue Forecast by Type (2023-2028) & (US$ Million)
- Table 78. Global Platinum Ingots Price Forecast by Type (2023-2028) & (USD/oz)
- Table 79. Global Platinum Ingots Production Forecast by Application (2023-2028) & (K oz)
- Table 80. Global Platinum Ingots Revenue Forecast by Application (2023-2028) & (US$ Million)
- Table 81. Global Platinum Ingots Price Forecast by Application (2023-2028) & (USD/oz)
- Table 82. Research Programs/Design for This Report
- Table 83. Key Data Information from Secondary Sources
- Table 84. Key Data Information from Primary Sources
List of Figures
- Figure 1. Product Picture of Platinum Ingots
- Figure 2. Global Platinum Ingots Market Share by Type: 2022 VS 2028
- Figure 3. Global Platinum Ingots Market Share by Application: 2022 VS 2028
- Figure 4. Automotive Catalysts
- Figure 5. Jewelry
- Figure 6. Industrial
- Figure 7. Global Platinum Ingots Revenue (US$ Million), 2017 VS 2022 VS 2028
- Figure 8. Global Platinum Ingots Revenue (US$ Million) (2017-2028)
- Figure 9. Global Platinum Ingots Production Capacity (K oz) & (2017-2028)
- Figure 10. Global Platinum Ingots Production (K oz) & (2017-2028)
- Figure 11. South Africa Platinum Ingots Revenue (US$ Million) Growth Rate (2017-2028)
- Figure 12. Russia Platinum Ingots Revenue (US$ Million) Growth Rate (2017-2028)
- Figure 13. Zimbabwe Platinum Ingots Revenue (US$ Million) Growth Rate (2017-2028)
- Figure 14. Canada Platinum Ingots Revenue (US$ Million) Growth Rate (2017-2028)
- Figure 15. U.S. Platinum Ingots Revenue (US$ Million) Growth Rate (2017-2028)
- Figure 16. Platinum Ingots Production Share by Manufacturers in 2021
- Figure 17. Global Platinum Ingots Revenue Share by Manufacturers in 2021
- Figure 18. Platinum Ingots Market Share by Company Type (Tier 1, Tier 2, and Tier 3): 2017 VS 2021
- Figure 19. The Global 5 and 10 Largest Players: Market Share by Platinum Ingots Revenue in 2021
- Figure 20. Global Platinum Ingots Production Market Share by Region (2017-2022)
- Figure 21. South Africa Platinum Ingots Production (K oz) Growth Rate (2017-2022)
- Figure 22. Russia Platinum Ingots Production (K oz) Growth Rate (2017-2022)
- Figure 23. Zimbabwe Platinum Ingots Production (K oz) Growth Rate (2017-2022)
- Figure 24. Canada Platinum Ingots Production (K oz) Growth Rate (2017-2022)
- Figure 25. U.S. Platinum Ingots Production (K oz) Growth Rate (2017-2022)
- Figure 26. Global Platinum Ingots Consumption Market Share by Region (2017-2022)
- Figure 27. North America Platinum Ingots Consumption and Growth Rate (2017-2022) & (K oz)
- Figure 28. North America Platinum Ingots Consumption Market Share by Country in 2021
- Figure 29. U.S. Platinum Ingots Consumption and Growth Rate (2017-2022) & (K oz)
- Figure 30. Canada Platinum Ingots Consumption (K oz) and Growth Rate (2017-2022)
- Figure 31. Europe Platinum Ingots Consumption and Growth Rate (2017-2022) & (K oz)
- Figure 32. Europe Platinum Ingots Consumption Market Share by Country in 2021
- Figure 33. Germany Platinum Ingots Consumption and Growth Rate (2017-2022) & (K oz)
- Figure 34. France Platinum Ingots Consumption and Growth Rate (2017-2022) & (K oz)
- Figure 35. U.K. Platinum Ingots Consumption and Growth Rate (2017-2022) & (K oz)
- Figure 36. Italy Platinum Ingots Consumption and Growth Rate (2017-2022) & (K oz)
- Figure 37. Russia Platinum Ingots Consumption and Growth Rate (2017-2022) & (K oz)
- Figure 38. Asia Pacific Platinum Ingots Consumption and Growth Rate (K oz)
- Figure 39. Asia Pacific Platinum Ingots Consumption Market Share by Region in 2021
- Figure 40. China Platinum Ingots Consumption and Growth Rate (2017-2022) & (K oz)
- Figure 41. Japan Platinum Ingots Consumption and Growth Rate (2017-2022) & (K oz)
- Figure 42. South Korea Platinum Ingots Consumption and Growth Rate (2017-2022) & (K oz)
- Figure 43. China Taiwan Platinum Ingots Consumption and Growth Rate (2017-2022) & (K oz)
- Figure 44. Southeast Asia Platinum Ingots Consumption and Growth Rate (2017-2022) & (K oz)
- Figure 45. India Platinum Ingots Consumption and Growth Rate (2017-2022) & (K oz)
- Figure 46. Australia Platinum Ingots Consumption and Growth Rate (2017-2022) & (K oz)
- Figure 47. Latin America Platinum Ingots Consumption and Growth Rate (K oz)
- Figure 48. Latin America Platinum Ingots Consumption Market Share by Country in 2021
- Figure 49. Mexico Platinum Ingots Consumption and Growth Rate (2017-2022) & (K oz)
- Figure 50. Brazil Platinum Ingots Consumption and Growth Rate (2017-2022) & (K oz)
- Figure 51. Production Market Share of Platinum Ingots by Type (2017-2022)
- Figure 52. Production Market Share of Platinum Ingots by Type in 2021
- Figure 53. Revenue Share of Platinum Ingots by Type (2017-2022)
- Figure 54. Revenue Market Share of Platinum Ingots by Type in 2021
- Figure 55. Production Market Share of Platinum Ingots by Application (2017-2022)
- Figure 56. Production Market Share of Platinum Ingots by Application in 2021
- Figure 57. Revenue Share of Platinum Ingots by Application (2017-2022)
- Figure 58. Revenue Market Share of Platinum Ingots by Application in 2021
- Figure 59. Impala Platinum Mine distribution Picture
- Figure 60. Northam Platinum Mine Distribution Picture
- Figure 61. Heraeus Platinum Ingots Picture
- Figure 62. Sino-Platinum Metals Platinum Ingots Picture
- Figure 63. Jiangsu BGRIMM Metal Recycling Platinum Ingots Product Picture
- Figure 64. Manufacturing Process Analysis of Platinum Ingots
- Figure 65. Platinum Ingots Industrial Chain Analysis
- Figure 66. Channels of Distribution
- Figure 67. Distributors Profiles
- Figure 68. Global Platinum Ingots Production Market Share Forecast by Region (2023-2028)
- Figure 69. South Africa Platinum Ingots Production (K oz) Growth Rate Forecast (2023-2028)
- Figure 70. Russia Platinum Ingots Production (K oz) Growth Rate Forecast (2023-2028)
- Figure 71. Zimbabwe Platinum Ingots Production (K oz) Growth Rate Forecast (2023-2028)
- Figure 72. Canada Platinum Ingots Production (K oz) Growth Rate Forecast (2023-2028)
- Figure 73. U.S. Platinum Ingots Production (K oz) Growth Rate Forecast (2023-2028)
- Figure 74. Global Forecasted Demand Analysis of Platinum Ingots (2023-2028) & (K oz)
- Figure 75. Global Platinum Ingots Production Market Share Forecast by Type (2023-2028)
- Figure 76. Global Platinum Ingots Revenue Market Share Forecast by Type (2023-2028)
- Figure 77. Global Platinum Ingots Production Market Share Forecast by Application (2023-2028)
- Figure 78. Global Platinum Ingots Revenue Market Share Forecast by Application (2023-2028)
- Figure 79. Bottom-up and Top-down Approaches for This Report
- Figure 80. Data Triangulation
Due to the COVID-19 pandemic, the global Platinum Ingots market size is estimated to be worth US$ 6323 million in 2022 and is forecast to a readjusted size of US$ 8431 million by 2028 with a CAGR of 4.48% during the forecast period 2022-2028. Fully considering the economic change by this health crisis, 99.95% accounting for 61.3% of the Platinum Ingots global market in 2021, is projected to value US$ 1078 million by 2028, growing at a revised 4.42% CAGR from 2022 to 2028. While Automotive Catalysts segment is altered to an 4.53 % CAGR throughout this forecast period.
South Africa Platinum Ingots market size was US$ 4754 million in 2021, while Russia was US$ 511 million. The proportion of the South Africa was 75% in 2021, while Russia percentage was 8%, and it is predicted that Russia market share will reach 6% in 2028, trailing a CAGR of 0.04 % through the analysis period.
The global major manufacturers of Platinum Ingots include Nornickel, Anglo American Platinum (ANGPY), Impala Platinum, SBYSF, Northam Platinum, Heraeus, and etc. In terms of revenue, the global three largest players hold a 65% market share of Platinum Ingots in 2021.
Palladium supplies are likely to remain tight until at least 2025, after which prices are expected to fall to around $1,500 an ounce. We believe that the palladium market will be in substantial contraction until 2025. In the long term, we do not see palladium prices staying above $2,000 an ounce, and likely to fall to around $1,500, and we expect platinum prices to rise sharply. Platinum prices could rise to $2,500 to $2,700 an ounce from 2025 as automakers switch to using more platinum.
Drivers and Restrains:
The research report has incorporated the analysis of different factors that augment the market's growth. It constitutes trends, restraints, and drivers that transform the market in either a positive or negative manner. This section also provides the scope of different segments and applications that can potentially influence the market in the future. The detailed information is based on current trends and historic milesK ozes. This section also provides an analysis of the volume of production about the global market and about each type from 2017 to 2028. This section mentions the volume of production by region from 2017 to 2028. Pricing analysis is included in the report according to each type from the year 2017 to 2028, manufacturer from 2017 to 2022, region from 2017 to 2022, and global price from 2017 to 2028.
A thorough evaluation of the restrains included in the report portrays the contrast to drivers and gives room for strategic planning. Factors that overshadow the market growth are pivotal as they can be understood to devise different bends for getting hold of the lucrative opportunities that are present in the ever-growing market. Additionally, insights into market expert's opinions have been taken to understand the market better.
Segment Analysis:
The research report includes specific segments by region (country), by manufacturers, by Type and by Application. Each type provides information about the production during the forecast period of 2017 to 2028. by Application segment also provides consumption during the forecast period of 2017 to 2028. Understanding the segments helps in identifying the importance of different factors that aid the market growth.
By Company
- Anglo American Platinum (ANGPY)
- Impala Platinum
- SBYSF
- Northam Platinum
- Nornickel
- Heraeus
- American Elements
- Sino-Platinum Metals
- Jiangsu BGRIMM Metal Recycling
Segment by Type
- 99.95%
- 99.99%
Segment by Application
- Automotive Catalysts
- Jewelry
- Industrial
- Investments
Production by Region
- South Africa
- Russia
- Zimbabwe
- Canada
- U.S.
Consumption by Region
- North America
- U.S.
- Canada
- Asia-Pacific
- China
- Japan
- South Korea
- China Taiwan
- Southeast Asia
- India
- Australia
- Europe
- Germany
- France
- U.K.
- Italy
- Russia
- Rest of Europe
- South America
- Mexico
- Brazil
- Rest of South America
TABLE OF CONTENTS
1 PLATINUM INGOTS MARKET OVERVIEW
- 1.1 PRODUCT OVERVIEW AND SCOPE OF PLATINUM INGOTS
- 1.2 PLATINUM INGOTS SEGMENT BY TYPE
- 1.3 PLATINUM INGOTS SEGMENT BY APPLICATION
- 1.3.1 GLOBAL PLATINUM INGOTS MARKET SIZE GROWTH RATE ANALYSIS BY APPLICATION: 2022 VS 2028
- 1.3.2 AUTOMOTIVE CATALYSTS
- 1.3.3 JEWELRY
- 1.3.4 INDUSTRIAL
- 1.3.5 INVESTMENTS
- 1.4 GLOBAL MARKET GROWTH PROSPECTS
- 1.4.1 GLOBAL PLATINUM INGOTS REVENUE ESTIMATES AND FORECASTS (2017-2028)
- 1.4.2 GLOBAL PLATINUM INGOTS PRODUCTION CAPACITY ESTIMATES AND FORECASTS (2017-2028)
- 1.4.3 GLOBAL PLATINUM INGOTS PRODUCTION ESTIMATES AND FORECASTS (2017-2028)
- 1.5 GLOBAL MARKET SIZE BY REGION
- 1.5.1 GLOBAL PLATINUM INGOTS MARKET SIZE ESTIMATES AND FORECASTS BY REGION: 2017 VS 2022 VS 2028
- 1.5.2 SOUTH AFRICA PLATINUM INGOTS ESTIMATES AND FORECASTS (2017-2028)
- 1.5.3 RUSSIA PLATINUM INGOTS ESTIMATES AND FORECASTS (2017-2028)
- 1.5.4 ZIMBABWE PLATINUM INGOTS ESTIMATES AND FORECASTS (2017-2028)
- 1.5.5 CANADA PLATINUM INGOTS ESTIMATES AND FORECASTS (2017-2028)
- 1.5.6 U.S. PLATINUM INGOTS ESTIMATES AND FORECASTS (2017-2028)
2 MARKET COMPETITION BY MANUFACTURERS
- 2.1 GLOBAL PLATINUM INGOTS PRODUCTION CAPACITY MARKET SHARE BY MANUFACTURERS (2017-2022)
- 2.2 GLOBAL PLATINUM INGOTS REVENUE MARKET SHARE BY MANUFACTURERS (2017-2022)
- 2.3 PLATINUM INGOTS MARKET SHARE BY COMPANY TYPE (TIER 1, TIER 2, AND TIER 3)
- 2.4 GLOBAL PLATINUM INGOTS AVERAGE PRICE BY MANUFACTURERS (2017-2022)
- 2.5 MANUFACTURERS PLATINUM INGOTS PRODUCTION SITES, AREA SERVED, PRODUCT TYPE
- 2.6 PLATINUM INGOTS MARKET COMPETITIVE SITUATION AND TRENDS
- 2.6.1 PLATINUM INGOTS MARKET CONCENTRATION RATE
- 2.6.2 GLOBAL 5 AND 10 LARGEST PLATINUM INGOTS PLAYERS MARKET SHARE BY REVENUE
- 2.6.3 MERGERS & ACQUISITIONS, EXPANSION
3 PRODUCTION CAPACITY BY REGION
- 3.1 GLOBAL PRODUCTION OF PLATINUM INGOTS MARKET SHARE BY REGION (2017-2022)
- 3.2 GLOBAL PLATINUM INGOTS REVENUE MARKET SHARE BY REGION (2017-2022)
- 3.3 GLOBAL PLATINUM INGOTS PRODUCTION CAPACITY, REVENUE, PRICE AND GROSS MARGIN (2017-2022)
- 3.4 SOUTH AFRICA PLATINUM INGOTS PRODUCTION
- 3.4.1 SOUTH AFRICA PLATINUM INGOTS PRODUCTION GROWTH RATE (2017-2022)
- 3.4.2 SOUTH AFRICA PLATINUM INGOTS PRODUCTION, REVENUE, PRICE AND GROSS MARGIN (2017-2022)
- 3.5 RUSSIA PLATINUM INGOTS PRODUCTION
- 3.5.1 RUSSIA PLATINUM INGOTS PRODUCTION GROWTH RATE (2017-2022)
- 3.5.2 RUSSIA PLATINUM INGOTS PRODUCTION, REVENUE, PRICE AND GROSS MARGIN (2017-2022)
- 3.6 ZIMBABWE PLATINUM INGOTS PRODUCTION (2017-2022)
- 3.6.1 ZIMBABWE PLATINUM INGOTS PRODUCTION GROWTH RATE (2017-2022)
- 3.6.2 ZIMBABWE PLATINUM INGOTS PRODUCTION, REVENUE, PRICE AND GROSS MARGIN (2017-2022)
- 3.7 CANADA PLATINUM INGOTS PRODUCTION (2017-2022)
- 3.7.1 CANADA PLATINUM INGOTS PRODUCTION GROWTH RATE (2017-2022)
- 3.7.2 CANADA PLATINUM INGOTS PRODUCTION, REVENUE, PRICE AND GROSS MARGIN (2017-2022)
- 3.8 U.S. PLATINUM INGOTS PRODUCTION (2017-2022)
- 3.8.1 U.S. PLATINUM INGOTS PRODUCTION GROWTH RATE (2017-2022)
- 3.8.2 U.S. PLATINUM INGOTS PRODUCTION, REVENUE, PRICE AND GROSS MARGIN (2017-2022)
4 PLATINUM INGOTS CONSUMPTION BY REGION
- 4.1 GLOBAL PLATINUM INGOTS CONSUMPTION BY REGION
- 4.1.1 GLOBAL PLATINUM INGOTS CONSUMPTION BY REGION
- 4.1.2 GLOBAL PLATINUM INGOTS CONSUMPTION MARKET SHARE BY REGION
- 4.2 NORTH AMERICA
- 4.2.1 NORTH AMERICA PLATINUM INGOTS CONSUMPTION BY COUNTRY
- 4.2.2 U.S.
- 4.2.3 CANADA
- 4.3 EUROPE
- 4.3.1 EUROPE PLATINUM INGOTS CONSUMPTION BY COUNTRY
- 4.3.2 GERMANY
- 4.3.3 FRANCE
- 4.3.4 U.K.
- 4.3.5 ITALY
- 4.3.6 RUSSIA
- 4.4 ASIA PACIFIC
- 4.4.1 ASIA PACIFIC PLATINUM INGOTS CONSUMPTION BY REGION
- 4.4.2 CHINA
- 4.4.3 JAPAN
- 4.4.4 SOUTH KOREA
- 4.4.5 CHINA TAIWAN
- 4.4.6 SOUTHEAST ASIA
- 4.4.7 INDIA
- 4.4.8 AUSTRALIA
- 4.5 LATIN AMERICA
- 4.5.1 LATIN AMERICA PLATINUM INGOTS CONSUMPTION BY COUNTRY
- 4.5.2 MEXICO
- 4.5.3 BRAZIL
5 SEGMENT BY TYPE
- 5.1 GLOBAL PLATINUM INGOTS PRODUCTION MARKET SHARE BY TYPE (2017-2022)
- 5.2 GLOBAL PLATINUM INGOTS REVENUE MARKET SHARE BY TYPE (2017-2022)
- 5.3 GLOBAL PLATINUM INGOTS PRICE BY TYPE (2017-2022)
6 SEGMENT BY APPLICATION
- 6.1 GLOBAL PLATINUM INGOTS PRODUCTION MARKET SHARE BY APPLICATION (2017-2022)
- 6.2 GLOBAL PLATINUM INGOTS REVENUE MARKET SHARE BY APPLICATION (2017-2022)
- 6.3 GLOBAL PLATINUM INGOTS PRICE BY APPLICATION (2017-2022)
7 KEY COMPANIES PROFILED
- 7.1 ANGLO AMERICAN PLATINUM (ANGPY)
- 7.1.1 ANGLO AMERICAN PLATINUM (ANGPY) PLATINUM INGOTS CORPORATION INFORMATION
- 7.1.2 ANGLO AMERICAN PLATINUM (ANGPY) PLATINUM INGOTS PRODUCTION CAPACITY, REVENUE, PRICE AND GROSS MARGIN (2017-2022)
- 7.1.3 ANGLO AMERICAN PLATINUM (ANGPY) MAIN BUSINESS AND MARKETS SERVED
- 7.1.4 ANGLO AMERICAN PLATINUM (ANGPY) RECENT DEVELOPMENTS/UPDATES
- 7.2 IMPALA PLATINUM
- 7.2.1 IMPALA PLATINUM PLATINUM INGOTS CORPORATION INFORMATION
- 7.2.2 IMPALA PLATINUM PLATINUM INGOTS PRODUCTION CAPACITY, REVENUE, PRICE AND GROSS MARGIN (2017-2022)
- 7.2.3 IMPALA PLATINUM MAIN BUSINESS AND MARKETS SERVED
- 7.2.4 IMPALA PLATINUM RECENT DEVELOPMENTS/UPDATES
- 7.3 SBYSF
- 7.3.1 SBYSF PLATINUM INGOTS CORPORATION INFORMATION
- 7.3.2 SBYSF PLATINUM INGOTS PRODUCTION CAPACITY, REVENUE, PRICE AND GROSS MARGIN (2017-2022)
- 7.3.3 SBYSF MAIN BUSINESS AND MARKETS SERVED
- 7.3.4 SBYSF RECENT DEVELOPMENTS/UPDATES
- 7.4 NORTHAM PLATINUM
- 7.4.1 NORTHAM PLATINUM PLATINUM INGOTS CORPORATION INFORMATION
- 7.4.2 NORTHAM PLATINUM PLATINUM INGOTS PRODUCTION CAPACITY, REVENUE, PRICE AND GROSS MARGIN (2017-2022)
- 7.4.3 NORTHAM PLATINUM MAIN BUSINESS AND MARKETS SERVED
- 7.4.4 NORTHAM PLATINUM RECENT DEVELOPMENTS/UPDATES
- 7.5 NORNICKEL
- 7.5.1 NORNICKEL PLATINUM INGOTS CORPORATION INFORMATION
- 7.5.2 NORNICKEL PLATINUM INGOTS PRODUCT PORTFOLIO
- 7.5.3 NORNICKEL PLATINUM INGOTS PRODUCTION CAPACITY, REVENUE, PRICE AND GROSS MARGIN (2017-2022)
- 7.5.4 NORNICKEL MAIN BUSINESS AND MARKETS SERVED
- 7.5.5 NORNICKEL RECENT DEVELOPMENTS/UPDATES
- 7.6 HERAEUS
- 7.6.1 HERAEUS PLATINUM INGOTS CORPORATION INFORMATION
- 7.6.2 HERAEUS PLATINUM INGOTS PRODUCT PORTFOLIO
- 7.6.3 HERAEUS PLATINUM INGOTS PRODUCTION CAPACITY, REVENUE, PRICE AND GROSS MARGIN (2017-2022)
- 7.6.4 HERAEUS MAIN BUSINESS AND MARKETS SERVED
- 7.7 AMERICAN ELEMENTS
- 7.7.1 AMERICAN ELEMENTS PLATINUM INGOTS CORPORATION INFORMATION
- 7.7.2 AMERICAN ELEMENTS PLATINUM INGOTS PRODUCT PORTFOLIO
- 7.7.3 AMERICAN ELEMENTS PLATINUM INGOTS PRODUCTION CAPACITY, REVENUE, PRICE AND GROSS MARGIN (2017-2022)
- 7.7.4 AMERICAN ELEMENTS MAIN BUSINESS AND MARKETS SERVED
- 7.8 SINO-PLATINUM METALS
- 7.8.1 SINO-PLATINUM METALS PLATINUM INGOTS CORPORATION INFORMATION
- 7.8.2 SINO-PLATINUM METALS PLATINUM INGOTS PRODUCT PORTFOLIO
- 7.8.3 SINO-PLATINUM METALS PLATINUM INGOTS PRODUCTION CAPACITY, REVENUE, PRICE AND GROSS MARGIN (2017-2022)
- 7.8.4 SINO-PLATINUM METALS MAIN BUSINESS AND MARKETS SERVED
- 7.9 JIANGSU BGRIMM METAL RECYCLING
- 7.9.1 JIANGSU BGRIMM METAL RECYCLING PLATINUM INGOTS CORPORATION INFORMATION
- 7.9.2 JIANGSU BGRIMM METAL RECYCLING PLATINUM INGOTS PRODUCT PORTFOLIO
- 7.9.3 JIANGSU BGRIMM METAL RECYCLING PLATINUM INGOTS PRODUCTION CAPACITY, REVENUE, PRICE AND GROSS MARGIN (2017-2022)
- 7.9.4 JIANGSU BGRIMM METAL RECYCLING MAIN BUSINESS AND MARKETS SERVED
8 PLATINUM INGOTS MANUFACTURING COST ANALYSIS
- 8.1 PLATINUM INGOTS KEY RAW MATERIALS ANALYSIS
- 8.1.1 KEY RAW MATERIALS
- 8.1.2 KEY SUPPLIERS OF RAW MATERIALS
- 8.2 MANUFACTURING PROCESS ANALYSIS OF PLATINUM INGOTS
- 8.3 PLATINUM INGOTS INDUSTRIAL CHAIN ANALYSIS
9 MARKETING CHANNEL, DISTRIBUTORS AND CUSTOMERS
- 9.1 MARKETING CHANNEL
- 9.2 PLATINUM INGOTS DISTRIBUTORS LIST
- 9.3 PLATINUM INGOTS CUSTOMERS
10 PLATINUM INGOTS MARKET DYNAMICS
- 10.1 PLATINUM INGOTS INDUSTRY TRENDS AND DRIVERS
- 10.2 PLATINUM INGOTS MARKET CHALLENGES AND RESTRAINTS
11 PRODUCTION AND SUPPLY FORECAST
- 11.1 GLOBAL FORECASTED PRODUCTION OF PLATINUM INGOTS BY REGION (2023-2028)
- 11.2 SOUTH AFRICA PLATINUM INGOTS PRODUCTION, REVENUE FORECAST (2023-2028)
- 11.3 RUSSIA PLATINUM INGOTS PRODUCTION, REVENUE FORECAST (2023-2028)
- 11.4 ZIMBABWE PLATINUM INGOTS PRODUCTION, REVENUE FORECAST (2023-2028)
- 11.5 CANADA PLATINUM INGOTS PRODUCTION, REVENUE FORECAST (2023-2028)
- 11.6 U.S. PLATINUM INGOTS PRODUCTION, REVENUE FORECAST (2023-2028)
12 CONSUMPTION AND DEMAND FORECAST
- 12.1 GLOBAL FORECASTED DEMAND ANALYSIS OF PLATINUM INGOTS
- 12.2 NORTH AMERICA FORECASTED CONSUMPTION OF PLATINUM INGOTS BY COUNTRY
- 12.3 EUROPE MARKET FORECASTED CONSUMPTION OF PLATINUM INGOTS BY COUNTRY
- 12.4 ASIA PACIFIC MARKET FORECASTED CONSUMPTION OF PLATINUM INGOTS BY REGION
- 12.5 LATIN AMERICA FORECASTED CONSUMPTION OF PLATINUM INGOTS BY COUNTRY
13 FORECAST BY TYPE AND BY APPLICATION
- 13.1 GLOBAL PRODUCTION, REVENUE AND PRICE FORECAST BY TYPE (2023-2028)
- 13.1.1 GLOBAL FORECASTED PRODUCTION OF PLATINUM INGOTS BY TYPE (2023-2028)
- 13.1.2 GLOBAL FORECASTED REVENUE OF PLATINUM INGOTS BY TYPE (2023-2028)
- 13.1.3 GLOBAL FORECASTED PRICE OF PLATINUM INGOTS BY TYPE (2023-2028)
- 13.2 GLOBAL PRODUCTION, REVENUE AND PRICE FORECAST BY APPLICATION (2023-2028)
- 13.2.1 GLOBAL FORECASTED PRODUCTION OF PLATINUM INGOTS BY APPLICATION (2023-2028)
- 13.2.2 GLOBAL FORECASTED REVENUE OF PLATINUM INGOTS BY APPLICATION (2023-2028)
- 13.2.3 GLOBAL FORECASTED PRICE OF PLATINUM INGOTS BY APPLICATION (2023-2028)
14 RESEARCH FINDINGS AND CONCLUSION
15 METHODOLOGY AND DATA SOURCE
- 15.1 METHODOLOGY/RESEARCH APPROACH
- 15.1.1 RESEARCH PROGRAMS/DESIGN
- 15.1.2 MARKET SIZE ESTIMATION
- 15.1.3 MARKET BREAKDOWN AND DATA TRIANGULATION
- 15.2 DATA SOURCE
- 15.2.1 SECONDARY SOURCES
- 15.2.2 PRIMARY SOURCES
- 15.3 AUTHOR LIST
- 15.4 DISCLAIMER